
 Login Sign Up


| |||||
 |  | ||||

| 12Stocks.com Market Intelligence |
Best MidCap Stocks
|
| In a hurry? Mid Cap Stocks Lists: Performance Trends Table, Stock Charts
Sort midcap stocks: Daily, Weekly, Year-to-Date, Market Cap & Trends. Filter midcap stocks list by sector: Show all, Tech, Finance, Energy, Staples, Retail, Industrial, Materials, Utilities and HealthCare Filter midcap stocks list by size:All MidCap Large Mid-Range Small |
| 12Stocks.com Mid Cap Stocks Performances & Trends Daily | |||||||||
|
|  The overall Smart Investing & Trading Score is 63 (0-bearish to 100-bullish) which puts Mid Cap index in short term neutral to bullish trend. The Smart Investing & Trading Score from previous trading session is 44 and hence an improvement of trend.
| ||||||||
Here are the Smart Investing & Trading Scores of the most requested mid cap stocks at 12Stocks.com (click stock name for detailed review):
|


| 12Stocks.com: Top Performing Mid Cap Index Stocks | ||||||||||||||||||||||||||||||||||||||||||||||||
 The top performing Mid Cap Index stocks year to date are
Now, more recently, over last week, the top performing Mid Cap Index stocks on the move are


|
||||||||||||||||||||||||||||||||||||||||||||||||
| 12Stocks.com: Investing in Midcap Index with Stocks | |
|
The following table helps investors and traders sort through current performance and trends (as measured by Smart Investing & Trading Score) of various
stocks in the Midcap Index. Quick View: Move mouse or cursor over stock symbol (ticker) to view short-term technical chart and over stock name to view long term chart. Click on  to add stock symbol to your watchlist and to add stock symbol to your watchlist and  to view watchlist. Click on any ticker or stock name for detailed market intelligence report for that stock. to view watchlist. Click on any ticker or stock name for detailed market intelligence report for that stock. |
12Stocks.com Performance of Stocks in Midcap Index
| Ticker | Stock Name | Watchlist | Category | Recent Price | Smart Investing & Trading Score | Change % | YTD Change% |
| FWONK | Formula One |   | Services & Goods | 68.87 | 81 | 1.16% | 9.09% |
| HUBS | HubSpot | | Technology | 633.04 | 34 | 0.29% | 9.04% |
| PNR | Pentair | | Industrials | 79.20 | 56 | 0.85% | 8.93% |
| WWD | Woodward | | Industrials | 148.24 | 56 | 0.51% | 8.90% |
| RBA | Ritchie Bros. | | Services & Goods | 72.82 | 51 | 0.29% | 8.87% |
| CPRT | Copart | | Services & Goods | 53.30 | 36 | 0.79% | 8.78% |
| BG | Bunge | | Consumer Staples | 109.75 | 100 | 0.21% | 8.72% |
| CAG | Conagra | | Consumer Staples | 31.10 | 85 | 1.57% | 8.51% |
| OMC | Omnicom | | Services & Goods | 93.77 | 90 | 1.24% | 8.39% |
| IRM | Iron Mountain | | Technology | 75.85 | 58 | 1.00% | 8.39% |
| AFG | American Financial | | Financials | 128.85 | 75 | 0.77% | 8.38% |
| HES | Hess | | Energy | 156.23 | 80 | 1.22% | 8.37% |
| TTD | Trade Desk | | Technology | 77.84 | 36 | 0.70% | 8.17% |
| LECO | Loln Electric | | Industrials | 235.16 | 44 | -1.34% | 8.14% |
| EMN | Eastman Chemical | | Materials | 97.06 | 68 | 0.66% | 8.06% |
| AME | AMETEK | | Industrials | 177.86 | 51 | 0.09% | 7.87% |
| NEU | NewMarket | | Materials | 588.51 | 58 | 0.37% | 7.82% |
| JEF | Jefferies Financial | | Financials | 43.53 | 78 | 3.23% | 7.72% |
| HIW | Highwoods Properties | | Financials | 24.71 | 76 | 2.19% | 7.62% |
| OTIS | Otis Worldwide | | Industrials | 96.29 | 68 | 0.53% | 7.62% |
| MAS | Masco | | Industrials | 72.02 | 44 | 0.15% | 7.52% |
| PRU | Prudential Financial | | Financials | 111.47 | 70 | 0.78% | 7.48% |
| TNDM | Tandem Diabetes | | Health Care | 31.76 | 53 | 4.37% | 7.37% |
| HLT | Hilton Worldwide | | Services & Goods | 195.14 | 36 | 0.34% | 7.17% |
| HAL | Halliburton | | Energy | 38.72 | 68 | -0.92% | 7.11% |
| For chart view version of above stock list: Chart View ➞ 0 - 25 , 25 - 50 , 50 - 75 , 75 - 100 , 100 - 125 , 125 - 150 , 150 - 175 , 175 - 200 , 200 - 225 , 225 - 250 , 250 - 275 , 275 - 300 , 300 - 325 , 325 - 350 , 350 - 375 , 375 - 400 , 400 - 425 , 425 - 450 , 450 - 475 , 475 - 500 , 500 - 525 , 525 - 550 , 550 - 575 , 575 - 600 , 600 - 625 , 625 - 650 , 650 - 675 , 675 - 700 , 700 - 725 , 725 - 750 , 750 - 775 | ||
 | Click To Change The Sort Order: By Market Cap or Company Size Performance: Year-to-date, Week and Day |  |
|
Get the most comprehensive stock market coverage daily at 12Stocks.com ➞ Best Stocks Today ➞ Best Stocks Weekly ➞ Best Stocks Year-to-Date ➞ Best Stocks Trends ➞  Best Stocks Today 12Stocks.com Best Nasdaq Stocks ➞ Best S&P 500 Stocks ➞ Best Tech Stocks ➞ Best Biotech Stocks ➞ |
| Detailed Overview of Midcap Stocks |
| Midcap Technical Overview, Leaders & Laggards, Top Midcap ETF Funds & Detailed Midcap Stocks List, Charts, Trends & More |
| Midcap: Technical Analysis, Trends & YTD Performance | |
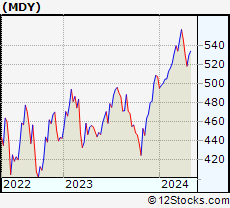
| MidCap segment as represented by
MDY, an exchange-traded fund [ETF], holds basket of about four hundred midcap stocks from across all major sectors of the US stock market. The midcap index (contains stocks like Green Mountain Coffee Roasters and Tractor Supply Company) is up by 3.18% and is currently underperforming the overall market by -1.21% year-to-date. Below is a quick view of technical charts and trends: | |
 MDY Weekly Chart |
|
| Long Term Trend: Good | |
| Medium Term Trend: Not Good | |
 MDY Daily Chart |
|
| Short Term Trend: Very Good | |
| Overall Trend Score: 63 | |
| YTD Performance: 3.18% | |
| **Trend Scores & Views Are Only For Educational Purposes And Not For Investing | |
| 12Stocks.com: Investing in Midcap Index using Exchange Traded Funds | |
|
The following table shows list of key exchange traded funds (ETF) that
help investors track Midcap index. The following list also includes leveraged ETF funds that track twice or thrice the daily returns of Midcap indices. Short or inverse ETF funds move in the opposite direction to the index they track and are useful during market pullbacks or during bear markets. Quick View: Move mouse or cursor over ETF symbol (ticker) to view short-term technical chart and over ETF name to view long term chart. Click on ticker or stock name for detailed view. Click on to add stock symbol to your watchlist and to view watchlist. |
12Stocks.com List of ETFs that track Midcap Index
| Ticker | ETF Name | Watchlist | Recent Price | Smart Investing & Trading Score | Change % | Week % | Year-to-date % |
| IWS | iShares Russell Mid-Cap Value | | 118.80 | 68 | 0.98 | 0.98 | 2.16% |
| IWP | iShares Russell Mid-Cap Growth | | 106.71 | 51 | 0.96 | 0.96 | 2.15% |
| IWR | iShares Russell Mid-Cap | | 79.38 | 56 | 0.92 | 0.92 | 2.12% |
| IJH | iShares Core S&P Mid-Cap | | 56.81 | 56 | 0.42 | 0.42 | 2.5% |
| MDY | SPDR S&P MidCap 400 ETF | | 523.50 | 63 | 1.01 | 1.01 | 3.18% |
| IJK | iShares S&P Mid-Cap 400 Growth | | 85.58 | 56 | 0.86 | 0.86 | 8.03% |
| IJJ | iShares S&P Mid-Cap 400 Value | | 111.54 | 63 | 0.90 | 0.9 | -2.19% |
| MYY | ProShares Short MidCap400 | | 20.97 | 32 | -1.04 | -1.04 | -2.26% |
| XMLV | PowerShares S&P MidCap Low Volatil ETF | | 54.54 | 75 | 0.70 | 0.7 | 2.56% |
| MZZ | ProShares UltraShort MidCap400 | | 11.96 | 27 | -1.73 | -1.73 | -4.86% |
| SMDD | ProShares UltraPro Short MidCap400 | | 12.11 | 32 | -3.60 | -3.6 | -10.05% |
| UMDD | ProShares UltraPro MidCap400 | | 23.17 | 63 | 2.69 | 2.69 | 3.81% |
| MVV | ProShares Ultra MidCap400 | | 60.29 | 63 | 2.19 | 2.19 | 4.15% |
| 12Stocks.com: Charts, Trends, Fundamental Data and Performances of MidCap Stocks | |
|
We now take in-depth look at all MidCap stocks including charts, multi-period performances and overall trends (as measured by Smart Investing & Trading Score). One can sort MidCap stocks (click link to choose) by Daily, Weekly and by Year-to-Date performances. Also, one can sort by size of the company or by market capitalization. |
| Select Your Default Chart Type: | |||||
| |||||
| Click on stock symbol or name for detailed view. Click on to add stock symbol to your watchlist and to view watchlist. Quick View: Move mouse or cursor over "Daily" to quickly view daily technical stock chart and over "Weekly" to view weekly technical stock chart. | |||||

 | FWONK Formula One Group |
| Sector: Services & Goods | |
| SubSector: Broadcasting - TV | |
| MarketCap: 4677.53 Millions | |
| Recent Price: 68.87 Smart Investing & Trading Score: 81 | |
| Day Percent Change: 1.16% Day Change: 0.79 | |
| Week Change: 1.16% Year-to-date Change: 9.1% | |
| FWONK Links: Profile News Message Board | |
| Charts:- Daily , Weekly | |
| Add FWONK to Watchlist: View: Get Complete FWONK Trend Analysis ➞ | |
 | HUBS HubSpot, Inc. |
| Sector: Technology | |
| SubSector: Application Software | |
| MarketCap: 5715.12 Millions | |
| Recent Price: 633.04 Smart Investing & Trading Score: 34 | |
| Day Percent Change: 0.29% Day Change: 1.80 | |
| Week Change: 0.29% Year-to-date Change: 9.0% | |
| HUBS Links: Profile News Message Board | |
| Charts:- Daily , Weekly | |
| Add HUBS to Watchlist: View: Get Complete HUBS Trend Analysis ➞ | |
 | PNR Pentair plc |
| Sector: Industrials | |
| SubSector: Industrial Equipment & Components | |
| MarketCap: 4326.59 Millions | |
| Recent Price: 79.20 Smart Investing & Trading Score: 56 | |
| Day Percent Change: 0.85% Day Change: 0.67 | |
| Week Change: 0.85% Year-to-date Change: 8.9% | |
| PNR Links: Profile News Message Board | |
| Charts:- Daily , Weekly | |
| Add PNR to Watchlist: View: Get Complete PNR Trend Analysis ➞ | |
 | WWD Woodward, Inc. |
| Sector: Industrials | |
| SubSector: Aerospace/Defense Products & Services | |
| MarketCap: 3764.01 Millions | |
| Recent Price: 148.24 Smart Investing & Trading Score: 56 | |
| Day Percent Change: 0.51% Day Change: 0.75 | |
| Week Change: 0.51% Year-to-date Change: 8.9% | |
| WWD Links: Profile News Message Board | |
| Charts:- Daily , Weekly | |
| Add WWD to Watchlist: View: Get Complete WWD Trend Analysis ➞ | |
 | RBA Ritchie Bros. Auctioneers Incorporated |
| Sector: Services & Goods | |
| SubSector: Business Services | |
| MarketCap: 3491.02 Millions | |
| Recent Price: 72.82 Smart Investing & Trading Score: 51 | |
| Day Percent Change: 0.29% Day Change: 0.21 | |
| Week Change: 0.29% Year-to-date Change: 8.9% | |
| RBA Links: Profile News Message Board | |
| Charts:- Daily , Weekly | |
| Add RBA to Watchlist: View: Get Complete RBA Trend Analysis ➞ | |
 | CPRT Copart, Inc. |
| Sector: Services & Goods | |
| SubSector: Auto Dealerships | |
| MarketCap: 15462.1 Millions | |
| Recent Price: 53.30 Smart Investing & Trading Score: 36 | |
| Day Percent Change: 0.79% Day Change: 0.42 | |
| Week Change: 0.79% Year-to-date Change: 8.8% | |
| CPRT Links: Profile News Message Board | |
| Charts:- Daily , Weekly | |
| Add CPRT to Watchlist: View: Get Complete CPRT Trend Analysis ➞ | |
 | BG Bunge Limited |
| Sector: Consumer Staples | |
| SubSector: Farm Products | |
| MarketCap: 4975.77 Millions | |
| Recent Price: 109.75 Smart Investing & Trading Score: 100 | |
| Day Percent Change: 0.21% Day Change: 0.23 | |
| Week Change: 0.21% Year-to-date Change: 8.7% | |
| BG Links: Profile News Message Board | |
| Charts:- Daily , Weekly | |
| Add BG to Watchlist: View: Get Complete BG Trend Analysis ➞ | |
 | CAG Conagra Brands, Inc. |
| Sector: Consumer Staples | |
| SubSector: Processed & Packaged Goods | |
| MarketCap: 14084.1 Millions | |
| Recent Price: 31.10 Smart Investing & Trading Score: 85 | |
| Day Percent Change: 1.57% Day Change: 0.48 | |
| Week Change: 1.57% Year-to-date Change: 8.5% | |
| CAG Links: Profile News Message Board | |
| Charts:- Daily , Weekly | |
| Add CAG to Watchlist: View: Get Complete CAG Trend Analysis ➞ | |
 | OMC Omnicom Group Inc. |
| Sector: Services & Goods | |
| SubSector: Advertising Agencies | |
| MarketCap: 11813.5 Millions | |
| Recent Price: 93.77 Smart Investing & Trading Score: 90 | |
| Day Percent Change: 1.24% Day Change: 1.15 | |
| Week Change: 1.24% Year-to-date Change: 8.4% | |
| OMC Links: Profile News Message Board | |
| Charts:- Daily , Weekly | |
| Add OMC to Watchlist: View: Get Complete OMC Trend Analysis ➞ | |
 | IRM Iron Mountain Incorporated |
| Sector: Technology | |
| SubSector: Business Software & Services | |
| MarketCap: 7339.18 Millions | |
| Recent Price: 75.85 Smart Investing & Trading Score: 58 | |
| Day Percent Change: 1.00% Day Change: 0.75 | |
| Week Change: 1% Year-to-date Change: 8.4% | |
| IRM Links: Profile News Message Board | |
| Charts:- Daily , Weekly | |
| Add IRM to Watchlist: View: Get Complete IRM Trend Analysis ➞ | |
 | AFG American Financial Group, Inc. |
| Sector: Financials | |
| SubSector: Property & Casualty Insurance | |
| MarketCap: 5353.82 Millions | |
| Recent Price: 128.85 Smart Investing & Trading Score: 75 | |
| Day Percent Change: 0.77% Day Change: 0.99 | |
| Week Change: 0.77% Year-to-date Change: 8.4% | |
| AFG Links: Profile News Message Board | |
| Charts:- Daily , Weekly | |
| Add AFG to Watchlist: View: Get Complete AFG Trend Analysis ➞ | |
 | HES Hess Corporation |
| Sector: Energy | |
| SubSector: Independent Oil & Gas | |
| MarketCap: 10465.3 Millions | |
| Recent Price: 156.23 Smart Investing & Trading Score: 80 | |
| Day Percent Change: 1.22% Day Change: 1.88 | |
| Week Change: 1.22% Year-to-date Change: 8.4% | |
| HES Links: Profile News Message Board | |
| Charts:- Daily , Weekly | |
| Add HES to Watchlist: View: Get Complete HES Trend Analysis ➞ | |
 | TTD The Trade Desk, Inc. |
| Sector: Technology | |
| SubSector: Application Software | |
| MarketCap: 9006.92 Millions | |
| Recent Price: 77.84 Smart Investing & Trading Score: 36 | |
| Day Percent Change: 0.70% Day Change: 0.54 | |
| Week Change: 0.7% Year-to-date Change: 8.2% | |
| TTD Links: Profile News Message Board | |
| Charts:- Daily , Weekly | |
| Add TTD to Watchlist: View: Get Complete TTD Trend Analysis ➞ | |
 | LECO Lincoln Electric Holdings, Inc. |
| Sector: Industrials | |
| SubSector: Small Tools & Accessories | |
| MarketCap: 4085.06 Millions | |
| Recent Price: 235.16 Smart Investing & Trading Score: 44 | |
| Day Percent Change: -1.34% Day Change: -3.20 | |
| Week Change: -1.34% Year-to-date Change: 8.1% | |
| LECO Links: Profile News Message Board | |
| Charts:- Daily , Weekly | |
| Add LECO to Watchlist: View: Get Complete LECO Trend Analysis ➞ | |
 | EMN Eastman Chemical Company |
| Sector: Materials | |
| SubSector: Chemicals - Major Diversified | |
| MarketCap: 6217.06 Millions | |
| Recent Price: 97.06 Smart Investing & Trading Score: 68 | |
| Day Percent Change: 0.66% Day Change: 0.64 | |
| Week Change: 0.66% Year-to-date Change: 8.1% | |
| EMN Links: Profile News Message Board | |
| Charts:- Daily , Weekly | |
| Add EMN to Watchlist: View: Get Complete EMN Trend Analysis ➞ | |
 | AME AMETEK, Inc. |
| Sector: Industrials | |
| SubSector: Diversified Machinery | |
| MarketCap: 16611.8 Millions | |
| Recent Price: 177.86 Smart Investing & Trading Score: 51 | |
| Day Percent Change: 0.09% Day Change: 0.16 | |
| Week Change: 0.09% Year-to-date Change: 7.9% | |
| AME Links: Profile News Message Board | |
| Charts:- Daily , Weekly | |
| Add AME to Watchlist: View: Get Complete AME Trend Analysis ➞ | |
 | NEU NewMarket Corporation |
| Sector: Materials | |
| SubSector: Specialty Chemicals | |
| MarketCap: 4543.77 Millions | |
| Recent Price: 588.51 Smart Investing & Trading Score: 58 | |
| Day Percent Change: 0.37% Day Change: 2.17 | |
| Week Change: 0.37% Year-to-date Change: 7.8% | |
| NEU Links: Profile News Message Board | |
| Charts:- Daily , Weekly | |
| Add NEU to Watchlist: View: Get Complete NEU Trend Analysis ➞ | |
 | JEF Jefferies Financial Group Inc. |
| Sector: Financials | |
| SubSector: Investment Brokerage - Regional | |
| MarketCap: 3987.15 Millions | |
| Recent Price: 43.53 Smart Investing & Trading Score: 78 | |
| Day Percent Change: 3.23% Day Change: 1.36 | |
| Week Change: 3.23% Year-to-date Change: 7.7% | |
| JEF Links: Profile News Message Board | |
| Charts:- Daily , Weekly | |
| Add JEF to Watchlist: View: Get Complete JEF Trend Analysis ➞ | |
 | HIW Highwoods Properties, Inc. |
| Sector: Financials | |
| SubSector: REIT - Office | |
| MarketCap: 3227.46 Millions | |
| Recent Price: 24.71 Smart Investing & Trading Score: 76 | |
| Day Percent Change: 2.19% Day Change: 0.53 | |
| Week Change: 2.19% Year-to-date Change: 7.6% | |
| HIW Links: Profile News Message Board | |
| Charts:- Daily , Weekly | |
| Add HIW to Watchlist: View: Get Complete HIW Trend Analysis ➞ | |
 | OTIS Otis Worldwide Corporation |
| Sector: Industrials | |
| SubSector: Specialty Industrial Machinery | |
| MarketCap: 27727 Millions | |
| Recent Price: 96.29 Smart Investing & Trading Score: 68 | |
| Day Percent Change: 0.53% Day Change: 0.51 | |
| Week Change: 0.53% Year-to-date Change: 7.6% | |
| OTIS Links: Profile News Message Board | |
| Charts:- Daily , Weekly | |
| Add OTIS to Watchlist: View: Get Complete OTIS Trend Analysis ➞ | |
 | MAS Masco Corporation |
| Sector: Industrials | |
| SubSector: General Building Materials | |
| MarketCap: 8655.63 Millions | |
| Recent Price: 72.02 Smart Investing & Trading Score: 44 | |
| Day Percent Change: 0.15% Day Change: 0.11 | |
| Week Change: 0.15% Year-to-date Change: 7.5% | |
| MAS Links: Profile News Message Board | |
| Charts:- Daily , Weekly | |
| Add MAS to Watchlist: View: Get Complete MAS Trend Analysis ➞ | |
 | PRU Prudential Financial, Inc. |
| Sector: Financials | |
| SubSector: Life Insurance | |
| MarketCap: 21001.6 Millions | |
| Recent Price: 111.47 Smart Investing & Trading Score: 70 | |
| Day Percent Change: 0.78% Day Change: 0.86 | |
| Week Change: 0.78% Year-to-date Change: 7.5% | |
| PRU Links: Profile News Message Board | |
| Charts:- Daily , Weekly | |
| Add PRU to Watchlist: View: Get Complete PRU Trend Analysis ➞ | |
 | TNDM Tandem Diabetes Care, Inc. |
| Sector: Health Care | |
| SubSector: Medical Instruments & Supplies | |
| MarketCap: 3359.1 Millions | |
| Recent Price: 31.76 Smart Investing & Trading Score: 53 | |
| Day Percent Change: 4.37% Day Change: 1.33 | |
| Week Change: 4.37% Year-to-date Change: 7.4% | |
| TNDM Links: Profile News Message Board | |
| Charts:- Daily , Weekly | |
| Add TNDM to Watchlist: View: Get Complete TNDM Trend Analysis ➞ | |
 | HLT Hilton Worldwide Holdings Inc. |
| Sector: Services & Goods | |
| SubSector: Lodging | |
| MarketCap: 18064.6 Millions | |
| Recent Price: 195.14 Smart Investing & Trading Score: 36 | |
| Day Percent Change: 0.34% Day Change: 0.67 | |
| Week Change: 0.34% Year-to-date Change: 7.2% | |
| HLT Links: Profile News Message Board | |
| Charts:- Daily , Weekly | |
| Add HLT to Watchlist: View: Get Complete HLT Trend Analysis ➞ | |
 | HAL Halliburton Company |
| Sector: Energy | |
| SubSector: Oil & Gas Equipment & Services | |
| MarketCap: 5419.41 Millions | |
| Recent Price: 38.72 Smart Investing & Trading Score: 68 | |
| Day Percent Change: -0.92% Day Change: -0.36 | |
| Week Change: -0.92% Year-to-date Change: 7.1% | |
| HAL Links: Profile News Message Board | |
| Charts:- Daily , Weekly | |
| Add HAL to Watchlist: View: Get Complete HAL Trend Analysis ➞ | |
| For tabular summary view of above stock list: Summary View ➞ 0 - 25 , 25 - 50 , 50 - 75 , 75 - 100 , 100 - 125 , 125 - 150 , 150 - 175 , 175 - 200 , 200 - 225 , 225 - 250 , 250 - 275 , 275 - 300 , 300 - 325 , 325 - 350 , 350 - 375 , 375 - 400 , 400 - 425 , 425 - 450 , 450 - 475 , 475 - 500 , 500 - 525 , 525 - 550 , 550 - 575 , 575 - 600 , 600 - 625 , 625 - 650 , 650 - 675 , 675 - 700 , 700 - 725 , 725 - 750 , 750 - 775 | ||
| Click To Change The Sort Order: By Market Cap or Company Size Performance: Year-to-date, Week and Day | |
| Select Chart Type: | ||
|
Best Stocks Today 12Stocks.com |
© 2024 12Stocks.com Terms & Conditions Privacy Contact Us
All Information Provided Only For Education And Not To Be Used For Investing or Trading. See Terms & Conditions


One More Thing ... Get Best Stocks Delivered Daily!
Never Ever Miss A Move With Our Top Ten Stocks Lists
Find Best Stocks In Any Market - Bull or Bear Market
Take A Peek At Our Top Ten Stocks Lists: Daily, Weekly, Year-to-Date & Top Trends
Find Best Stocks In Any Market - Bull or Bear Market
Take A Peek At Our Top Ten Stocks Lists: Daily, Weekly, Year-to-Date & Top Trends
Midcap Stocks With Best Up Trends [0-bearish to 100-bullish]: United Airlines[100], EQT [100], Wendy s[100], Bentley [100], Campbell Soup[100], Commerce Bancshares[100], Grocery Outlet[100], Ally Financial[100], Hanover Insurance[100], UDR [100], M&T Bank[100]
Best Midcap Stocks Year-to-Date:
Vistra Energy[73.21%], ShockWave Medical[72.44%], AppLovin [70.55%], Constellation Energy[56.45%], EMCOR [54.38%], Spotify [44.88%], Pure Storage[41.64%], Natera [41.46%], Williams-Sonoma [38.87%], Coupang [38.64%], Kinsale Capital[38.31%] Best Midcap Stocks This Week:
AMC Entertainment[8.23%], Coinbase Global[7.07%], Kohl s[6.51%], New York[5.76%], United Airlines[4.98%], Tandem Diabetes[4.37%], Crocs [4.02%], Ardagh Metal[4.01%], MongoDB [3.92%], Natera [3.9%], Enphase Energy[3.78%] Best Midcap Stocks Daily:
AMC Entertainment[8.23%], Coinbase Global[7.07%], Kohl s[6.51%], New York[5.76%], United Airlines[4.98%], Tandem Diabetes[4.37%], Crocs [4.02%], Ardagh Metal[4.01%], MongoDB [3.92%], Natera [3.90%], Enphase Energy[3.78%]