
 Login Sign Up


| |||||
 |  | ||||

| 12Stocks.com Market Intelligence |
Best MidCap Stocks
|
| In a hurry? Mid Cap Stocks Lists: Performance Trends Table, Stock Charts
Sort midcap stocks: Daily, Weekly, Year-to-Date, Market Cap & Trends. Filter midcap stocks list by sector: Show all, Tech, Finance, Energy, Staples, Retail, Industrial, Materials, Utilities and HealthCare Filter midcap stocks list by size:All MidCap Large Mid-Range Small |
| 12Stocks.com Mid Cap Stocks Performances & Trends Daily | |||||||||
|
|  The overall Smart Investing & Trading Score is 70 (0-bearish to 100-bullish) which puts Mid Cap index in short term neutral to bullish trend. The Smart Investing & Trading Score from previous trading session is 56 and hence an improvement of trend.
| ||||||||
Here are the Smart Investing & Trading Scores of the most requested mid cap stocks at 12Stocks.com (click stock name for detailed review):
|


| 12Stocks.com: Top Performing Mid Cap Index Stocks | ||||||||||||||||||||||||||||||||||||||||||||||||
 The top performing Mid Cap Index stocks year to date are
Now, more recently, over last week, the top performing Mid Cap Index stocks on the move are


|
||||||||||||||||||||||||||||||||||||||||||||||||
| 12Stocks.com: Investing in Midcap Index with Stocks | |
|
The following table helps investors and traders sort through current performance and trends (as measured by Smart Investing & Trading Score) of various
stocks in the Midcap Index. Quick View: Move mouse or cursor over stock symbol (ticker) to view short-term technical chart and over stock name to view long term chart. Click on  to add stock symbol to your watchlist and to add stock symbol to your watchlist and  to view watchlist. Click on any ticker or stock name for detailed market intelligence report for that stock. to view watchlist. Click on any ticker or stock name for detailed market intelligence report for that stock. |
12Stocks.com Performance of Stocks in Midcap Index
| Ticker | Stock Name | Watchlist | Category | Recent Price | Smart Investing & Trading Score | Change % | Weekly Change% |
| CMA | Comerica |   | Financials | 51.42 | 18 | -1.25% | -1.25% |
| MRVL | Marvell | | Technology | 68.75 | 75 | -1.25% | -1.25% |
| DT | Dynatrace | | Technology | 46.51 | 40 | -1.25% | -1.25% |
| DTM | DT Midstream | | Energy | 63.21 | 59 | -1.30% | -1.30% |
| FNB | F.N.B | | Financials | 13.56 | 86 | -1.31% | -1.31% |
| MTN | Vail Resorts | | Services & Goods | 195.65 | 10 | -1.35% | -1.35% |
| ICLR | ICON Public | | Health Care | 304.14 | 58 | -1.35% | -1.35% |
| ALGN | Align | | Health Care | 304.82 | 53 | -1.36% | -1.36% |
| NVR | NVR | | Industrials | 7540.00 | 26 | -1.40% | -1.40% |
| IVZ | Invesco | | Financials | 14.46 | 25 | -1.43% | -1.43% |
| PYCR | Paycor HCM | | Technology | 17.62 | 42 | -1.45% | -1.45% |
| BJ | BJ s | | Services & Goods | 75.53 | 54 | -1.46% | -1.46% |
| RLI | RLI | | Financials | 142.03 | 68 | -1.47% | -1.47% |
| PB | Prosperity Bancshares | | Financials | 62.60 | 42 | -1.49% | -1.49% |
| GO | Grocery Outlet | | Services & Goods | 25.78 | 44 | -1.49% | -1.49% |
| PEGA | Pega | | Technology | 60.83 | 85 | -1.57% | -1.57% |
| W | Wayfair | | Services & Goods | 51.17 | 43 | -1.62% | -1.62% |
| TRIP | TripAdvisor | | Technology | 27.00 | 90 | -1.64% | -1.64% |
| CFR | Cullen/Frost Bankers | | Financials | 105.29 | 10 | -1.67% | -1.67% |
| WST | West Pharmaceutical | | Health Care | 354.41 | 0 | -1.67% | -1.67% |
| TROW | T. Rowe | | Financials | 112.08 | 61 | -1.70% | -1.70% |
| AMBP | Ardagh Metal | | Services & Goods | 3.98 | 88 | -1.73% | -1.73% |
| FHB | First Hawaiian | | Financials | 21.51 | 55 | -1.74% | -1.74% |
| KEX | Kirby | | Transports | 109.99 | 88 | -1.79% | -1.79% |
| DDOG | Datadog | | Technology | 129.07 | 90 | -1.81% | -1.81% |
| For chart view version of above stock list: Chart View ➞ 0 - 25 , 25 - 50 , 50 - 75 , 75 - 100 , 100 - 125 , 125 - 150 , 150 - 175 , 175 - 200 , 200 - 225 , 225 - 250 , 250 - 275 , 275 - 300 , 300 - 325 , 325 - 350 , 350 - 375 , 375 - 400 , 400 - 425 , 425 - 450 , 450 - 475 , 475 - 500 , 500 - 525 , 525 - 550 , 550 - 575 , 575 - 600 , 600 - 625 , 625 - 650 , 650 - 675 , 675 - 700 , 700 - 725 , 725 - 750 , 750 - 775 | ||
 | Click To Change The Sort Order: By Market Cap or Company Size Performance: Year-to-date, Week and Day |  |
|
Get the most comprehensive stock market coverage daily at 12Stocks.com ➞ Best Stocks Today ➞ Best Stocks Weekly ➞ Best Stocks Year-to-Date ➞ Best Stocks Trends ➞  Best Stocks Today 12Stocks.com Best Nasdaq Stocks ➞ Best S&P 500 Stocks ➞ Best Tech Stocks ➞ Best Biotech Stocks ➞ |
| Detailed Overview of Midcap Stocks |
| Midcap Technical Overview, Leaders & Laggards, Top Midcap ETF Funds & Detailed Midcap Stocks List, Charts, Trends & More |
| Midcap: Technical Analysis, Trends & YTD Performance | |
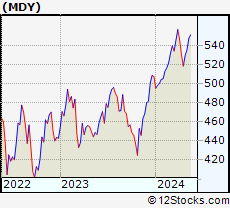
| MidCap segment as represented by
MDY, an exchange-traded fund [ETF], holds basket of about four hundred midcap stocks from across all major sectors of the US stock market. The midcap index (contains stocks like Green Mountain Coffee Roasters and Tractor Supply Company) is up by 4.91% and is currently underperforming the overall market by -1.65% year-to-date. Below is a quick view of technical charts and trends: | |
 MDY Weekly Chart |
|
| Long Term Trend: Very Good | |
| Medium Term Trend: Good | |
 MDY Daily Chart |
|
| Short Term Trend: Very Good | |
| Overall Trend Score: 70 | |
| YTD Performance: 4.91% | |
| **Trend Scores & Views Are Only For Educational Purposes And Not For Investing | |
| 12Stocks.com: Investing in Midcap Index using Exchange Traded Funds | |
|
The following table shows list of key exchange traded funds (ETF) that
help investors track Midcap index. The following list also includes leveraged ETF funds that track twice or thrice the daily returns of Midcap indices. Short or inverse ETF funds move in the opposite direction to the index they track and are useful during market pullbacks or during bear markets. Quick View: Move mouse or cursor over ETF symbol (ticker) to view short-term technical chart and over ETF name to view long term chart. Click on ticker or stock name for detailed view. Click on to add stock symbol to your watchlist and to view watchlist. |
12Stocks.com List of ETFs that track Midcap Index
| Ticker | ETF Name | Watchlist | Recent Price | Smart Investing & Trading Score | Change % | Week % | Year-to-date % |
| IJH | iShares Core S&P Mid-Cap | | 58.17 | 75 | 0.61 | 0.61 | 4.94% |
| IWR | iShares Russell Mid-Cap | | 80.98 | 75 | 0.57 | 0.57 | 4.18% |
| IWP | iShares Russell Mid-Cap Growth | | 109.47 | 78 | 0.45 | 0.45 | 4.8% |
| MDY | SPDR S&P MidCap 400 ETF | | 532.28 | 70 | 0.55 | 0.55 | 4.91% |
| IWS | iShares Russell Mid-Cap Value | | 120.76 | 75 | 0.64 | 0.64 | 3.84% |
| IJK | iShares S&P Mid-Cap 400 Growth | | 87.51 | 70 | 0.59 | 0.59 | 10.46% |
| IJJ | iShares S&P Mid-Cap 400 Value | | 112.85 | 88 | 0.55 | 0.55 | -1.04% |
| XMLV | PowerShares S&P MidCap Low Volatil ETF | | 54.94 | 83 | 0.53 | 0.53 | 3.31% |
| UMDD | ProShares UltraPro MidCap400 | | 24.32 | 71 | 1.50 | 1.5 | 8.96% |
| SMDD | ProShares UltraPro Short MidCap400 | | 11.62 | 10 | -1.78 | -1.78 | -13.69% |
| MYY | ProShares Short MidCap400 | | 20.69 | 18 | -0.48 | -0.48 | -3.56% |
| MZZ | ProShares UltraShort MidCap400 | | 11.59 | 20 | -0.77 | -0.77 | -7.8% |
| MVV | ProShares Ultra MidCap400 | | 61.81 | 83 | 0.61 | 0.61 | 6.76% |
| 12Stocks.com: Charts, Trends, Fundamental Data and Performances of MidCap Stocks | |
|
We now take in-depth look at all MidCap stocks including charts, multi-period performances and overall trends (as measured by Smart Investing & Trading Score). One can sort MidCap stocks (click link to choose) by Daily, Weekly and by Year-to-Date performances. Also, one can sort by size of the company or by market capitalization. |
| Select Your Default Chart Type: | |||||
| |||||
| Click on stock symbol or name for detailed view. Click on to add stock symbol to your watchlist and to view watchlist. Quick View: Move mouse or cursor over "Daily" to quickly view daily technical stock chart and over "Weekly" to view weekly technical stock chart. | |||||

 | CMA Comerica Incorporated |
| Sector: Financials | |
| SubSector: Money Center Banks | |
| MarketCap: 4449.49 Millions | |
| Recent Price: 51.42 Smart Investing & Trading Score: 18 | |
| Day Percent Change: -1.25% Day Change: -0.65 | |
| Week Change: -1.25% Year-to-date Change: -7.9% | |
| CMA Links: Profile News Message Board | |
| Charts:- Daily , Weekly | |
| Add CMA to Watchlist: View: Get Complete CMA Trend Analysis ➞ | |
 | MRVL Marvell Technology Group Ltd. |
| Sector: Technology | |
| SubSector: Semiconductor - Integrated Circuits | |
| MarketCap: 14090.4 Millions | |
| Recent Price: 68.75 Smart Investing & Trading Score: 75 | |
| Day Percent Change: -1.25% Day Change: -0.87 | |
| Week Change: -1.25% Year-to-date Change: 14.0% | |
| MRVL Links: Profile News Message Board | |
| Charts:- Daily , Weekly | |
| Add MRVL to Watchlist: View: Get Complete MRVL Trend Analysis ➞ | |
 | DT Dynatrace, Inc. |
| Sector: Technology | |
| SubSector: Application Software | |
| MarketCap: 7007.12 Millions | |
| Recent Price: 46.51 Smart Investing & Trading Score: 40 | |
| Day Percent Change: -1.25% Day Change: -0.59 | |
| Week Change: -1.25% Year-to-date Change: -15.0% | |
| DT Links: Profile News Message Board | |
| Charts:- Daily , Weekly | |
| Add DT to Watchlist: View: Get Complete DT Trend Analysis ➞ | |
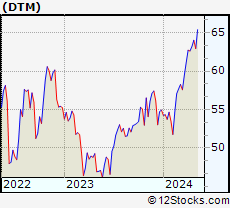 | DTM DT Midstream, Inc. |
| Sector: Energy | |
| SubSector: Oil & Gas Midstream | |
| MarketCap: 4690 Millions | |
| Recent Price: 63.21 Smart Investing & Trading Score: 59 | |
| Day Percent Change: -1.30% Day Change: -0.83 | |
| Week Change: -1.3% Year-to-date Change: 15.0% | |
| DTM Links: Profile News Message Board | |
| Charts:- Daily , Weekly | |
| Add DTM to Watchlist: View: Get Complete DTM Trend Analysis ➞ | |
 | FNB F.N.B. Corporation |
| Sector: Financials | |
| SubSector: Regional - Southeast Banks | |
| MarketCap: 2445.55 Millions | |
| Recent Price: 13.56 Smart Investing & Trading Score: 86 | |
| Day Percent Change: -1.31% Day Change: -0.18 | |
| Week Change: -1.31% Year-to-date Change: -1.5% | |
| FNB Links: Profile News Message Board | |
| Charts:- Daily , Weekly | |
| Add FNB to Watchlist: View: Get Complete FNB Trend Analysis ➞ | |
 | MTN Vail Resorts, Inc. |
| Sector: Services & Goods | |
| SubSector: Resorts & Casinos | |
| MarketCap: 6259.64 Millions | |
| Recent Price: 195.65 Smart Investing & Trading Score: 10 | |
| Day Percent Change: -1.35% Day Change: -2.68 | |
| Week Change: -1.35% Year-to-date Change: -8.4% | |
| MTN Links: Profile News Message Board | |
| Charts:- Daily , Weekly | |
| Add MTN to Watchlist: View: Get Complete MTN Trend Analysis ➞ | |
 | ICLR ICON Public Limited Company |
| Sector: Health Care | |
| SubSector: Medical Laboratories & Research | |
| MarketCap: 7011 Millions | |
| Recent Price: 304.14 Smart Investing & Trading Score: 58 | |
| Day Percent Change: -1.35% Day Change: -4.17 | |
| Week Change: -1.35% Year-to-date Change: 7.4% | |
| ICLR Links: Profile News Message Board | |
| Charts:- Daily , Weekly | |
| Add ICLR to Watchlist: View: Get Complete ICLR Trend Analysis ➞ | |
 | ALGN Align Technology, Inc. |
| Sector: Health Care | |
| SubSector: Medical Appliances & Equipment | |
| MarketCap: 12802 Millions | |
| Recent Price: 304.82 Smart Investing & Trading Score: 53 | |
| Day Percent Change: -1.36% Day Change: -4.20 | |
| Week Change: -1.36% Year-to-date Change: 11.3% | |
| ALGN Links: Profile News Message Board | |
| Charts:- Daily , Weekly | |
| Add ALGN to Watchlist: View: Get Complete ALGN Trend Analysis ➞ | |
 | NVR NVR, Inc. |
| Sector: Industrials | |
| SubSector: Residential Construction | |
| MarketCap: 9912.56 Millions | |
| Recent Price: 7540.00 Smart Investing & Trading Score: 26 | |
| Day Percent Change: -1.40% Day Change: -107.04 | |
| Week Change: -1.4% Year-to-date Change: 7.7% | |
| NVR Links: Profile News Message Board | |
| Charts:- Daily , Weekly | |
| Add NVR to Watchlist: View: Get Complete NVR Trend Analysis ➞ | |
 | IVZ Invesco Ltd. |
| Sector: Financials | |
| SubSector: Asset Management | |
| MarketCap: 4578.23 Millions | |
| Recent Price: 14.46 Smart Investing & Trading Score: 25 | |
| Day Percent Change: -1.43% Day Change: -0.21 | |
| Week Change: -1.43% Year-to-date Change: -19.0% | |
| IVZ Links: Profile News Message Board | |
| Charts:- Daily , Weekly | |
| Add IVZ to Watchlist: View: Get Complete IVZ Trend Analysis ➞ | |
 | PYCR Paycor HCM, Inc. |
| Sector: Technology | |
| SubSector: Software - Application | |
| MarketCap: 4220 Millions | |
| Recent Price: 17.62 Smart Investing & Trading Score: 42 | |
| Day Percent Change: -1.45% Day Change: -0.26 | |
| Week Change: -1.45% Year-to-date Change: -18.7% | |
| PYCR Links: Profile News Message Board | |
| Charts:- Daily , Weekly | |
| Add PYCR to Watchlist: View: Get Complete PYCR Trend Analysis ➞ | |
 | BJ BJ s Wholesale Club Holdings, Inc. |
| Sector: Services & Goods | |
| SubSector: Discount, Variety Stores | |
| MarketCap: 3346.02 Millions | |
| Recent Price: 75.53 Smart Investing & Trading Score: 54 | |
| Day Percent Change: -1.46% Day Change: -1.12 | |
| Week Change: -1.46% Year-to-date Change: 13.3% | |
| BJ Links: Profile News Message Board | |
| Charts:- Daily , Weekly | |
| Add BJ to Watchlist: View: Get Complete BJ Trend Analysis ➞ | |
 | RLI RLI Corp. |
| Sector: Financials | |
| SubSector: Property & Casualty Insurance | |
| MarketCap: 3534.92 Millions | |
| Recent Price: 142.03 Smart Investing & Trading Score: 68 | |
| Day Percent Change: -1.47% Day Change: -2.12 | |
| Week Change: -1.47% Year-to-date Change: 6.7% | |
| RLI Links: Profile News Message Board | |
| Charts:- Daily , Weekly | |
| Add RLI to Watchlist: View: Get Complete RLI Trend Analysis ➞ | |
 | PB Prosperity Bancshares, Inc. |
| Sector: Financials | |
| SubSector: Regional - Southwest Banks | |
| MarketCap: 4682.25 Millions | |
| Recent Price: 62.60 Smart Investing & Trading Score: 42 | |
| Day Percent Change: -1.49% Day Change: -0.95 | |
| Week Change: -1.49% Year-to-date Change: -7.6% | |
| PB Links: Profile News Message Board | |
| Charts:- Daily , Weekly | |
| Add PB to Watchlist: View: Get Complete PB Trend Analysis ➞ | |
 | GO Grocery Outlet Holding Corp. |
| Sector: Services & Goods | |
| SubSector: Grocery Stores | |
| MarketCap: 3065.95 Millions | |
| Recent Price: 25.78 Smart Investing & Trading Score: 44 | |
| Day Percent Change: -1.49% Day Change: -0.39 | |
| Week Change: -1.49% Year-to-date Change: -4.4% | |
| GO Links: Profile News Message Board | |
| Charts:- Daily , Weekly | |
| Add GO to Watchlist: View: Get Complete GO Trend Analysis ➞ | |
 | PEGA Pegasystems Inc. |
| Sector: Technology | |
| SubSector: Business Software & Services | |
| MarketCap: 5924.88 Millions | |
| Recent Price: 60.83 Smart Investing & Trading Score: 85 | |
| Day Percent Change: -1.57% Day Change: -0.97 | |
| Week Change: -1.57% Year-to-date Change: 24.5% | |
| PEGA Links: Profile News Message Board | |
| Charts:- Daily , Weekly | |
| Add PEGA to Watchlist: View: Get Complete PEGA Trend Analysis ➞ | |
 | W Wayfair Inc. |
| Sector: Services & Goods | |
| SubSector: Catalog & Mail Order Houses | |
| MarketCap: 3497.02 Millions | |
| Recent Price: 51.17 Smart Investing & Trading Score: 43 | |
| Day Percent Change: -1.62% Day Change: -0.84 | |
| Week Change: -1.62% Year-to-date Change: -17.1% | |
| W Links: Profile News Message Board | |
| Charts:- Daily , Weekly | |
| Add W to Watchlist: View: Get Complete W Trend Analysis ➞ | |
 | TRIP TripAdvisor, Inc. |
| Sector: Technology | |
| SubSector: Internet Information Providers | |
| MarketCap: 2633.9 Millions | |
| Recent Price: 27.00 Smart Investing & Trading Score: 90 | |
| Day Percent Change: -1.64% Day Change: -0.45 | |
| Week Change: -1.64% Year-to-date Change: 25.4% | |
| TRIP Links: Profile News Message Board | |
| Charts:- Daily , Weekly | |
| Add TRIP to Watchlist: View: Get Complete TRIP Trend Analysis ➞ | |
 | CFR Cullen/Frost Bankers, Inc. |
| Sector: Financials | |
| SubSector: Regional - Southwest Banks | |
| MarketCap: 3536.75 Millions | |
| Recent Price: 105.29 Smart Investing & Trading Score: 10 | |
| Day Percent Change: -1.67% Day Change: -1.79 | |
| Week Change: -1.67% Year-to-date Change: -3.0% | |
| CFR Links: Profile News Message Board | |
| Charts:- Daily , Weekly | |
| Add CFR to Watchlist: View: Get Complete CFR Trend Analysis ➞ | |
 | WST West Pharmaceutical Services, Inc. |
| Sector: Health Care | |
| SubSector: Medical Instruments & Supplies | |
| MarketCap: 9989 Millions | |
| Recent Price: 354.41 Smart Investing & Trading Score: 0 | |
| Day Percent Change: -1.67% Day Change: -6.02 | |
| Week Change: -1.67% Year-to-date Change: 0.7% | |
| WST Links: Profile News Message Board | |
| Charts:- Daily , Weekly | |
| Add WST to Watchlist: View: Get Complete WST Trend Analysis ➞ | |
 | TROW T. Rowe Price Group, Inc. |
| Sector: Financials | |
| SubSector: Asset Management | |
| MarketCap: 24530 Millions | |
| Recent Price: 112.08 Smart Investing & Trading Score: 61 | |
| Day Percent Change: -1.70% Day Change: -1.94 | |
| Week Change: -1.7% Year-to-date Change: 4.1% | |
| TROW Links: Profile News Message Board | |
| Charts:- Daily , Weekly | |
| Add TROW to Watchlist: View: Get Complete TROW Trend Analysis ➞ | |
 | AMBP Ardagh Metal Packaging S.A. |
| Sector: Services & Goods | |
| SubSector: Packaging & Containers | |
| MarketCap: 2170 Millions | |
| Recent Price: 3.98 Smart Investing & Trading Score: 88 | |
| Day Percent Change: -1.73% Day Change: -0.07 | |
| Week Change: -1.73% Year-to-date Change: 4.1% | |
| AMBP Links: Profile News Message Board | |
| Charts:- Daily , Weekly | |
| Add AMBP to Watchlist: View: Get Complete AMBP Trend Analysis ➞ | |
 | FHB First Hawaiian, Inc. |
| Sector: Financials | |
| SubSector: Regional - Pacific Banks | |
| MarketCap: 2398.99 Millions | |
| Recent Price: 21.51 Smart Investing & Trading Score: 55 | |
| Day Percent Change: -1.74% Day Change: -0.38 | |
| Week Change: -1.74% Year-to-date Change: -5.9% | |
| FHB Links: Profile News Message Board | |
| Charts:- Daily , Weekly | |
| Add FHB to Watchlist: View: Get Complete FHB Trend Analysis ➞ | |
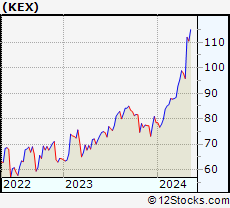 | KEX Kirby Corporation |
| Sector: Transports | |
| SubSector: Shipping | |
| MarketCap: 2533.34 Millions | |
| Recent Price: 109.99 Smart Investing & Trading Score: 88 | |
| Day Percent Change: -1.79% Day Change: -2.01 | |
| Week Change: -1.79% Year-to-date Change: 40.2% | |
| KEX Links: Profile News Message Board | |
| Charts:- Daily , Weekly | |
| Add KEX to Watchlist: View: Get Complete KEX Trend Analysis ➞ | |
 | DDOG Datadog, Inc. |
| Sector: Technology | |
| SubSector: Application Software | |
| MarketCap: 10653.2 Millions | |
| Recent Price: 129.07 Smart Investing & Trading Score: 90 | |
| Day Percent Change: -1.81% Day Change: -2.38 | |
| Week Change: -1.81% Year-to-date Change: 6.3% | |
| DDOG Links: Profile News Message Board | |
| Charts:- Daily , Weekly | |
| Add DDOG to Watchlist: View: Get Complete DDOG Trend Analysis ➞ | |
| For tabular summary view of above stock list: Summary View ➞ 0 - 25 , 25 - 50 , 50 - 75 , 75 - 100 , 100 - 125 , 125 - 150 , 150 - 175 , 175 - 200 , 200 - 225 , 225 - 250 , 250 - 275 , 275 - 300 , 300 - 325 , 325 - 350 , 350 - 375 , 375 - 400 , 400 - 425 , 425 - 450 , 450 - 475 , 475 - 500 , 500 - 525 , 525 - 550 , 550 - 575 , 575 - 600 , 600 - 625 , 625 - 650 , 650 - 675 , 675 - 700 , 700 - 725 , 725 - 750 , 750 - 775 | ||
| Click To Change The Sort Order: By Market Cap or Company Size Performance: Year-to-date, Week and Day | |
| Select Chart Type: | ||
|
Best Stocks Today 12Stocks.com |
© 2024 12Stocks.com Terms & Conditions Privacy Contact Us
All Information Provided Only For Education And Not To Be Used For Investing or Trading. See Terms & Conditions


One More Thing ... Get Best Stocks Delivered Daily!
Never Ever Miss A Move With Our Top Ten Stocks Lists
Find Best Stocks In Any Market - Bull or Bear Market
Take A Peek At Our Top Ten Stocks Lists: Daily, Weekly, Year-to-Date & Top Trends
Find Best Stocks In Any Market - Bull or Bear Market
Take A Peek At Our Top Ten Stocks Lists: Daily, Weekly, Year-to-Date & Top Trends
Midcap Stocks With Best Up Trends [0-bearish to 100-bullish]: Albemarle [100], Domino s[100], Tandem Diabetes[100], Quest Diagnostics[100], AES [100], Carrier Global[100], Teradyne [100], DaVita [100], Skyworks Solutions[100], LPL Financial[100], Perrigo [100]
Best Midcap Stocks Year-to-Date:
Vistra Energy[102.39%], AppLovin [83.42%], ShockWave Medical[72.92%], EMCOR [68.8%], CAVA [62.35%], Constellation Energy[61.05%], Spotify [53.34%], Antero Resources[51.23%], Natera [50.13%], Wingstop [49.98%], Pure Storage[47.03%] Best Midcap Stocks This Week:
Ginkgo Bioworks[15.08%], Hertz Global[7.92%], Albemarle [7.57%], Vistra Energy[7.24%], Medical Properties[5.99%], Domino s[5.62%], Liberty SiriusXM[5.49%], Liberty SiriusXM[5.27%], Tandem Diabetes[5.19%], Sirius XM[4.97%], Peloton Interactive[4.43%] Best Midcap Stocks Daily:
Ginkgo Bioworks[15.08%], Hertz Global[7.92%], Albemarle [7.57%], Vistra Energy[7.24%], Medical Properties[5.99%], Domino s[5.62%], Liberty SiriusXM[5.49%], Liberty SiriusXM[5.27%], Tandem Diabetes[5.19%], Sirius XM[4.97%], Peloton Interactive[4.43%]