
 Login Sign Up


| |||||
 |  | ||||

| 12Stocks.com Market Intelligence |
Best MidCap Stocks
|
| In a hurry? Mid Cap Stocks Lists: Performance Trends Table, Stock Charts
Sort midcap stocks: Daily, Weekly, Year-to-Date, Market Cap & Trends. Filter midcap stocks list by sector: Show all, Tech, Finance, Energy, Staples, Retail, Industrial, Materials, Utilities and HealthCare Filter midcap stocks list by size:All MidCap Large Mid-Range Small |
| 12Stocks.com Mid Cap Stocks Performances & Trends Daily | |||||||||
|
|  The overall Smart Investing & Trading Score is 56 (0-bearish to 100-bullish) which puts Mid Cap index in short term neutral trend. The Smart Investing & Trading Score from previous trading session is 49 and hence an improvement of trend.
| ||||||||
Here are the Smart Investing & Trading Scores of the most requested mid cap stocks at 12Stocks.com (click stock name for detailed review):
|


| 12Stocks.com: Top Performing Mid Cap Index Stocks | ||||||||||||||||||||||||||||||||||||||||||||||||
 The top performing Mid Cap Index stocks year to date are
Now, more recently, over last week, the top performing Mid Cap Index stocks on the move are


|
||||||||||||||||||||||||||||||||||||||||||||||||
| 12Stocks.com: Investing in Midcap Index with Stocks | |
|
The following table helps investors and traders sort through current performance and trends (as measured by Smart Investing & Trading Score) of various
stocks in the Midcap Index. Quick View: Move mouse or cursor over stock symbol (ticker) to view short-term technical chart and over stock name to view long term chart. Click on  to add stock symbol to your watchlist and to add stock symbol to your watchlist and  to view watchlist. Click on any ticker or stock name for detailed market intelligence report for that stock. to view watchlist. Click on any ticker or stock name for detailed market intelligence report for that stock. |
12Stocks.com Performance of Stocks in Midcap Index
| Ticker | Stock Name | Watchlist | Category | Recent Price | Smart Investing & Trading Score | Change % | Weekly Change% |
| FCNCA | First Citizens |   | Financials | 1754.50 | 100 | -2.55% | 11.94% |
| ESTC | Elastic N.V | | Technology | 107.43 | 64 | 2.52% | 11.69% |
| TRU | TransUnion | | Services & Goods | 74.49 | 52 | 0.27% | 11.68% |
| WSO | Watsco | | Services & Goods | 443.21 | 85 | -0.18% | 11.66% |
| MKSI | MKS Instruments | | Technology | 120.75 | 63 | 3.85% | 11.63% |
| CR | Crane Co | | Industrials | 144.35 | 100 | 0.26% | 11.48% |
| SRPT | Sarepta | | Health Care | 128.77 | 75 | 1.08% | 11.37% |
| QRVO | Qorvo | | Technology | 116.75 | 85 | 1.79% | 11.32% |
| LSCC | Lattice Semiconductor | | Technology | 73.88 | 68 | -0.04% | 11.08% |
| SOFI | SoFi Technologies | | Financials | 7.89 | 77 | 3.95% | 10.97% |
| ZBRA | Zebra Technologies | | Technology | 297.21 | 100 | 1.60% | 10.87% |
| EQT | EQT | | Energy | 40.61 | 100 | 0.49% | 10.80% |
| VST | Vistra Energy | | Utilities | 72.70 | 60 | 0.30% | 10.72% |
| CFLT | Confluent | | Technology | 29.76 | 85 | 3.01% | 10.67% |
| TOST | Toast | | Technology | 23.91 | 83 | 3.42% | 10.59% |
| APP | AppLovin | | Technology | 73.82 | 68 | 6.66% | 10.51% |
| AN | AutoNation | | Services & Goods | 169.88 | 100 | 5.92% | 10.21% |
| WING | Wingstop | | Services & Goods | 382.56 | 85 | 3.42% | 10.13% |
| CSGP | CoStar | | Financials | 92.65 | 80 | 2.56% | 9.96% |
| URI | United Rentals | | Transports | 690.80 | 80 | -0.02% | 9.94% |
| TRIP | TripAdvisor | | Technology | 27.45 | 90 | 4.61% | 9.62% |
| CACI | CACI | | Technology | 404.87 | 95 | 0.75% | 9.61% |
| TTD | Trade Desk | | Technology | 84.73 | 63 | 1.67% | 9.61% |
| DDOG | Datadog | | Technology | 131.45 | 80 | 4.98% | 9.45% |
| APH | Amphenol | | Technology | 120.49 | 100 | 1.24% | 9.37% |
| For chart view version of above stock list: Chart View ➞ 0 - 25 , 25 - 50 , 50 - 75 , 75 - 100 , 100 - 125 , 125 - 150 , 150 - 175 , 175 - 200 , 200 - 225 , 225 - 250 , 250 - 275 , 275 - 300 , 300 - 325 , 325 - 350 , 350 - 375 , 375 - 400 , 400 - 425 , 425 - 450 , 450 - 475 , 475 - 500 , 500 - 525 , 525 - 550 , 550 - 575 , 575 - 600 , 600 - 625 , 625 - 650 , 650 - 675 , 675 - 700 , 700 - 725 , 725 - 750 , 750 - 775 | ||
 | Click To Change The Sort Order: By Market Cap or Company Size Performance: Year-to-date, Week and Day |  |
|
Get the most comprehensive stock market coverage daily at 12Stocks.com ➞ Best Stocks Today ➞ Best Stocks Weekly ➞ Best Stocks Year-to-Date ➞ Best Stocks Trends ➞  Best Stocks Today 12Stocks.com Best Nasdaq Stocks ➞ Best S&P 500 Stocks ➞ Best Tech Stocks ➞ Best Biotech Stocks ➞ |
| Detailed Overview of Midcap Stocks |
| Midcap Technical Overview, Leaders & Laggards, Top Midcap ETF Funds & Detailed Midcap Stocks List, Charts, Trends & More |
| Midcap: Technical Analysis, Trends & YTD Performance | |
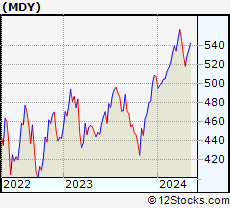
| MidCap segment as represented by
MDY, an exchange-traded fund [ETF], holds basket of about four hundred midcap stocks from across all major sectors of the US stock market. The midcap index (contains stocks like Green Mountain Coffee Roasters and Tractor Supply Company) is up by 4.34% and is currently underperforming the overall market by -1.8% year-to-date. Below is a quick view of technical charts and trends: | |
 MDY Weekly Chart |
|
| Long Term Trend: Very Good | |
| Medium Term Trend: Not Good | |
 MDY Daily Chart |
|
| Short Term Trend: Very Good | |
| Overall Trend Score: 56 | |
| YTD Performance: 4.34% | |
| **Trend Scores & Views Are Only For Educational Purposes And Not For Investing | |
| 12Stocks.com: Investing in Midcap Index using Exchange Traded Funds | |
|
The following table shows list of key exchange traded funds (ETF) that
help investors track Midcap index. The following list also includes leveraged ETF funds that track twice or thrice the daily returns of Midcap indices. Short or inverse ETF funds move in the opposite direction to the index they track and are useful during market pullbacks or during bear markets. Quick View: Move mouse or cursor over ETF symbol (ticker) to view short-term technical chart and over ETF name to view long term chart. Click on ticker or stock name for detailed view. Click on to add stock symbol to your watchlist and to view watchlist. |
12Stocks.com List of ETFs that track Midcap Index
| Ticker | ETF Name | Watchlist | Recent Price | Smart Investing & Trading Score | Change % | Week % | Year-to-date % |
| IJH | iShares Core S&P Mid-Cap | | 57.82 | 68 | 0.24 | 2.19 | 4.31% |
| IWR | iShares Russell Mid-Cap | | 80.52 | 63 | 0.31 | 2.36 | 3.59% |
| MDY | SPDR S&P MidCap 400 ETF | | 529.38 | 56 | 0.29 | 2.14 | 4.34% |
| IWP | iShares Russell Mid-Cap Growth | | 108.98 | 58 | 0.48 | 3.1 | 4.33% |
| IWS | iShares Russell Mid-Cap Value | | 119.99 | 68 | 0.17 | 1.99 | 3.18% |
| IJK | iShares S&P Mid-Cap 400 Growth | | 87.00 | 63 | 0.30 | 2.53 | 9.82% |
| IJJ | iShares S&P Mid-Cap 400 Value | | 112.23 | 58 | 0.25 | 1.52 | -1.59% |
| XMLV | PowerShares S&P MidCap Low Volatil ETF | | 54.65 | 75 | -0.16 | 0.9 | 2.76% |
| SMDD | ProShares UltraPro Short MidCap400 | | 11.83 | 47 | -0.50 | -5.83 | -12.13% |
| UMDD | ProShares UltraPro MidCap400 | | 23.96 | 63 | 1.01 | 6.19 | 7.35% |
| MYY | ProShares Short MidCap400 | | 20.79 | 40 | -0.86 | -1.88 | -3.1% |
| MZZ | ProShares UltraShort MidCap400 | | 11.68 | 27 | -0.60 | -4.03 | -7.09% |
| MVV | ProShares Ultra MidCap400 | | 61.43 | 48 | 0.66 | 4.12 | 6.12% |
| 12Stocks.com: Charts, Trends, Fundamental Data and Performances of MidCap Stocks | |
|
We now take in-depth look at all MidCap stocks including charts, multi-period performances and overall trends (as measured by Smart Investing & Trading Score). One can sort MidCap stocks (click link to choose) by Daily, Weekly and by Year-to-Date performances. Also, one can sort by size of the company or by market capitalization. |
| Select Your Default Chart Type: | |||||
| |||||
| Click on stock symbol or name for detailed view. Click on to add stock symbol to your watchlist and to view watchlist. Quick View: Move mouse or cursor over "Daily" to quickly view daily technical stock chart and over "Weekly" to view weekly technical stock chart. | |||||

 | FCNCA First Citizens BancShares, Inc. |
| Sector: Financials | |
| SubSector: Regional - Mid-Atlantic Banks | |
| MarketCap: 3157.19 Millions | |
| Recent Price: 1754.50 Smart Investing & Trading Score: 100 | |
| Day Percent Change: -2.55% Day Change: -45.85 | |
| Week Change: 11.94% Year-to-date Change: 23.7% | |
| FCNCA Links: Profile News Message Board | |
| Charts:- Daily , Weekly | |
| Add FCNCA to Watchlist: View: Get Complete FCNCA Trend Analysis ➞ | |
 | ESTC Elastic N.V. |
| Sector: Technology | |
| SubSector: Application Software | |
| MarketCap: 4420.92 Millions | |
| Recent Price: 107.43 Smart Investing & Trading Score: 64 | |
| Day Percent Change: 2.52% Day Change: 2.64 | |
| Week Change: 11.69% Year-to-date Change: -4.7% | |
| ESTC Links: Profile News Message Board | |
| Charts:- Daily , Weekly | |
| Add ESTC to Watchlist: View: Get Complete ESTC Trend Analysis ➞ | |
 | TRU TransUnion |
| Sector: Services & Goods | |
| SubSector: Business Services | |
| MarketCap: 11457.2 Millions | |
| Recent Price: 74.49 Smart Investing & Trading Score: 52 | |
| Day Percent Change: 0.27% Day Change: 0.20 | |
| Week Change: 11.68% Year-to-date Change: 8.4% | |
| TRU Links: Profile News Message Board | |
| Charts:- Daily , Weekly | |
| Add TRU to Watchlist: View: Get Complete TRU Trend Analysis ➞ | |
 | WSO Watsco, Inc. |
| Sector: Services & Goods | |
| SubSector: Electronics Wholesale | |
| MarketCap: 6000.33 Millions | |
| Recent Price: 443.21 Smart Investing & Trading Score: 85 | |
| Day Percent Change: -0.18% Day Change: -0.79 | |
| Week Change: 11.66% Year-to-date Change: 3.4% | |
| WSO Links: Profile News Message Board | |
| Charts:- Daily , Weekly | |
| Add WSO to Watchlist: View: Get Complete WSO Trend Analysis ➞ | |
 | MKSI MKS Instruments, Inc. |
| Sector: Technology | |
| SubSector: Scientific & Technical Instruments | |
| MarketCap: 4502.93 Millions | |
| Recent Price: 120.75 Smart Investing & Trading Score: 63 | |
| Day Percent Change: 3.85% Day Change: 4.48 | |
| Week Change: 11.63% Year-to-date Change: 17.4% | |
| MKSI Links: Profile News Message Board | |
| Charts:- Daily , Weekly | |
| Add MKSI to Watchlist: View: Get Complete MKSI Trend Analysis ➞ | |
 | CR Crane Co. |
| Sector: Industrials | |
| SubSector: Diversified Machinery | |
| MarketCap: 2715.16 Millions | |
| Recent Price: 144.35 Smart Investing & Trading Score: 100 | |
| Day Percent Change: 0.26% Day Change: 0.37 | |
| Week Change: 11.48% Year-to-date Change: 22.2% | |
| CR Links: Profile News Message Board | |
| Charts:- Daily , Weekly | |
| Add CR to Watchlist: View: Get Complete CR Trend Analysis ➞ | |
 | SRPT Sarepta Therapeutics, Inc. |
| Sector: Health Care | |
| SubSector: Biotechnology | |
| MarketCap: 7388.05 Millions | |
| Recent Price: 128.77 Smart Investing & Trading Score: 75 | |
| Day Percent Change: 1.08% Day Change: 1.38 | |
| Week Change: 11.37% Year-to-date Change: 33.5% | |
| SRPT Links: Profile News Message Board | |
| Charts:- Daily , Weekly | |
| Add SRPT to Watchlist: View: Get Complete SRPT Trend Analysis ➞ | |
 | QRVO Qorvo, Inc. |
| Sector: Technology | |
| SubSector: Semiconductor - Broad Line | |
| MarketCap: 9524.32 Millions | |
| Recent Price: 116.75 Smart Investing & Trading Score: 85 | |
| Day Percent Change: 1.79% Day Change: 2.05 | |
| Week Change: 11.32% Year-to-date Change: 3.7% | |
| QRVO Links: Profile News Message Board | |
| Charts:- Daily , Weekly | |
| Add QRVO to Watchlist: View: Get Complete QRVO Trend Analysis ➞ | |
 | LSCC Lattice Semiconductor Corporation |
| Sector: Technology | |
| SubSector: Semiconductor - Specialized | |
| MarketCap: 2104 Millions | |
| Recent Price: 73.88 Smart Investing & Trading Score: 68 | |
| Day Percent Change: -0.04% Day Change: -0.03 | |
| Week Change: 11.08% Year-to-date Change: 7.1% | |
| LSCC Links: Profile News Message Board | |
| Charts:- Daily , Weekly | |
| Add LSCC to Watchlist: View: Get Complete LSCC Trend Analysis ➞ | |
 | SOFI SoFi Technologies, Inc. |
| Sector: Financials | |
| SubSector: Credit Services | |
| MarketCap: 7990 Millions | |
| Recent Price: 7.89 Smart Investing & Trading Score: 77 | |
| Day Percent Change: 3.95% Day Change: 0.30 | |
| Week Change: 10.97% Year-to-date Change: -19.9% | |
| SOFI Links: Profile News Message Board | |
| Charts:- Daily , Weekly | |
| Add SOFI to Watchlist: View: Get Complete SOFI Trend Analysis ➞ | |
 | ZBRA Zebra Technologies Corporation |
| Sector: Technology | |
| SubSector: Communication Equipment | |
| MarketCap: 11474.9 Millions | |
| Recent Price: 297.21 Smart Investing & Trading Score: 100 | |
| Day Percent Change: 1.60% Day Change: 4.68 | |
| Week Change: 10.87% Year-to-date Change: 8.7% | |
| ZBRA Links: Profile News Message Board | |
| Charts:- Daily , Weekly | |
| Add ZBRA to Watchlist: View: Get Complete ZBRA Trend Analysis ➞ | |
 | EQT EQT Corporation |
| Sector: Energy | |
| SubSector: Independent Oil & Gas | |
| MarketCap: 1886.63 Millions | |
| Recent Price: 40.61 Smart Investing & Trading Score: 100 | |
| Day Percent Change: 0.49% Day Change: 0.20 | |
| Week Change: 10.8% Year-to-date Change: 5.0% | |
| EQT Links: Profile News Message Board | |
| Charts:- Daily , Weekly | |
| Add EQT to Watchlist: View: Get Complete EQT Trend Analysis ➞ | |
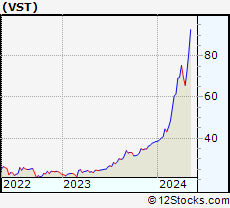 | VST Vistra Energy Corp. |
| Sector: Utilities | |
| SubSector: Electric Utilities | |
| MarketCap: 8396.44 Millions | |
| Recent Price: 72.70 Smart Investing & Trading Score: 60 | |
| Day Percent Change: 0.30% Day Change: 0.22 | |
| Week Change: 10.72% Year-to-date Change: 88.7% | |
| VST Links: Profile News Message Board | |
| Charts:- Daily , Weekly | |
| Add VST to Watchlist: View: Get Complete VST Trend Analysis ➞ | |
 | CFLT Confluent, Inc. |
| Sector: Technology | |
| SubSector: Software - Infrastructure | |
| MarketCap: 10820 Millions | |
| Recent Price: 29.76 Smart Investing & Trading Score: 85 | |
| Day Percent Change: 3.01% Day Change: 0.87 | |
| Week Change: 10.67% Year-to-date Change: 25.4% | |
| CFLT Links: Profile News Message Board | |
| Charts:- Daily , Weekly | |
| Add CFLT to Watchlist: View: Get Complete CFLT Trend Analysis ➞ | |
 | TOST Toast, Inc. |
| Sector: Technology | |
| SubSector: Software - Infrastructure | |
| MarketCap: 11680 Millions | |
| Recent Price: 23.91 Smart Investing & Trading Score: 83 | |
| Day Percent Change: 3.42% Day Change: 0.79 | |
| Week Change: 10.59% Year-to-date Change: 30.6% | |
| TOST Links: Profile News Message Board | |
| Charts:- Daily , Weekly | |
| Add TOST to Watchlist: View: Get Complete TOST Trend Analysis ➞ | |
 | APP AppLovin Corporation |
| Sector: Technology | |
| SubSector: Software - Application | |
| MarketCap: 9000 Millions | |
| Recent Price: 73.82 Smart Investing & Trading Score: 68 | |
| Day Percent Change: 6.66% Day Change: 4.61 | |
| Week Change: 10.51% Year-to-date Change: 85.5% | |
| APP Links: Profile News Message Board | |
| Charts:- Daily , Weekly | |
| Add APP to Watchlist: View: Get Complete APP Trend Analysis ➞ | |
 | AN AutoNation, Inc. |
| Sector: Services & Goods | |
| SubSector: Auto Dealerships | |
| MarketCap: 2732.61 Millions | |
| Recent Price: 169.88 Smart Investing & Trading Score: 100 | |
| Day Percent Change: 5.92% Day Change: 9.50 | |
| Week Change: 10.21% Year-to-date Change: 13.1% | |
| AN Links: Profile News Message Board | |
| Charts:- Daily , Weekly | |
| Add AN to Watchlist: View: Get Complete AN Trend Analysis ➞ | |
 | WING Wingstop Inc. |
| Sector: Services & Goods | |
| SubSector: Restaurants | |
| MarketCap: 1744.7 Millions | |
| Recent Price: 382.56 Smart Investing & Trading Score: 85 | |
| Day Percent Change: 3.42% Day Change: 12.66 | |
| Week Change: 10.13% Year-to-date Change: 49.1% | |
| WING Links: Profile News Message Board | |
| Charts:- Daily , Weekly | |
| Add WING to Watchlist: View: Get Complete WING Trend Analysis ➞ | |
 | CSGP CoStar Group, Inc. |
| Sector: Financials | |
| SubSector: Property Management | |
| MarketCap: 21454.4 Millions | |
| Recent Price: 92.65 Smart Investing & Trading Score: 80 | |
| Day Percent Change: 2.56% Day Change: 2.31 | |
| Week Change: 9.96% Year-to-date Change: 6.0% | |
| CSGP Links: Profile News Message Board | |
| Charts:- Daily , Weekly | |
| Add CSGP to Watchlist: View: Get Complete CSGP Trend Analysis ➞ | |
 | URI United Rentals, Inc. |
| Sector: Transports | |
| SubSector: Rental & Leasing Services | |
| MarketCap: 6246.64 Millions | |
| Recent Price: 690.80 Smart Investing & Trading Score: 80 | |
| Day Percent Change: -0.02% Day Change: -0.12 | |
| Week Change: 9.94% Year-to-date Change: 20.5% | |
| URI Links: Profile News Message Board | |
| Charts:- Daily , Weekly | |
| Add URI to Watchlist: View: Get Complete URI Trend Analysis ➞ | |
 | TRIP TripAdvisor, Inc. |
| Sector: Technology | |
| SubSector: Internet Information Providers | |
| MarketCap: 2633.9 Millions | |
| Recent Price: 27.45 Smart Investing & Trading Score: 90 | |
| Day Percent Change: 4.61% Day Change: 1.21 | |
| Week Change: 9.62% Year-to-date Change: 27.5% | |
| TRIP Links: Profile News Message Board | |
| Charts:- Daily , Weekly | |
| Add TRIP to Watchlist: View: Get Complete TRIP Trend Analysis ➞ | |
 | CACI CACI International Inc |
| Sector: Technology | |
| SubSector: Information Technology Services | |
| MarketCap: 5211.58 Millions | |
| Recent Price: 404.87 Smart Investing & Trading Score: 95 | |
| Day Percent Change: 0.75% Day Change: 3.00 | |
| Week Change: 9.61% Year-to-date Change: 25.0% | |
| CACI Links: Profile News Message Board | |
| Charts:- Daily , Weekly | |
| Add CACI to Watchlist: View: Get Complete CACI Trend Analysis ➞ | |
 | TTD The Trade Desk, Inc. |
| Sector: Technology | |
| SubSector: Application Software | |
| MarketCap: 9006.92 Millions | |
| Recent Price: 84.73 Smart Investing & Trading Score: 63 | |
| Day Percent Change: 1.67% Day Change: 1.39 | |
| Week Change: 9.61% Year-to-date Change: 17.8% | |
| TTD Links: Profile News Message Board | |
| Charts:- Daily , Weekly | |
| Add TTD to Watchlist: View: Get Complete TTD Trend Analysis ➞ | |
 | DDOG Datadog, Inc. |
| Sector: Technology | |
| SubSector: Application Software | |
| MarketCap: 10653.2 Millions | |
| Recent Price: 131.45 Smart Investing & Trading Score: 80 | |
| Day Percent Change: 4.98% Day Change: 6.24 | |
| Week Change: 9.45% Year-to-date Change: 8.3% | |
| DDOG Links: Profile News Message Board | |
| Charts:- Daily , Weekly | |
| Add DDOG to Watchlist: View: Get Complete DDOG Trend Analysis ➞ | |
 | APH Amphenol Corporation |
| Sector: Technology | |
| SubSector: Diversified Electronics | |
| MarketCap: 23422 Millions | |
| Recent Price: 120.49 Smart Investing & Trading Score: 100 | |
| Day Percent Change: 1.24% Day Change: 1.48 | |
| Week Change: 9.37% Year-to-date Change: 21.6% | |
| APH Links: Profile News Message Board | |
| Charts:- Daily , Weekly | |
| Add APH to Watchlist: View: Get Complete APH Trend Analysis ➞ | |
| For tabular summary view of above stock list: Summary View ➞ 0 - 25 , 25 - 50 , 50 - 75 , 75 - 100 , 100 - 125 , 125 - 150 , 150 - 175 , 175 - 200 , 200 - 225 , 225 - 250 , 250 - 275 , 275 - 300 , 300 - 325 , 325 - 350 , 350 - 375 , 375 - 400 , 400 - 425 , 425 - 450 , 450 - 475 , 475 - 500 , 500 - 525 , 525 - 550 , 550 - 575 , 575 - 600 , 600 - 625 , 625 - 650 , 650 - 675 , 675 - 700 , 700 - 725 , 725 - 750 , 750 - 775 | ||
| Click To Change The Sort Order: By Market Cap or Company Size Performance: Year-to-date, Week and Day | |
| Select Chart Type: | ||
|
Best Stocks Today 12Stocks.com |
© 2024 12Stocks.com Terms & Conditions Privacy Contact Us
All Information Provided Only For Education And Not To Be Used For Investing or Trading. See Terms & Conditions


One More Thing ... Get Best Stocks Delivered Daily!
Never Ever Miss A Move With Our Top Ten Stocks Lists
Find Best Stocks In Any Market - Bull or Bear Market
Take A Peek At Our Top Ten Stocks Lists: Daily, Weekly, Year-to-Date & Top Trends
Find Best Stocks In Any Market - Bull or Bear Market
Take A Peek At Our Top Ten Stocks Lists: Daily, Weekly, Year-to-Date & Top Trends
Midcap Stocks With Best Up Trends [0-bearish to 100-bullish]: ResMed [100], CAVA [100], ZoomInfo Technologies[100], AutoNation [100], Teradyne [100], Allegro Micro[100], Tractor Supply[100], Carrier Global[100], American Homes[100], Zebra Technologies[100], Mid-America Apartment[100]
Best Midcap Stocks Year-to-Date:
Vistra Energy[88.73%], AppLovin [85.5%], ShockWave Medical[73.17%], EMCOR [64.33%], Constellation Energy[60.86%], CAVA [59.06%], Spotify [54.11%], Wingstop [49.1%], Antero Resources[49.03%], Pure Storage[48.49%], Natera [46.33%] Best Midcap Stocks This Week:
HashiCorp [36.05%], ResMed [21.92%], Teradyne [18.92%], MongoDB [17.26%], Kirby [16.9%], Hasbro [16.65%], Ardagh Metal[16.05%], Skechers U.S.A[15.95%], CAVA [15.9%], Tandem Diabetes[15.81%], Antero Resources[15.4%] Best Midcap Stocks Daily:
ResMed [18.89%], Newell [12.25%], Skechers U.S.A[11.20%], Ginkgo Bioworks[10.60%], CAVA [10.50%], QuantumScape [8.56%], AppLovin [6.66%], GameStop [6.16%], ZoomInfo Technologies[6.06%], Rivian Automotive[6.04%], Sunrun [5.97%]