
 Login Sign Up


| |||||
 |  | ||||

| 12Stocks.com Market Intelligence |
Best MidCap Stocks
|
| In a hurry? Mid Cap Stocks Lists: Performance Trends Table, Stock Charts
Sort midcap stocks: Daily, Weekly, Year-to-Date, Market Cap & Trends. Filter midcap stocks list by sector: Show all, Tech, Finance, Energy, Staples, Retail, Industrial, Materials, Utilities and HealthCare Filter midcap stocks list by size:All MidCap Large Mid-Range Small |
| 12Stocks.com Mid Cap Stocks Performances & Trends Daily | |||||||||
|
|  The overall Smart Investing & Trading Score is 49 (0-bearish to 100-bullish) which puts Mid Cap index in short term neutral trend. The Smart Investing & Trading Score from previous trading session is 63 and hence a deterioration of trend.
| ||||||||
Here are the Smart Investing & Trading Scores of the most requested mid cap stocks at 12Stocks.com (click stock name for detailed review):
|


| 12Stocks.com: Top Performing Mid Cap Index Stocks | ||||||||||||||||||||||||||||||||||||||||||||||||
 The top performing Mid Cap Index stocks year to date are
Now, more recently, over last week, the top performing Mid Cap Index stocks on the move are


|
||||||||||||||||||||||||||||||||||||||||||||||||
| 12Stocks.com: Investing in Midcap Index with Stocks | |
|
The following table helps investors and traders sort through current performance and trends (as measured by Smart Investing & Trading Score) of various
stocks in the Midcap Index. Quick View: Move mouse or cursor over stock symbol (ticker) to view short-term technical chart and over stock name to view long term chart. Click on  to add stock symbol to your watchlist and to add stock symbol to your watchlist and  to view watchlist. Click on any ticker or stock name for detailed market intelligence report for that stock. to view watchlist. Click on any ticker or stock name for detailed market intelligence report for that stock. |
12Stocks.com Performance of Stocks in Midcap Index
| Ticker | Stock Name | Watchlist | Category | Recent Price | Smart Investing & Trading Score | Change % | Weekly Change% |
| CPB | Campbell Soup |   | Consumer Staples | 45.37 | 88 | -0.37% | 2.65% |
| AVY | Avery Dennison | | Consumer Staples | 217.16 | 78 | 2.23% | 2.64% |
| DT | Dynatrace | | Technology | 46.60 | 57 | -0.30% | 2.64% |
| ADC | Agree Realty | | Financials | 58.05 | 74 | -0.55% | 2.63% |
| HLI | Houlihan Lokey | | Financials | 127.03 | 73 | -0.76% | 2.63% |
| ZM | Zoom Video | | Technology | 61.02 | 20 | -1.02% | 2.62% |
| LAZ | Lazard | | Financials | 38.89 | 30 | -1.04% | 2.59% |
| ROK | Rockwell Automation | | Industrials | 276.95 | 61 | 0.50% | 2.59% |
| NNN | National Retail | | Financials | 41.03 | 85 | -0.27% | 2.58% |
| IQV | IQVIA | | Health Care | 233.98 | 53 | -2.85% | 2.58% |
| VMC | Vulcan Materials | | Industrials | 258.54 | 51 | 0.83% | 2.57% |
| RMD | ResMed | | Health Care | 183.42 | 35 | -0.20% | 2.56% |
| AWK | American Water | | Utilities | 121.55 | 74 | 0.16% | 2.56% |
| ED | Consolidated Edison | | Utilities | 94.11 | 100 | 0.73% | 2.55% |
| FFIV | F5 Networks | | Technology | 181.85 | 45 | -0.27% | 2.55% |
| PNFP | Pinnacle Financial | | Financials | 81.53 | 69 | -1.72% | 2.55% |
| PEGA | Pega | | Technology | 59.08 | 51 | 0.34% | 2.55% |
| NLY | Annaly Capital | | Financials | 18.69 | 39 | 0.59% | 2.52% |
| GRMN | Garmin | | Technology | 143.03 | 56 | 0.17% | 2.52% |
| ALB | Albemarle | | Materials | 114.98 | 48 | -0.25% | 2.52% |
| CBRE | CBRE | | Financials | 87.02 | 36 | 0.29% | 2.50% |
| PLTK | Playtika Holding | | Services & Goods | 7.05 | 69 | 0.50% | 2.47% |
| MTB | M&T Bank | | Financials | 146.90 | 95 | -0.72% | 2.46% |
| POOL | Pool | | Consumer Staples | 370.00 | 51 | -1.96% | 2.46% |
| CROX | Crocs | | Consumer Staples | 123.51 | 68 | -1.80% | 2.46% |
| For chart view version of above stock list: Chart View ➞ 0 - 25 , 25 - 50 , 50 - 75 , 75 - 100 , 100 - 125 , 125 - 150 , 150 - 175 , 175 - 200 , 200 - 225 , 225 - 250 , 250 - 275 , 275 - 300 , 300 - 325 , 325 - 350 , 350 - 375 , 375 - 400 , 400 - 425 , 425 - 450 , 450 - 475 , 475 - 500 , 500 - 525 , 525 - 550 , 550 - 575 , 575 - 600 , 600 - 625 , 625 - 650 , 650 - 675 , 675 - 700 , 700 - 725 , 725 - 750 , 750 - 775 | ||
 | Click To Change The Sort Order: By Market Cap or Company Size Performance: Year-to-date, Week and Day |  |
|
Get the most comprehensive stock market coverage daily at 12Stocks.com ➞ Best Stocks Today ➞ Best Stocks Weekly ➞ Best Stocks Year-to-Date ➞ Best Stocks Trends ➞  Best Stocks Today 12Stocks.com Best Nasdaq Stocks ➞ Best S&P 500 Stocks ➞ Best Tech Stocks ➞ Best Biotech Stocks ➞ |
| Detailed Overview of Midcap Stocks |
| Midcap Technical Overview, Leaders & Laggards, Top Midcap ETF Funds & Detailed Midcap Stocks List, Charts, Trends & More |
| Midcap: Technical Analysis, Trends & YTD Performance | |
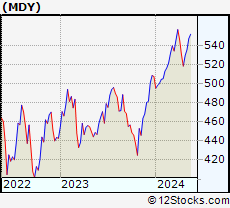
| MidCap segment as represented by
MDY, an exchange-traded fund [ETF], holds basket of about four hundred midcap stocks from across all major sectors of the US stock market. The midcap index (contains stocks like Green Mountain Coffee Roasters and Tractor Supply Company) is up by 4.04% and is currently underperforming the overall market by -1.12% year-to-date. Below is a quick view of technical charts and trends: | |
 MDY Weekly Chart |
|
| Long Term Trend: Good | |
| Medium Term Trend: Not Good | |
 MDY Daily Chart |
|
| Short Term Trend: Very Good | |
| Overall Trend Score: 49 | |
| YTD Performance: 4.04% | |
| **Trend Scores & Views Are Only For Educational Purposes And Not For Investing | |
| 12Stocks.com: Investing in Midcap Index using Exchange Traded Funds | |
|
The following table shows list of key exchange traded funds (ETF) that
help investors track Midcap index. The following list also includes leveraged ETF funds that track twice or thrice the daily returns of Midcap indices. Short or inverse ETF funds move in the opposite direction to the index they track and are useful during market pullbacks or during bear markets. Quick View: Move mouse or cursor over ETF symbol (ticker) to view short-term technical chart and over ETF name to view long term chart. Click on ticker or stock name for detailed view. Click on to add stock symbol to your watchlist and to view watchlist. |
12Stocks.com List of ETFs that track Midcap Index
| Ticker | ETF Name | Watchlist | Recent Price | Smart Investing & Trading Score | Change % | Week % | Year-to-date % |
| IJH | iShares Core S&P Mid-Cap | | 57.68 | 61 | -0.33 | 1.94 | 4.06% |
| IWP | iShares Russell Mid-Cap Growth | | 108.46 | 51 | -0.03 | 2.61 | 3.83% |
| IWR | iShares Russell Mid-Cap | | 80.27 | 56 | -0.17 | 2.05 | 3.27% |
| MDY | SPDR S&P MidCap 400 ETF | | 527.86 | 49 | -0.37 | 1.85 | 4.04% |
| IWS | iShares Russell Mid-Cap Value | | 119.79 | 61 | -0.15 | 1.82 | 3.01% |
| IJK | iShares S&P Mid-Cap 400 Growth | | 86.74 | 56 | -0.29 | 2.23 | 9.49% |
| IJJ | iShares S&P Mid-Cap 400 Value | | 111.95 | 51 | -0.57 | 1.27 | -1.83% |
| XMLV | PowerShares S&P MidCap Low Volatil ETF | | 54.74 | 68 | -0.55 | 1.07 | 2.93% |
| SMDD | ProShares UltraPro Short MidCap400 | | 11.89 | 39 | 0.46 | -5.36 | -11.69% |
| UMDD | ProShares UltraPro MidCap400 | | 23.72 | 49 | -1.54 | 5.13 | 6.27% |
| MVV | ProShares Ultra MidCap400 | | 61.03 | 41 | -0.93 | 3.44 | 5.42% |
| MZZ | ProShares UltraShort MidCap400 | | 11.75 | 34 | 0.51 | -3.46 | -6.53% |
| MYY | ProShares Short MidCap400 | | 20.97 | 39 | 1.11 | -1.03 | -2.26% |
| 12Stocks.com: Charts, Trends, Fundamental Data and Performances of MidCap Stocks | |
|
We now take in-depth look at all MidCap stocks including charts, multi-period performances and overall trends (as measured by Smart Investing & Trading Score). One can sort MidCap stocks (click link to choose) by Daily, Weekly and by Year-to-Date performances. Also, one can sort by size of the company or by market capitalization. |
| Select Your Default Chart Type: | |||||
| |||||
| Click on stock symbol or name for detailed view. Click on to add stock symbol to your watchlist and to view watchlist. Quick View: Move mouse or cursor over "Daily" to quickly view daily technical stock chart and over "Weekly" to view weekly technical stock chart. | |||||

 | CPB Campbell Soup Company |
| Sector: Consumer Staples | |
| SubSector: Processed & Packaged Goods | |
| MarketCap: 14468.8 Millions | |
| Recent Price: 45.37 Smart Investing & Trading Score: 88 | |
| Day Percent Change: -0.37% Day Change: -0.17 | |
| Week Change: 2.65% Year-to-date Change: 5.0% | |
| CPB Links: Profile News Message Board | |
| Charts:- Daily , Weekly | |
| Add CPB to Watchlist: View: Get Complete CPB Trend Analysis ➞ | |
 | AVY Avery Dennison Corporation |
| Sector: Consumer Staples | |
| SubSector: Business Equipment | |
| MarketCap: 8051.27 Millions | |
| Recent Price: 217.16 Smart Investing & Trading Score: 78 | |
| Day Percent Change: 2.23% Day Change: 4.74 | |
| Week Change: 2.64% Year-to-date Change: 7.4% | |
| AVY Links: Profile News Message Board | |
| Charts:- Daily , Weekly | |
| Add AVY to Watchlist: View: Get Complete AVY Trend Analysis ➞ | |
 | DT Dynatrace, Inc. |
| Sector: Technology | |
| SubSector: Application Software | |
| MarketCap: 7007.12 Millions | |
| Recent Price: 46.60 Smart Investing & Trading Score: 57 | |
| Day Percent Change: -0.30% Day Change: -0.14 | |
| Week Change: 2.64% Year-to-date Change: -14.8% | |
| DT Links: Profile News Message Board | |
| Charts:- Daily , Weekly | |
| Add DT to Watchlist: View: Get Complete DT Trend Analysis ➞ | |
 | ADC Agree Realty Corporation |
| Sector: Financials | |
| SubSector: Property Management | |
| MarketCap: 2573.82 Millions | |
| Recent Price: 58.05 Smart Investing & Trading Score: 74 | |
| Day Percent Change: -0.55% Day Change: -0.32 | |
| Week Change: 2.63% Year-to-date Change: -7.8% | |
| ADC Links: Profile News Message Board | |
| Charts:- Daily , Weekly | |
| Add ADC to Watchlist: View: Get Complete ADC Trend Analysis ➞ | |
 | HLI Houlihan Lokey, Inc. |
| Sector: Financials | |
| SubSector: Investment Brokerage - National | |
| MarketCap: 3352.65 Millions | |
| Recent Price: 127.03 Smart Investing & Trading Score: 73 | |
| Day Percent Change: -0.76% Day Change: -0.97 | |
| Week Change: 2.63% Year-to-date Change: 5.9% | |
| HLI Links: Profile News Message Board | |
| Charts:- Daily , Weekly | |
| Add HLI to Watchlist: View: Get Complete HLI Trend Analysis ➞ | |
 | ZM Zoom Video Communications, Inc. |
| Sector: Technology | |
| SubSector: Application Software | |
| MarketCap: 36358.1 Millions | |
| Recent Price: 61.02 Smart Investing & Trading Score: 20 | |
| Day Percent Change: -1.02% Day Change: -0.63 | |
| Week Change: 2.62% Year-to-date Change: -15.1% | |
| ZM Links: Profile News Message Board | |
| Charts:- Daily , Weekly | |
| Add ZM to Watchlist: View: Get Complete ZM Trend Analysis ➞ | |
 | LAZ Lazard Ltd |
| Sector: Financials | |
| SubSector: Asset Management | |
| MarketCap: 3061.13 Millions | |
| Recent Price: 38.89 Smart Investing & Trading Score: 30 | |
| Day Percent Change: -1.04% Day Change: -0.41 | |
| Week Change: 2.59% Year-to-date Change: 11.8% | |
| LAZ Links: Profile News Message Board | |
| Charts:- Daily , Weekly | |
| Add LAZ to Watchlist: View: Get Complete LAZ Trend Analysis ➞ | |
 | ROK Rockwell Automation, Inc. |
| Sector: Industrials | |
| SubSector: Diversified Machinery | |
| MarketCap: 15666.1 Millions | |
| Recent Price: 276.95 Smart Investing & Trading Score: 61 | |
| Day Percent Change: 0.50% Day Change: 1.39 | |
| Week Change: 2.59% Year-to-date Change: -10.8% | |
| ROK Links: Profile News Message Board | |
| Charts:- Daily , Weekly | |
| Add ROK to Watchlist: View: Get Complete ROK Trend Analysis ➞ | |
 | NNN National Retail Properties, Inc. |
| Sector: Financials | |
| SubSector: REIT - Diversified | |
| MarketCap: 5459.93 Millions | |
| Recent Price: 41.03 Smart Investing & Trading Score: 85 | |
| Day Percent Change: -0.27% Day Change: -0.11 | |
| Week Change: 2.58% Year-to-date Change: -4.8% | |
| NNN Links: Profile News Message Board | |
| Charts:- Daily , Weekly | |
| Add NNN to Watchlist: View: Get Complete NNN Trend Analysis ➞ | |
 | IQV IQVIA Holdings Inc. |
| Sector: Health Care | |
| SubSector: Medical Laboratories & Research | |
| MarketCap: 19616.5 Millions | |
| Recent Price: 233.98 Smart Investing & Trading Score: 53 | |
| Day Percent Change: -2.85% Day Change: -6.86 | |
| Week Change: 2.58% Year-to-date Change: 1.1% | |
| IQV Links: Profile News Message Board | |
| Charts:- Daily , Weekly | |
| Add IQV to Watchlist: View: Get Complete IQV Trend Analysis ➞ | |
 | VMC Vulcan Materials Company |
| Sector: Industrials | |
| SubSector: General Building Materials | |
| MarketCap: 12304.7 Millions | |
| Recent Price: 258.54 Smart Investing & Trading Score: 51 | |
| Day Percent Change: 0.83% Day Change: 2.14 | |
| Week Change: 2.57% Year-to-date Change: 13.9% | |
| VMC Links: Profile News Message Board | |
| Charts:- Daily , Weekly | |
| Add VMC to Watchlist: View: Get Complete VMC Trend Analysis ➞ | |
 | RMD ResMed Inc. |
| Sector: Health Care | |
| SubSector: Medical Instruments & Supplies | |
| MarketCap: 18660.2 Millions | |
| Recent Price: 183.42 Smart Investing & Trading Score: 35 | |
| Day Percent Change: -0.20% Day Change: -0.36 | |
| Week Change: 2.56% Year-to-date Change: 6.6% | |
| RMD Links: Profile News Message Board | |
| Charts:- Daily , Weekly | |
| Add RMD to Watchlist: View: Get Complete RMD Trend Analysis ➞ | |
 | AWK American Water Works Company, Inc. |
| Sector: Utilities | |
| SubSector: Water Utilities | |
| MarketCap: 20029.2 Millions | |
| Recent Price: 121.55 Smart Investing & Trading Score: 74 | |
| Day Percent Change: 0.16% Day Change: 0.19 | |
| Week Change: 2.56% Year-to-date Change: -7.9% | |
| AWK Links: Profile News Message Board | |
| Charts:- Daily , Weekly | |
| Add AWK to Watchlist: View: Get Complete AWK Trend Analysis ➞ | |
 | ED Consolidated Edison, Inc. |
| Sector: Utilities | |
| SubSector: Electric Utilities | |
| MarketCap: 25012.3 Millions | |
| Recent Price: 94.11 Smart Investing & Trading Score: 100 | |
| Day Percent Change: 0.73% Day Change: 0.68 | |
| Week Change: 2.55% Year-to-date Change: 3.5% | |
| ED Links: Profile News Message Board | |
| Charts:- Daily , Weekly | |
| Add ED to Watchlist: View: Get Complete ED Trend Analysis ➞ | |
 | FFIV F5 Networks, Inc. |
| Sector: Technology | |
| SubSector: Business Software & Services | |
| MarketCap: 6675.38 Millions | |
| Recent Price: 181.85 Smart Investing & Trading Score: 45 | |
| Day Percent Change: -0.27% Day Change: -0.50 | |
| Week Change: 2.55% Year-to-date Change: 1.6% | |
| FFIV Links: Profile News Message Board | |
| Charts:- Daily , Weekly | |
| Add FFIV to Watchlist: View: Get Complete FFIV Trend Analysis ➞ | |
 | PNFP Pinnacle Financial Partners, Inc. |
| Sector: Financials | |
| SubSector: Regional - Southeast Banks | |
| MarketCap: 2771.75 Millions | |
| Recent Price: 81.53 Smart Investing & Trading Score: 69 | |
| Day Percent Change: -1.72% Day Change: -1.43 | |
| Week Change: 2.55% Year-to-date Change: -6.5% | |
| PNFP Links: Profile News Message Board | |
| Charts:- Daily , Weekly | |
| Add PNFP to Watchlist: View: Get Complete PNFP Trend Analysis ➞ | |
 | PEGA Pegasystems Inc. |
| Sector: Technology | |
| SubSector: Business Software & Services | |
| MarketCap: 5924.88 Millions | |
| Recent Price: 59.08 Smart Investing & Trading Score: 51 | |
| Day Percent Change: 0.34% Day Change: 0.20 | |
| Week Change: 2.55% Year-to-date Change: 20.9% | |
| PEGA Links: Profile News Message Board | |
| Charts:- Daily , Weekly | |
| Add PEGA to Watchlist: View: Get Complete PEGA Trend Analysis ➞ | |
 | NLY Annaly Capital Management, Inc. |
| Sector: Financials | |
| SubSector: Mortgage Investment | |
| MarketCap: 9127.79 Millions | |
| Recent Price: 18.69 Smart Investing & Trading Score: 39 | |
| Day Percent Change: 0.59% Day Change: 0.11 | |
| Week Change: 2.52% Year-to-date Change: -3.5% | |
| NLY Links: Profile News Message Board | |
| Charts:- Daily , Weekly | |
| Add NLY to Watchlist: View: Get Complete NLY Trend Analysis ➞ | |
 | GRMN Garmin Ltd. |
| Sector: Technology | |
| SubSector: Scientific & Technical Instruments | |
| MarketCap: 13909.3 Millions | |
| Recent Price: 143.03 Smart Investing & Trading Score: 56 | |
| Day Percent Change: 0.17% Day Change: 0.24 | |
| Week Change: 2.52% Year-to-date Change: 11.3% | |
| GRMN Links: Profile News Message Board | |
| Charts:- Daily , Weekly | |
| Add GRMN to Watchlist: View: Get Complete GRMN Trend Analysis ➞ | |
 | ALB Albemarle Corporation |
| Sector: Materials | |
| SubSector: Specialty Chemicals | |
| MarketCap: 6139.27 Millions | |
| Recent Price: 114.98 Smart Investing & Trading Score: 48 | |
| Day Percent Change: -0.25% Day Change: -0.29 | |
| Week Change: 2.52% Year-to-date Change: -20.4% | |
| ALB Links: Profile News Message Board | |
| Charts:- Daily , Weekly | |
| Add ALB to Watchlist: View: Get Complete ALB Trend Analysis ➞ | |
 | CBRE CBRE Group, Inc. |
| Sector: Financials | |
| SubSector: Property Management | |
| MarketCap: 12799.2 Millions | |
| Recent Price: 87.02 Smart Investing & Trading Score: 36 | |
| Day Percent Change: 0.29% Day Change: 0.25 | |
| Week Change: 2.5% Year-to-date Change: -6.5% | |
| CBRE Links: Profile News Message Board | |
| Charts:- Daily , Weekly | |
| Add CBRE to Watchlist: View: Get Complete CBRE Trend Analysis ➞ | |
 | PLTK Playtika Holding Corp. |
| Sector: Services & Goods | |
| SubSector: Electronic Gaming & Multimedia | |
| MarketCap: 4260 Millions | |
| Recent Price: 7.05 Smart Investing & Trading Score: 69 | |
| Day Percent Change: 0.50% Day Change: 0.04 | |
| Week Change: 2.47% Year-to-date Change: -18.3% | |
| PLTK Links: Profile News Message Board | |
| Charts:- Daily , Weekly | |
| Add PLTK to Watchlist: View: Get Complete PLTK Trend Analysis ➞ | |
 | MTB M&T Bank Corporation |
| Sector: Financials | |
| SubSector: Regional - Northeast Banks | |
| MarketCap: 13950.9 Millions | |
| Recent Price: 146.90 Smart Investing & Trading Score: 95 | |
| Day Percent Change: -0.72% Day Change: -1.06 | |
| Week Change: 2.46% Year-to-date Change: 7.2% | |
| MTB Links: Profile News Message Board | |
| Charts:- Daily , Weekly | |
| Add MTB to Watchlist: View: Get Complete MTB Trend Analysis ➞ | |
 | POOL Pool Corporation |
| Sector: Consumer Staples | |
| SubSector: Sporting Goods | |
| MarketCap: 7479.64 Millions | |
| Recent Price: 370.00 Smart Investing & Trading Score: 51 | |
| Day Percent Change: -1.96% Day Change: -7.39 | |
| Week Change: 2.46% Year-to-date Change: -7.2% | |
| POOL Links: Profile News Message Board | |
| Charts:- Daily , Weekly | |
| Add POOL to Watchlist: View: Get Complete POOL Trend Analysis ➞ | |
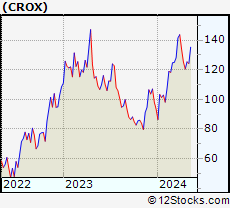 | CROX Crocs, Inc. |
| Sector: Consumer Staples | |
| SubSector: Textile - Apparel Footwear & Accessories | |
| MarketCap: 823.47 Millions | |
| Recent Price: 123.51 Smart Investing & Trading Score: 68 | |
| Day Percent Change: -1.80% Day Change: -2.26 | |
| Week Change: 2.46% Year-to-date Change: 32.2% | |
| CROX Links: Profile News Message Board | |
| Charts:- Daily , Weekly | |
| Add CROX to Watchlist: View: Get Complete CROX Trend Analysis ➞ | |
| For tabular summary view of above stock list: Summary View ➞ 0 - 25 , 25 - 50 , 50 - 75 , 75 - 100 , 100 - 125 , 125 - 150 , 150 - 175 , 175 - 200 , 200 - 225 , 225 - 250 , 250 - 275 , 275 - 300 , 300 - 325 , 325 - 350 , 350 - 375 , 375 - 400 , 400 - 425 , 425 - 450 , 450 - 475 , 475 - 500 , 500 - 525 , 525 - 550 , 550 - 575 , 575 - 600 , 600 - 625 , 625 - 650 , 650 - 675 , 675 - 700 , 700 - 725 , 725 - 750 , 750 - 775 | ||
| Click To Change The Sort Order: By Market Cap or Company Size Performance: Year-to-date, Week and Day | |
| Select Chart Type: | ||
|
Best Stocks Today 12Stocks.com |
© 2024 12Stocks.com Terms & Conditions Privacy Contact Us
All Information Provided Only For Education And Not To Be Used For Investing or Trading. See Terms & Conditions


One More Thing ... Get Best Stocks Delivered Daily!
Never Ever Miss A Move With Our Top Ten Stocks Lists
Find Best Stocks In Any Market - Bull or Bear Market
Take A Peek At Our Top Ten Stocks Lists: Daily, Weekly, Year-to-Date & Top Trends
Find Best Stocks In Any Market - Bull or Bear Market
Take A Peek At Our Top Ten Stocks Lists: Daily, Weekly, Year-to-Date & Top Trends
Midcap Stocks With Best Up Trends [0-bearish to 100-bullish]: Kirby [100], HashiCorp [100], Ardagh Metal[100], Teradyne [100], Antero Resources[100], Churchill Downs[100], Dover [100], Tractor Supply[100], Virtu Financial[100], EQT [100], Microchip [100]
Best Midcap Stocks Year-to-Date:
Vistra Energy[88.16%], AppLovin [73.92%], ShockWave Medical[72.7%], EMCOR [62.16%], Constellation Energy[60.54%], Spotify [53.81%], Antero Resources[47.22%], Pure Storage[46.44%], Natera [45.72%], Wingstop [44.17%], CAVA [43.95%] Best Midcap Stocks This Week:
HashiCorp [36.92%], Hasbro [17.55%], Kirby [17.07%], Tandem Diabetes[16.86%], Ardagh Metal[14.9%], First Citizens[14.87%], Antero Resources[14%], Tyler Technologies[13.57%], Teradyne [13.48%], Wabtec [13.19%], Globe Life[13.19%] Best Midcap Stocks Daily:
Kirby [10.99%], HashiCorp [10.69%], First Citizens[9.80%], Tyler Technologies[9.32%], Ardagh Metal[8.82%], TransUnion [8.17%], Teradyne [8.15%], Carrier Global[7.19%], Antero Resources[6.20%], CACI [5.93%], United Rentals[5.45%]