
 Login Sign Up


| |||||
 |  | ||||

| 12Stocks.com Market Intelligence |
Best Latin America Stocks
|
|
| Quick Read: Top Latin America Stocks By Performances & Trends: Daily, Weekly, Year-to-Date, Market Cap (Size) & Technical Trends | |||
| Best Latin America Views: Quick Browse View, Summary & Slide Show | |||
| 12Stocks.com Latin America Stocks Performances & Trends Daily | |||||||||
|
|  The overall market intelligence score is 80 (0-bearish to 100-bullish) which puts Latin America index in short term neutral to bullish trend. The market intelligence score from previous trading session is 100 and hence a deterioration of trend.
| ||||||||
| Here are the market intelligence trend scores of the most requested Latin America stocks at 12Stocks.com (click stock name for detailed review): | |
| Scroll down this page for most comprehensive review of Latin America stocks by performance, trends, technical analysis, charts, fund plays & more | |


| 12Stocks.com: Top Performing Latin America Index Stocks | ||||||||||||||||||||||||||||||||||||||||||||||||
 The top performing Latin America Index stocks year to date are
Now, more recently, over last week, the top performing Latin America Index stocks on the move are


|
||||||||||||||||||||||||||||||||||||||||||||||||
| 12Stocks.com: Investing in Latin America Index with Stocks | |
|
The following table helps investors and traders sort through current performance and trends (as measured by market intelligence score) of various
stocks in the Latin America Index. Quick View: Move mouse or cursor over stock symbol (ticker) to view short-term technical chart and over stock name to view long term chart. Click on  to add stock symbol to your watchlist and to add stock symbol to your watchlist and  to view watchlist. Click on any ticker or stock name for detailed market intelligence report for that stock. to view watchlist. Click on any ticker or stock name for detailed market intelligence report for that stock. |
12Stocks.com Performance of Stocks in Latin America Index
| Ticker | Stock Name | Watchlist | Category | Recent Price | Market Intelligence Score | Change % | YTD Change% |
| FNV | Franco-Nevada |   | Materials | 188.35 | 100 | 1.97% | 55.41% |
| EQX | Equinox Gold | | Materials | 8.76 | 100 | 1.94% | 57.37% |
| PDS | Precision Drilling | | Energy | 57.83 | 100 | 1.81% | -10.86% |
| CX | CEMEX S.A.B. | | Industrials | 9.09 | 100 | 1.62% | 56.90% |
| SVM | Silvercorp Metals | | Materials | 4.84 | 100 | 1.59% | 49.43% |
| DNN | Denison Mines | | Materials | 2.32 | 100 | 1.56% | 8.33% |
| TRX | Tanzanian Gold | | Materials | 0.37 | 100 | 1.52% | 10.85% |
| OR | Osisko Gold | | Materials | 32.16 | 100 | 1.46% | 70.08% |
| SA | Seabridge Gold | | Materials | 17.44 | 100 | 1.24% | 43.65% |
| AEM | Agnico Eagle | | Materials | 144.17 | 100 | 1.23% | 75.66% |
| WPM | Wheaton Precious | | Materials | 100.42 | 100 | 1.19% | 68.45% |
| SU | Suncor Energy | | Energy | 41.30 | 100 | 1.14% | 11.88% |
| MXE | Mexico Equity | | Financials | 11.13 | 100 | 1.00% | 38.36% |
| RPTX | Repare | | Health Care | 1.67 | 100 | 0.98% | 18.32% |
| PSLV | Sprott Physical | | Financials | 13.48 | 100 | 0.70% | 33.99% |
| NG | NovaGold Resources | | Materials | 6.84 | 100 | 0.51% | 78.68% |
| NU | Nu | | Financials | 14.80 | 100 | 0.37% | 31.95% |
| CEF | Sprott Physical | | Financials | 32.23 | 100 | -0.06% | 30.22% |
| CM | Canadian Imperial | | Financials | 77.29 | 100 | -0.07% | 18.12% |
| BMO | Bank of Montreal | | Financials | 121.00 | 100 | -0.17% | 19.89% |
| BNS | Bank of Nova Scotia | | Financials | 62.46 | 100 | -0.18% | 10.16% |
| ENB | Enbridge | | Energy | 48.34 | 100 | -0.19% | 16.41% |
| PHYS | Sprott Physical | | Financials | 26.52 | 100 | -0.31% | 27.21% |
| TV | Grupo Televisa | | Services & Goods | 2.79 | 100 | -0.42% | 47.20% |
| EMX | EMX Royalty | | Materials | 3.65 | 100 | -1.58% | 79.77% |
| To view more stocks, click on Next / Previous arrows or select different range: 0 - 25 , 25 - 50 , 50 - 75 , 75 - 100 , 100 - 125 , 125 - 150 , 150 - 175 , 175 - 200 , 200 - 225 | ||
 | Click To Change The Sort Order: By Market Cap or Company Size Performance: Year-to-date, Week and Day |  |
| Detailed Overview Of Latin America Stocks |
| Latin America Technical Overview, Leaders & Laggards, Top Latin America ETF Funds & Detailed Latin America Stocks List, Charts, Trends & More |
| Latin America: Technical Analysis, Trends & YTD Performance | |
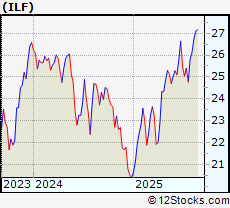
 ILF Weekly Chart |
|
| Long Term Trend: Very Good | |
| Medium Term Trend: Very Good | |
 ILF Daily Chart |
|
| Short Term Trend: Very Good | |
| Overall Trend Score: 80 | |
| YTD Performance: 20.45% | |
| **Trend Scores & Views Are Only For Educational Purposes And Not For Investing | |
| 12Stocks.com: Investing in Latin America Index using Exchange Traded Funds | |
|
The following table shows list of key exchange traded funds (ETF) that
help investors play Latin America stock market. For detailed view, check out our ETF Funds section of our website. Quick View: Move mouse or cursor over ETF symbol (ticker) to view short-term technical chart and over ETF name to view long term chart. Click on ticker or stock name for detailed view. Click on to add stock symbol to your watchlist and to view watchlist. |
12Stocks.com List of ETFs that track Latin America Index
| Ticker | ETF Name | Watchlist | Recent Price | Market Intelligence Score | Change % | Week % | Year-to-date % |
| ILF | Latin America 40 | | 27.02 | 80 | -0.3 | -0.3 | 20.45% |
| EWC | Canada | | 48.79 | 100 | 1.57 | 1.59 | 17.28% |
| FLN | Latin America AlphaDEX | | 20.48 | 100 | 0.31 | -0.55 | 33.28% |
| EWZ | Brazil | | 29.50 | 60 | 3.33 | 1.35 | 14.93% |
| EWW | Mexico | | 61.94 | 100 | 2 | 2.35 | 30.49% |
| ARGT | Argentina | | 80.15 | 0 | 0.48 | -2.82 | -1.29% |
| EWZS | Brazil Small-Cap | | 13.40 | 70 | -0.6 | -2.06 | 35.19% |
| BRF | Brazil Small-Cap | | 15.65 | 70 | -0.22 | -2.19 | 32.59% |
| BZQ | Short Brazil | | 10.00 | 30 | -0.06 | 1.69 | -39.37% |
| BRZU | Brazil Bull 3X | | 67.10 | 50 | -0.12 | -1.98 | 45.21% |
| 12Stocks.com: Charts, Trends, Fundamental Data and Performances of Latin America Stocks | |
|
We now take in-depth look at all Latin America stocks including charts, multi-period performances and overall trends (as measured by market intelligence score). One can sort Latin America stocks (click link to choose) by Daily, Weekly and by Year-to-Date performances. Also, one can sort by size of the company or by market capitalization. |
| Select Your Default Chart Type: | |||||
| |||||
| Click on stock symbol or name for detailed view. Click on to add stock symbol to your watchlist and to view watchlist. Quick View: Move mouse or cursor over "Daily" to quickly view daily technical stock chart and over "Weekly" to view weekly technical stock chart. | |||||

 | FNV Franco-Nevada Corporation |
| Sector: Materials | |
| SubSector: Gold | |
| MarketCap: 17703.9 Millions | |
| Recent Price: 188.35 Market Intelligence Score: 100 | |
| Day Percent Change: 1.97% Day Change: 3.52 | |
| Week Change: 2.53% Year-to-date Change: 55.4% | |
| FNV Links: Profile News Message Board | |
| Charts:- Daily , Weekly | |
| Add FNV to Watchlist: View: Get Complete FNV Trend Analysis ➞ | |
 | EQX Equinox Gold Corp. |
| Sector: Materials | |
| SubSector: Gold | |
| MarketCap: 706.119 Millions | |
| Recent Price: 8.76 Market Intelligence Score: 100 | |
| Day Percent Change: 1.94% Day Change: 0.15 | |
| Week Change: 1.02% Year-to-date Change: 57.4% | |
| EQX Links: Profile News Message Board | |
| Charts:- Daily , Weekly | |
| Add EQX to Watchlist: View: Get Complete EQX Trend Analysis ➞ | |
 | PDS Precision Drilling Corporation |
| Sector: Energy | |
| SubSector: Oil & Gas Equipment & Services | |
| MarketCap: 103.461 Millions | |
| Recent Price: 57.83 Market Intelligence Score: 100 | |
| Day Percent Change: 1.81% Day Change: 0.97 | |
| Week Change: -1.09% Year-to-date Change: -10.9% | |
| PDS Links: Profile News Message Board | |
| Charts:- Daily , Weekly | |
| Add PDS to Watchlist: View: Get Complete PDS Trend Analysis ➞ | |
 | CX CEMEX, S.A.B. de C.V. |
| Sector: Industrials | |
| SubSector: Cement | |
| MarketCap: 2948.23 Millions | |
| Recent Price: 9.09 Market Intelligence Score: 100 | |
| Day Percent Change: 1.62% Day Change: 0.14 | |
| Week Change: 3.41% Year-to-date Change: 56.9% | |
| CX Links: Profile News Message Board | |
| Charts:- Daily , Weekly | |
| Add CX to Watchlist: View: Get Complete CX Trend Analysis ➞ | |
 | SVM Silvercorp Metals Inc. |
| Sector: Materials | |
| SubSector: Silver | |
| MarketCap: 504.056 Millions | |
| Recent Price: 4.84 Market Intelligence Score: 100 | |
| Day Percent Change: 1.59% Day Change: 0.07 | |
| Week Change: -1.97% Year-to-date Change: 49.4% | |
| SVM Links: Profile News Message Board | |
| Charts:- Daily , Weekly | |
| Add SVM to Watchlist: View: Get Complete SVM Trend Analysis ➞ | |
 | DNN Denison Mines Corp. |
| Sector: Materials | |
| SubSector: Industrial Metals & Minerals | |
| MarketCap: 154.11 Millions | |
| Recent Price: 2.32 Market Intelligence Score: 100 | |
| Day Percent Change: 1.56% Day Change: 0.03 | |
| Week Change: -3.94% Year-to-date Change: 8.3% | |
| DNN Links: Profile News Message Board | |
| Charts:- Daily , Weekly | |
| Add DNN to Watchlist: View: Get Complete DNN Trend Analysis ➞ | |
 | TRX Tanzanian Gold Corporation |
| Sector: Materials | |
| SubSector: Gold | |
| MarketCap: 95.9619 Millions | |
| Recent Price: 0.37 Market Intelligence Score: 100 | |
| Day Percent Change: 1.52% Day Change: 0.01 | |
| Week Change: -4.97% Year-to-date Change: 10.9% | |
| TRX Links: Profile News Message Board | |
| Charts:- Daily , Weekly | |
| Add TRX to Watchlist: View: Get Complete TRX Trend Analysis ➞ | |
 | OR Osisko Gold Royalties Ltd |
| Sector: Materials | |
| SubSector: Gold | |
| MarketCap: 1025.99 Millions | |
| Recent Price: 32.16 Market Intelligence Score: 100 | |
| Day Percent Change: 1.46% Day Change: 0.44 | |
| Week Change: 0.07% Year-to-date Change: 70.1% | |
| OR Links: Profile News Message Board | |
| Charts:- Daily , Weekly | |
| Add OR to Watchlist: View: Get Complete OR Trend Analysis ➞ | |
 | SA Seabridge Gold Inc. |
| Sector: Materials | |
| SubSector: Gold | |
| MarketCap: 565.419 Millions | |
| Recent Price: 17.44 Market Intelligence Score: 100 | |
| Day Percent Change: 1.24% Day Change: 0.2 | |
| Week Change: -1.09% Year-to-date Change: 43.7% | |
| SA Links: Profile News Message Board | |
| Charts:- Daily , Weekly | |
| Add SA to Watchlist: View: Get Complete SA Trend Analysis ➞ | |
 | AEM Agnico Eagle Mines Limited |
| Sector: Materials | |
| SubSector: Gold | |
| MarketCap: 9491.49 Millions | |
| Recent Price: 144.17 Market Intelligence Score: 100 | |
| Day Percent Change: 1.23% Day Change: 1.65 | |
| Week Change: 2.72% Year-to-date Change: 75.7% | |
| AEM Links: Profile News Message Board | |
| Charts:- Daily , Weekly | |
| Add AEM to Watchlist: View: Get Complete AEM Trend Analysis ➞ | |
 | WPM Wheaton Precious Metals Corp. |
| Sector: Materials | |
| SubSector: Silver | |
| MarketCap: 11349.6 Millions | |
| Recent Price: 100.42 Market Intelligence Score: 100 | |
| Day Percent Change: 1.19% Day Change: 1.11 | |
| Week Change: 0.07% Year-to-date Change: 68.5% | |
| WPM Links: Profile News Message Board | |
| Charts:- Daily , Weekly | |
| Add WPM to Watchlist: View: Get Complete WPM Trend Analysis ➞ | |
 | SU Suncor Energy Inc. |
| Sector: Energy | |
| SubSector: Independent Oil & Gas | |
| MarketCap: 21550.6 Millions | |
| Recent Price: 41.30 Market Intelligence Score: 100 | |
| Day Percent Change: 1.14% Day Change: 0.44 | |
| Week Change: 0.13% Year-to-date Change: 11.9% | |
| SU Links: Profile News Message Board | |
| Charts:- Daily , Weekly | |
| Add SU to Watchlist: View: Get Complete SU Trend Analysis ➞ | |
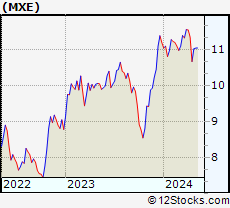 | MXE Mexico Equity & Income Fund Inc. |
| Sector: Financials | |
| SubSector: Asset Management | |
| MarketCap: 34.6203 Millions | |
| Recent Price: 11.13 Market Intelligence Score: 100 | |
| Day Percent Change: 1% Day Change: 0.11 | |
| Week Change: 2.44% Year-to-date Change: 38.4% | |
| MXE Links: Profile News Message Board | |
| Charts:- Daily , Weekly | |
| Add MXE to Watchlist: View: Get Complete MXE Trend Analysis ➞ | |
 | RPTX Repare Therapeutics Inc. |
| Sector: Health Care | |
| SubSector: Biotechnology | |
| MarketCap: 13687 Millions | |
| Recent Price: 1.67 Market Intelligence Score: 100 | |
| Day Percent Change: 0.98% Day Change: 0.01 | |
| Week Change: -0.64% Year-to-date Change: 18.3% | |
| RPTX Links: Profile News Message Board | |
| Charts:- Daily , Weekly | |
| Add RPTX to Watchlist: View: Get Complete RPTX Trend Analysis ➞ | |
 | PSLV Sprott Physical Silver Trust |
| Sector: Financials | |
| SubSector: Exchange Traded Fund | |
| MarketCap: 765.851 Millions | |
| Recent Price: 13.48 Market Intelligence Score: 100 | |
| Day Percent Change: 0.7% Day Change: 0.09 | |
| Week Change: 0.31% Year-to-date Change: 34.0% | |
| PSLV Links: Profile News Message Board | |
| Charts:- Daily , Weekly | |
| Add PSLV to Watchlist: View: Get Complete PSLV Trend Analysis ➞ | |
 | NG NovaGold Resources Inc. |
| Sector: Materials | |
| SubSector: Gold | |
| MarketCap: 2499.49 Millions | |
| Recent Price: 6.84 Market Intelligence Score: 100 | |
| Day Percent Change: 0.51% Day Change: 0.03 | |
| Week Change: -0.34% Year-to-date Change: 78.7% | |
| NG Links: Profile News Message Board | |
| Charts:- Daily , Weekly | |
| Add NG to Watchlist: View: Get Complete NG Trend Analysis ➞ | |
 | NU Nu Holdings Ltd. |
| Sector: Financials | |
| SubSector: Banks - Diversified | |
| MarketCap: 37240 Millions | |
| Recent Price: 14.80 Market Intelligence Score: 100 | |
| Day Percent Change: 0.37% Day Change: 0.05 | |
| Week Change: 13.82% Year-to-date Change: 32.0% | |
| NU Links: Profile News Message Board | |
| Charts:- Daily , Weekly | |
| Add NU to Watchlist: View: Get Complete NU Trend Analysis ➞ | |
 | CEF Sprott Physical Gold and Silver Trust |
| Sector: Financials | |
| SubSector: Asset Management | |
| MarketCap: 2485.33 Millions | |
| Recent Price: 32.23 Market Intelligence Score: 100 | |
| Day Percent Change: -0.06% Day Change: -0.02 | |
| Week Change: -0.13% Year-to-date Change: 30.2% | |
| CEF Links: Profile News Message Board | |
| Charts:- Daily , Weekly | |
| Add CEF to Watchlist: View: Get Complete CEF Trend Analysis ➞ | |
 | CM Canadian Imperial Bank of Commerce |
| Sector: Financials | |
| SubSector: Money Center Banks | |
| MarketCap: 27150.5 Millions | |
| Recent Price: 77.29 Market Intelligence Score: 100 | |
| Day Percent Change: -0.07% Day Change: -0.05 | |
| Week Change: -1.03% Year-to-date Change: 18.1% | |
| CM Links: Profile News Message Board | |
| Charts:- Daily , Weekly | |
| Add CM to Watchlist: View: Get Complete CM Trend Analysis ➞ | |
 | BMO Bank of Montreal |
| Sector: Financials | |
| SubSector: Money Center Banks | |
| MarketCap: 32830.2 Millions | |
| Recent Price: 121.00 Market Intelligence Score: 100 | |
| Day Percent Change: -0.17% Day Change: -0.19 | |
| Week Change: -1.43% Year-to-date Change: 19.9% | |
| BMO Links: Profile News Message Board | |
| Charts:- Daily , Weekly | |
| Add BMO to Watchlist: View: Get Complete BMO Trend Analysis ➞ | |
 | BNS The Bank of Nova Scotia |
| Sector: Financials | |
| SubSector: Money Center Banks | |
| MarketCap: 48742.1 Millions | |
| Recent Price: 62.46 Market Intelligence Score: 100 | |
| Day Percent Change: -0.18% Day Change: -0.1 | |
| Week Change: -0.05% Year-to-date Change: 10.2% | |
| BNS Links: Profile News Message Board | |
| Charts:- Daily , Weekly | |
| Add BNS to Watchlist: View: Get Complete BNS Trend Analysis ➞ | |
 | ENB Enbridge Inc. |
| Sector: Energy | |
| SubSector: Oil & Gas Pipelines | |
| MarketCap: 62578.4 Millions | |
| Recent Price: 48.34 Market Intelligence Score: 100 | |
| Day Percent Change: -0.19% Day Change: -0.09 | |
| Week Change: -0.5% Year-to-date Change: 16.4% | |
| ENB Links: Profile News Message Board | |
| Charts:- Daily , Weekly | |
| Add ENB to Watchlist: View: Get Complete ENB Trend Analysis ➞ | |
 | PHYS Sprott Physical Gold Trust |
| Sector: Financials | |
| SubSector: Exchange Traded Fund | |
| MarketCap: 2365.21 Millions | |
| Recent Price: 26.52 Market Intelligence Score: 100 | |
| Day Percent Change: -0.31% Day Change: -0.08 | |
| Week Change: 0% Year-to-date Change: 27.2% | |
| PHYS Links: Profile News Message Board | |
| Charts:- Daily , Weekly | |
| Add PHYS to Watchlist: View: Get Complete PHYS Trend Analysis ➞ | |
 | TV Grupo Televisa, S.A.B. |
| Sector: Services & Goods | |
| SubSector: Broadcasting - TV | |
| MarketCap: 3740.43 Millions | |
| Recent Price: 2.79 Market Intelligence Score: 100 | |
| Day Percent Change: -0.42% Day Change: -0.01 | |
| Week Change: 0.43% Year-to-date Change: 47.2% | |
| TV Links: Profile News Message Board | |
| Charts:- Daily , Weekly | |
| Add TV to Watchlist: View: Get Complete TV Trend Analysis ➞ | |
 | EMX EMX Royalty Corporation |
| Sector: Materials | |
| SubSector: Industrial Metals & Minerals | |
| MarketCap: 103.91 Millions | |
| Recent Price: 3.65 Market Intelligence Score: 100 | |
| Day Percent Change: -1.58% Day Change: -0.05 | |
| Week Change: -6.89% Year-to-date Change: 79.8% | |
| EMX Links: Profile News Message Board | |
| Charts:- Daily , Weekly | |
| Add EMX to Watchlist: View: Get Complete EMX Trend Analysis ➞ | |
| To view more stocks, click on Next / Previous arrows or select different range: 0 - 25 , 25 - 50 , 50 - 75 , 75 - 100 , 100 - 125 , 125 - 150 , 150 - 175 , 175 - 200 , 200 - 225 | ||
| Click To Change The Sort Order: By Market Cap or Company Size Performance: Year-to-date, Week and Day | |
| Select Chart Type: | ||
 Best Stocks Today 12Stocks.com |
© 2025 12Stocks.com Terms & Conditions Privacy Contact Us
All Information Provided Only For Education And Not To Be Used For Investing or Trading. See Terms & Conditions


One More Thing ... Get Best Stocks Delivered Daily!
Never Ever Miss A Move With Our Top Ten Stocks Lists
Find Best Stocks In Any Market - Bull or Bear Market
Take A Peek At Our Top Ten Stocks Lists: Daily, Weekly, Year-to-Date & Top Trends
Find Best Stocks In Any Market - Bull or Bear Market
Take A Peek At Our Top Ten Stocks Lists: Daily, Weekly, Year-to-Date & Top Trends
Latin America Stocks With Best Up Trends [0-bearish to 100-bullish]: Gold Royalty[100], Alamos Gold[100], Vox Royalty[100], Endeavour Silver[100], Fortuna Silver[100], IAMGOLD [100], New Gold[100], New Found[100], Sandstorm Gold[100], McEwen Mining[100], SSR Mining[100]
Best Latin America Stocks Year-to-Date:
Dominion Diamond[207.43%], Gold Royalty[161.16%], SSR Mining[143.1%], New Gold[119.35%], Kinross Gold[111.46%], Vasta Platform[109.75%], Celestica [96.47%], Sandstorm Gold[95.03%], Inter & Co[86.91%], StoneCo [86.07%], NovaGold Resources[78.68%] Best Latin America Stocks This Week:
Dominion Diamond[33.17%], Nu [13.82%], Alamos Gold[9.37%], Novadaq [8%], New Gold[6.67%], Mercer [5.9%], BRF S.A[5.85%], Trilogy Metals[5.77%], IAMGOLD [5.75%], McEwen Mining[5.39%], SSR Mining[5.22%] Best Latin America Stocks Daily:
Dominion Diamond[28.83%], Bioceres Crop[8.89%], Gold Royalty[6.76%], Cronos [5.79%], Vision Marine[5.23%], Algoma Steel[5.05%], Alamos Gold[4.79%], Tilray [4.72%], Vox Royalty[4.72%], OrganiGram [4.67%], Braskem S.A[4.48%]