
 Login Sign Up


| |||||
 |  | ||||

| 12Stocks.com Market Intelligence |
Best Latin America Stocks
|
|
| Quick Read: Top Latin America Stocks By Performances & Trends: Daily, Weekly, Year-to-Date, Market Cap (Size) & Technical Trends | |||
| Best Latin America Views: Quick Browse View, Summary & Slide Show | |||
| 12Stocks.com Latin America Stocks Performances & Trends Daily | |||||||||
|
|  The overall market intelligence score is 80 (0-bearish to 100-bullish) which puts Latin America index in short term neutral to bullish trend. The market intelligence score from previous trading session is 100 and hence a deterioration of trend.
| ||||||||
| Here are the market intelligence trend scores of the most requested Latin America stocks at 12Stocks.com (click stock name for detailed review): | |
| Scroll down this page for most comprehensive review of Latin America stocks by performance, trends, technical analysis, charts, fund plays & more | |


| 12Stocks.com: Top Performing Latin America Index Stocks | ||||||||||||||||||||||||||||||||||||||||||||||||
 The top performing Latin America Index stocks year to date are
Now, more recently, over last week, the top performing Latin America Index stocks on the move are


|
||||||||||||||||||||||||||||||||||||||||||||||||
| 12Stocks.com: Investing in Latin America Index with Stocks | |
|
The following table helps investors and traders sort through current performance and trends (as measured by market intelligence score) of various
stocks in the Latin America Index. Quick View: Move mouse or cursor over stock symbol (ticker) to view short-term technical chart and over stock name to view long term chart. Click on  to add stock symbol to your watchlist and to add stock symbol to your watchlist and  to view watchlist. Click on any ticker or stock name for detailed market intelligence report for that stock. to view watchlist. Click on any ticker or stock name for detailed market intelligence report for that stock. |
12Stocks.com Performance of Stocks in Latin America Index
| Ticker | Stock Name | Watchlist | Category | Recent Price | Market Intelligence Score | Change % | YTD Change% |
| MERC | Mercer |   | Consumer Staples | 3.33 | 30 | 1.89% | -48.64% |
| NTR | Nutrien | | Materials | 57.62 | 30 | 1.00% | 31.39% |
| STKL | SunOpta | | Consumer Staples | 6.27 | 30 | 0.98% | -19.87% |
| VIV | Telefonica Brasil | | Technology | 12.47 | 30 | 0.40% | 70.38% |
| BEP | Brookfield Renewable | | Utilities | 25.38 | 30 | 0.16% | 12.24% |
| TU | TELUS | | Technology | 16.49 | 30 | 0.00% | 26.56% |
| TAC | TransAlta | | Utilities | 12.30 | 30 | 0.00% | -12.22% |
| MFC | Manulife Financial | | Financials | 30.75 | 30 | -0.07% | -0.08% |
| SUZ | Suzano S.A | | Consumer Staples | 9.73 | 30 | -0.10% | -5.34% |
| FTS | Fortis | | Utilities | 49.74 | 30 | -0.16% | 24.48% |
| BMA | Banco Macro | | Financials | 57.93 | 30 | -0.35% | -31.07% |
| GIL | Gildan Activewear | | Consumer Staples | 54.60 | 30 | -0.71% | 16.29% |
| BBDO | Banco Bradesco | | Financials | 2.69 | 30 | -1.18% | 49.20% |
| LULU | Lululemon Athletica | | Consumer Staples | 199.14 | 30 | -1.51% | -51.92% |
| ABCL | AbCellera Biologics | | Health Care | 4.18 | 20 | 3.12% | 46.76% |
| DCBO | Docebo | | Technology | 31.18 | 20 | 3.09% | -31.49% |
| VERO | Venus Concept | | Health Care | 2.21 | 20 | 2.97% | -41.33% |
| TMQ | Trilogy Metals | | Materials | 1.69 | 20 | 0.00% | 42.24% |
| AFYA | Afya | | Services & Goods | 15.18 | 20 | -0.27% | -4.82% |
| ELP | Companhia Paranaense | | Utilities | 9.06 | 20 | -0.46% | 50.31% |
| BLDP | Ballard Power | | Industrials | 2.02 | 20 | -0.53% | 13.86% |
| BAM | Brookfield Asset | | Financials | 60.16 | 20 | -0.61% | 10.62% |
| WPRT | Westport Fuel | | Consumer Staples | 2.79 | 20 | -0.71% | -21.51% |
| PROF | Profound Medical | | Materials | 4.47 | 20 | -0.86% | -38.75% |
| TGS | Transportadora de | | Utilities | 27.16 | 10 | 3.27% | -3.89% |
| To view more stocks, click on Next / Previous arrows or select different range: 0 - 25 , 25 - 50 , 50 - 75 , 75 - 100 , 100 - 125 , 125 - 150 , 150 - 175 , 175 - 200 , 200 - 225 | ||
 | Click To Change The Sort Order: By Market Cap or Company Size Performance: Year-to-date, Week and Day |  |
| Detailed Overview Of Latin America Stocks |
| Latin America Technical Overview, Leaders & Laggards, Top Latin America ETF Funds & Detailed Latin America Stocks List, Charts, Trends & More |
| Latin America: Technical Analysis, Trends & YTD Performance | |
 ILF Weekly Chart |
|
| Long Term Trend: Very Good | |
| Medium Term Trend: Very Good | |
 ILF Daily Chart |
|
| Short Term Trend: Very Good | |
| Overall Trend Score: 80 | |
| YTD Performance: 20.45% | |
| **Trend Scores & Views Are Only For Educational Purposes And Not For Investing | |
| 12Stocks.com: Investing in Latin America Index using Exchange Traded Funds | |
|
The following table shows list of key exchange traded funds (ETF) that
help investors play Latin America stock market. For detailed view, check out our ETF Funds section of our website. Quick View: Move mouse or cursor over ETF symbol (ticker) to view short-term technical chart and over ETF name to view long term chart. Click on ticker or stock name for detailed view. Click on to add stock symbol to your watchlist and to view watchlist. |
12Stocks.com List of ETFs that track Latin America Index
| Ticker | ETF Name | Watchlist | Recent Price | Market Intelligence Score | Change % | Week % | Year-to-date % |
| ILF | Latin America 40 | | 27.02 | 80 | -0.3 | -0.3 | 20.45% |
| EWC | Canada | | 48.79 | 100 | 1.57 | 1.59 | 17.28% |
| FLN | Latin America AlphaDEX | | 20.48 | 100 | 0.31 | -0.55 | 33.28% |
| EWZ | Brazil | | 29.50 | 60 | 3.33 | 1.35 | 14.93% |
| EWW | Mexico | | 61.94 | 100 | 2 | 2.35 | 30.49% |
| ARGT | Argentina | | 80.15 | 0 | 0.48 | -2.82 | -1.29% |
| EWZS | Brazil Small-Cap | | 13.40 | 70 | -0.6 | -2.06 | 35.19% |
| BRF | Brazil Small-Cap | | 15.65 | 70 | -0.22 | -2.19 | 32.59% |
| BZQ | Short Brazil | | 10.00 | 30 | -0.06 | 1.69 | -39.37% |
| BRZU | Brazil Bull 3X | | 67.10 | 50 | -0.12 | -1.98 | 45.21% |
| 12Stocks.com: Charts, Trends, Fundamental Data and Performances of Latin America Stocks | |
|
We now take in-depth look at all Latin America stocks including charts, multi-period performances and overall trends (as measured by market intelligence score). One can sort Latin America stocks (click link to choose) by Daily, Weekly and by Year-to-Date performances. Also, one can sort by size of the company or by market capitalization. |
| Select Your Default Chart Type: | |||||
| |||||
| Click on stock symbol or name for detailed view. Click on to add stock symbol to your watchlist and to view watchlist. Quick View: Move mouse or cursor over "Daily" to quickly view daily technical stock chart and over "Weekly" to view weekly technical stock chart. | |||||

 | MERC Mercer International Inc. |
| Sector: Consumer Staples | |
| SubSector: Paper & Paper Products | |
| MarketCap: 509.003 Millions | |
| Recent Price: 3.33 Market Intelligence Score: 30 | |
| Day Percent Change: 1.89% Day Change: 0.06 | |
| Week Change: 5.9% Year-to-date Change: -48.6% | |
| MERC Links: Profile News Message Board | |
| Charts:- Daily , Weekly | |
| Add MERC to Watchlist: View: Get Complete MERC Trend Analysis ➞ | |
 | NTR Nutrien Ltd. |
| Sector: Materials | |
| SubSector: Agricultural Chemicals | |
| MarketCap: 15897.9 Millions | |
| Recent Price: 57.62 Market Intelligence Score: 30 | |
| Day Percent Change: 1% Day Change: 0.57 | |
| Week Change: 1.23% Year-to-date Change: 31.4% | |
| NTR Links: Profile News Message Board | |
| Charts:- Daily , Weekly | |
| Add NTR to Watchlist: View: Get Complete NTR Trend Analysis ➞ | |
 | STKL SunOpta Inc. |
| Sector: Consumer Staples | |
| SubSector: Processed & Packaged Goods | |
| MarketCap: 174.548 Millions | |
| Recent Price: 6.27 Market Intelligence Score: 30 | |
| Day Percent Change: 0.98% Day Change: 0.06 | |
| Week Change: 0.65% Year-to-date Change: -19.9% | |
| STKL Links: Profile News Message Board | |
| Charts:- Daily , Weekly | |
| Add STKL to Watchlist: View: Get Complete STKL Trend Analysis ➞ | |
 | VIV Telefonica Brasil S.A. |
| Sector: Technology | |
| SubSector: Wireless Communications | |
| MarketCap: 19611.1 Millions | |
| Recent Price: 12.47 Market Intelligence Score: 30 | |
| Day Percent Change: 0.4% Day Change: 0.05 | |
| Week Change: 1.14% Year-to-date Change: 70.4% | |
| VIV Links: Profile News Message Board | |
| Charts:- Daily , Weekly | |
| Add VIV to Watchlist: View: Get Complete VIV Trend Analysis ➞ | |
 | BEP Brookfield Renewable Partners L.P. |
| Sector: Utilities | |
| SubSector: Diversified Utilities | |
| MarketCap: 6419.9 Millions | |
| Recent Price: 25.38 Market Intelligence Score: 30 | |
| Day Percent Change: 0.16% Day Change: 0.04 | |
| Week Change: 1.85% Year-to-date Change: 12.2% | |
| BEP Links: Profile News Message Board | |
| Charts:- Daily , Weekly | |
| Add BEP to Watchlist: View: Get Complete BEP Trend Analysis ➞ | |
 | TU TELUS Corporation |
| Sector: Technology | |
| SubSector: Wireless Communications | |
| MarketCap: 10864.7 Millions | |
| Recent Price: 16.49 Market Intelligence Score: 30 | |
| Day Percent Change: 0% Day Change: 0 | |
| Week Change: 1.78% Year-to-date Change: 26.6% | |
| TU Links: Profile News Message Board | |
| Charts:- Daily , Weekly | |
| Add TU to Watchlist: View: Get Complete TU Trend Analysis ➞ | |
 | TAC TransAlta Corporation |
| Sector: Utilities | |
| SubSector: Diversified Utilities | |
| MarketCap: 1487.8 Millions | |
| Recent Price: 12.30 Market Intelligence Score: 30 | |
| Day Percent Change: 0% Day Change: 0 | |
| Week Change: -1.52% Year-to-date Change: -12.2% | |
| TAC Links: Profile News Message Board | |
| Charts:- Daily , Weekly | |
| Add TAC to Watchlist: View: Get Complete TAC Trend Analysis ➞ | |
 | MFC Manulife Financial Corporation |
| Sector: Financials | |
| SubSector: Life Insurance | |
| MarketCap: 22188.7 Millions | |
| Recent Price: 30.75 Market Intelligence Score: 30 | |
| Day Percent Change: -0.07% Day Change: -0.02 | |
| Week Change: -1.73% Year-to-date Change: -0.1% | |
| MFC Links: Profile News Message Board | |
| Charts:- Daily , Weekly | |
| Add MFC to Watchlist: View: Get Complete MFC Trend Analysis ➞ | |
 | SUZ Suzano S.A. |
| Sector: Consumer Staples | |
| SubSector: Paper & Paper Products | |
| MarketCap: 7042.93 Millions | |
| Recent Price: 9.73 Market Intelligence Score: 30 | |
| Day Percent Change: -0.1% Day Change: -0.01 | |
| Week Change: -4.1% Year-to-date Change: -5.3% | |
| SUZ Links: Profile News Message Board | |
| Charts:- Daily , Weekly | |
| Add SUZ to Watchlist: View: Get Complete SUZ Trend Analysis ➞ | |
 | FTS Fortis Inc. |
| Sector: Utilities | |
| SubSector: Electric Utilities | |
| MarketCap: 14741.8 Millions | |
| Recent Price: 49.74 Market Intelligence Score: 30 | |
| Day Percent Change: -0.16% Day Change: -0.08 | |
| Week Change: 0.08% Year-to-date Change: 24.5% | |
| FTS Links: Profile News Message Board | |
| Charts:- Daily , Weekly | |
| Add FTS to Watchlist: View: Get Complete FTS Trend Analysis ➞ | |
 | BMA Banco Macro S.A. |
| Sector: Financials | |
| SubSector: Foreign Regional Banks | |
| MarketCap: 1769.99 Millions | |
| Recent Price: 57.93 Market Intelligence Score: 30 | |
| Day Percent Change: -0.35% Day Change: -0.23 | |
| Week Change: -5.03% Year-to-date Change: -31.1% | |
| BMA Links: Profile News Message Board | |
| Charts:- Daily , Weekly | |
| Add BMA to Watchlist: View: Get Complete BMA Trend Analysis ➞ | |
 | GIL Gildan Activewear Inc. |
| Sector: Consumer Staples | |
| SubSector: Textile - Apparel Clothing | |
| MarketCap: 2411.65 Millions | |
| Recent Price: 54.60 Market Intelligence Score: 30 | |
| Day Percent Change: -0.71% Day Change: -0.39 | |
| Week Change: -3.61% Year-to-date Change: 16.3% | |
| GIL Links: Profile News Message Board | |
| Charts:- Daily , Weekly | |
| Add GIL to Watchlist: View: Get Complete GIL Trend Analysis ➞ | |
 | BBDO Banco Bradesco S.A. |
| Sector: Financials | |
| SubSector: Foreign Regional Banks | |
| MarketCap: 27711.4 Millions | |
| Recent Price: 2.69 Market Intelligence Score: 30 | |
| Day Percent Change: -1.18% Day Change: -0.03 | |
| Week Change: -2.71% Year-to-date Change: 49.2% | |
| BBDO Links: Profile News Message Board | |
| Charts:- Daily , Weekly | |
| Add BBDO to Watchlist: View: Get Complete BBDO Trend Analysis ➞ | |
 | LULU Lululemon Athletica Inc. |
| Sector: Consumer Staples | |
| SubSector: Textile - Apparel Clothing | |
| MarketCap: 24627.8 Millions | |
| Recent Price: 199.14 Market Intelligence Score: 30 | |
| Day Percent Change: -1.51% Day Change: -3.06 | |
| Week Change: -1.51% Year-to-date Change: -51.9% | |
| LULU Links: Profile News Message Board | |
| Charts:- Daily , Weekly | |
| Add LULU to Watchlist: View: Get Complete LULU Trend Analysis ➞ | |
 | ABCL AbCellera Biologics Inc. |
| Sector: Health Care | |
| SubSector: Biotechnology | |
| MarketCap: 1870 Millions | |
| Recent Price: 4.18 Market Intelligence Score: 20 | |
| Day Percent Change: 3.12% Day Change: 0.13 | |
| Week Change: -4.44% Year-to-date Change: 46.8% | |
| ABCL Links: Profile News Message Board | |
| Charts:- Daily , Weekly | |
| Add ABCL to Watchlist: View: Get Complete ABCL Trend Analysis ➞ | |
 | DCBO Docebo Inc. |
| Sector: Technology | |
| SubSector: Software Application | |
| MarketCap: 15787 Millions | |
| Recent Price: 31.18 Market Intelligence Score: 20 | |
| Day Percent Change: 3.09% Day Change: 0.92 | |
| Week Change: -2.23% Year-to-date Change: -31.5% | |
| DCBO Links: Profile News Message Board | |
| Charts:- Daily , Weekly | |
| Add DCBO to Watchlist: View: Get Complete DCBO Trend Analysis ➞ | |
 | VERO Venus Concept Inc. |
| Sector: Health Care | |
| SubSector: Medical Appliances & Equipment | |
| MarketCap: 101.08 Millions | |
| Recent Price: 2.21 Market Intelligence Score: 20 | |
| Day Percent Change: 2.97% Day Change: 0.07 | |
| Week Change: -0.82% Year-to-date Change: -41.3% | |
| VERO Links: Profile News Message Board | |
| Charts:- Daily , Weekly | |
| Add VERO to Watchlist: View: Get Complete VERO Trend Analysis ➞ | |
 | TMQ Trilogy Metals Inc. |
| Sector: Materials | |
| SubSector: Industrial Metals & Minerals | |
| MarketCap: 151.21 Millions | |
| Recent Price: 1.69 Market Intelligence Score: 20 | |
| Day Percent Change: 0% Day Change: 0 | |
| Week Change: 5.77% Year-to-date Change: 42.2% | |
| TMQ Links: Profile News Message Board | |
| Charts:- Daily , Weekly | |
| Add TMQ to Watchlist: View: Get Complete TMQ Trend Analysis ➞ | |
 | AFYA Afya Limited |
| Sector: Services & Goods | |
| SubSector: Education & Training Services | |
| MarketCap: 1559.26 Millions | |
| Recent Price: 15.18 Market Intelligence Score: 20 | |
| Day Percent Change: -0.27% Day Change: -0.04 | |
| Week Change: -3.24% Year-to-date Change: -4.8% | |
| AFYA Links: Profile News Message Board | |
| Charts:- Daily , Weekly | |
| Add AFYA to Watchlist: View: Get Complete AFYA Trend Analysis ➞ | |
 | ELP Companhia Paranaense de Energia - COPEL |
| Sector: Utilities | |
| SubSector: Electric Utilities | |
| MarketCap: 3352.84 Millions | |
| Recent Price: 9.06 Market Intelligence Score: 20 | |
| Day Percent Change: -0.46% Day Change: -0.04 | |
| Week Change: -2.89% Year-to-date Change: 50.3% | |
| ELP Links: Profile News Message Board | |
| Charts:- Daily , Weekly | |
| Add ELP to Watchlist: View: Get Complete ELP Trend Analysis ➞ | |
 | BLDP Ballard Power Systems Inc. |
| Sector: Industrials | |
| SubSector: Industrial Electrical Equipment | |
| MarketCap: 2124.79 Millions | |
| Recent Price: 2.02 Market Intelligence Score: 20 | |
| Day Percent Change: -0.53% Day Change: -0.01 | |
| Week Change: 3.28% Year-to-date Change: 13.9% | |
| BLDP Links: Profile News Message Board | |
| Charts:- Daily , Weekly | |
| Add BLDP to Watchlist: View: Get Complete BLDP Trend Analysis ➞ | |
 | BAM Brookfield Asset Management Inc. |
| Sector: Financials | |
| SubSector: Real Estate Development | |
| MarketCap: 47134.9 Millions | |
| Recent Price: 60.16 Market Intelligence Score: 20 | |
| Day Percent Change: -0.61% Day Change: -0.36 | |
| Week Change: -4.99% Year-to-date Change: 10.6% | |
| BAM Links: Profile News Message Board | |
| Charts:- Daily , Weekly | |
| Add BAM to Watchlist: View: Get Complete BAM Trend Analysis ➞ | |
 | WPRT Westport Fuel Systems Inc. |
| Sector: Consumer Staples | |
| SubSector: Auto Parts | |
| MarketCap: 108.939 Millions | |
| Recent Price: 2.79 Market Intelligence Score: 20 | |
| Day Percent Change: -0.71% Day Change: -0.02 | |
| Week Change: -4.75% Year-to-date Change: -21.5% | |
| WPRT Links: Profile News Message Board | |
| Charts:- Daily , Weekly | |
| Add WPRT to Watchlist: View: Get Complete WPRT Trend Analysis ➞ | |
 | PROF Profound Medical Corp. |
| Sector: Materials | |
| SubSector: Industrial Metals & Minerals | |
| MarketCap: 121.41 Millions | |
| Recent Price: 4.47 Market Intelligence Score: 20 | |
| Day Percent Change: -0.86% Day Change: -0.04 | |
| Week Change: -16.97% Year-to-date Change: -38.8% | |
| PROF Links: Profile News Message Board | |
| Charts:- Daily , Weekly | |
| Add PROF to Watchlist: View: Get Complete PROF Trend Analysis ➞ | |
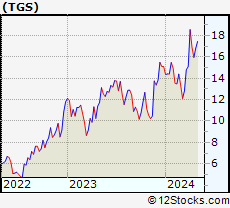 | TGS Transportadora de Gas del Sur S.A. |
| Sector: Utilities | |
| SubSector: Gas Utilities | |
| MarketCap: 514.177 Millions | |
| Recent Price: 27.16 Market Intelligence Score: 10 | |
| Day Percent Change: 3.27% Day Change: 0.89 | |
| Week Change: 0.11% Year-to-date Change: -3.9% | |
| TGS Links: Profile News Message Board | |
| Charts:- Daily , Weekly | |
| Add TGS to Watchlist: View: Get Complete TGS Trend Analysis ➞ | |
| To view more stocks, click on Next / Previous arrows or select different range: 0 - 25 , 25 - 50 , 50 - 75 , 75 - 100 , 100 - 125 , 125 - 150 , 150 - 175 , 175 - 200 , 200 - 225 | ||
| Click To Change The Sort Order: By Market Cap or Company Size Performance: Year-to-date, Week and Day | |
| Select Chart Type: | ||
 Best Stocks Today 12Stocks.com |
© 2025 12Stocks.com Terms & Conditions Privacy Contact Us
All Information Provided Only For Education And Not To Be Used For Investing or Trading. See Terms & Conditions


One More Thing ... Get Best Stocks Delivered Daily!
Never Ever Miss A Move With Our Top Ten Stocks Lists
Find Best Stocks In Any Market - Bull or Bear Market
Take A Peek At Our Top Ten Stocks Lists: Daily, Weekly, Year-to-Date & Top Trends
Find Best Stocks In Any Market - Bull or Bear Market
Take A Peek At Our Top Ten Stocks Lists: Daily, Weekly, Year-to-Date & Top Trends
Latin America Stocks With Best Up Trends [0-bearish to 100-bullish]: Gold Royalty[100], Alamos Gold[100], Vox Royalty[100], Endeavour Silver[100], Fortuna Silver[100], IAMGOLD [100], New Gold[100], New Found[100], Sandstorm Gold[100], McEwen Mining[100], SSR Mining[100]
Best Latin America Stocks Year-to-Date:
Dominion Diamond[207.43%], Gold Royalty[161.16%], SSR Mining[143.1%], New Gold[119.35%], Kinross Gold[111.46%], Vasta Platform[109.75%], Celestica [96.47%], Sandstorm Gold[95.03%], Inter & Co[86.91%], StoneCo [86.07%], NovaGold Resources[78.68%] Best Latin America Stocks This Week:
Dominion Diamond[33.17%], Nu [13.82%], Alamos Gold[9.37%], Novadaq [8%], New Gold[6.67%], Mercer [5.9%], BRF S.A[5.85%], Trilogy Metals[5.77%], IAMGOLD [5.75%], McEwen Mining[5.39%], SSR Mining[5.22%] Best Latin America Stocks Daily:
Dominion Diamond[28.83%], Bioceres Crop[8.89%], Gold Royalty[6.76%], Cronos [5.79%], Vision Marine[5.23%], Algoma Steel[5.05%], Alamos Gold[4.79%], Tilray [4.72%], Vox Royalty[4.72%], OrganiGram [4.67%], Braskem S.A[4.48%]