
 Login Sign Up


| |||||
 |  | ||||

| 12Stocks.com Market Intelligence |
Best Latin America Stocks
|
|
| Quick Read: Top Latin America Stocks By Performances & Trends: Daily, Weekly, Year-to-Date, Market Cap (Size) & Technical Trends | |||
| Best Latin America Views: Quick Browse View, Summary & Slide Show | |||
| 12Stocks.com Latin America Stocks Performances & Trends Daily | |||||||||
|
|  The overall market intelligence score is 40 (0-bearish to 100-bullish) which puts Latin America index in short term bearish to neutral trend. The market intelligence score from previous trading session is 50 and a deterioration of trend continues.
| ||||||||
Here are the market intelligence trend scores of the most requested Latin America stocks at 12Stocks.com (click stock name for detailed review):
| |||||||||||||||||||||||||
| Scroll down this page for most comprehensive review of Latin America stocks by performance, trends, technical analysis, charts, fund plays & more | |||||||||||||||||||||||||


| 12Stocks.com: Top Performing Latin America Index Stocks | ||||||||||||||||||||||||||||||||||||||||||||||||
 The top performing Latin America Index stocks year to date are
Now, more recently, over last week, the top performing Latin America Index stocks on the move are


|
||||||||||||||||||||||||||||||||||||||||||||||||
| 12Stocks.com: Investing in Latin America Index with Stocks | |
|
The following table helps investors and traders sort through current performance and trends (as measured by market intelligence score) of various
stocks in the Latin America Index. Quick View: Move mouse or cursor over stock symbol (ticker) to view short-term technical chart and over stock name to view long term chart. Click on  to add stock symbol to your watchlist and to add stock symbol to your watchlist and  to view watchlist. Click on any ticker or stock name for detailed market intelligence report for that stock. to view watchlist. Click on any ticker or stock name for detailed market intelligence report for that stock. |
12Stocks.com Performance of Stocks in Latin America Index
| Ticker | Stock Name | Watchlist | Category | Recent Price | Market Intelligence Score | Change % | YTD Change% |
| SLF | Sun Life |   | Financials | 60.14 | 70 | -0.07 | 4.18% |
| WILN | Wi-Lan | | Technology | 14.15 | 10 | -0.07 | 0.00% |
| VINP | Vi Compass | | Financials | 10.60 | 90 | -0.09 | 9.90% |
| FSV | FirstService Corp | | Financials | 187.77 | 10 | -0.12 | 5.31% |
| MFC | Manulife Financial | | Financials | 31.41 | 70 | -0.13 | 5.06% |
| BMO | Bank of Montreal | | Financials | 130.28 | 60 | -0.14 | 38.80% |
| CIO | City Office | | Financials | 6.94 | 20 | -0.14 | 35.50% |
| CIGI | Colliers | | Financials | 153.66 | 20 | -0.15 | 14.48% |
| PHYS | Sprott Physical | | Financials | 29.62 | 70 | -0.20 | 44.91% |
| PAC | Grupo Aeroportuario | | Industrials | 231.96 | 10 | -0.21 | 29.98% |
| VTMX | Corporacion Inmobiliaria | | Financials | 27.28 | 63 | -0.21 | 12.64% |
| PAAS | Pan American | | Materials | 39.19 | 70 | -0.23 | 84.96% |
| KL | Kirkland Lake | | Materials | 38.92 | 30 | -0.23 | 0.00% |
| FTS | Fortis | | Utilities | 50.28 | 50 | -0.24 | 23.84% |
| DCBO | Docebo | | Technology | 27.18 | 20 | -0.24 | -39.98% |
| ARLZ | Aralez | | Health Care | 30.62 | 60 | -0.26 | 0.00% |
| CORV | Correvio Pharma | | Health Care | 3.49 | 80 | -0.29 | 0.00% |
| PZE | Petrobras Argentina | | Energy | 66.65 | 70 | -0.31 | 0.00% |
| CLS | Celestica | | Technology | 250.91 | 90 | -0.31 | 169.59% |
| AGU | Agrium | | Materials | 16.91 | 10 | -0.35 | 0.00% |
| GG | Goldcorp | | Materials | 16.91 | 0 | -0.35 | 0.00% |
| SU | Suncor Energy | | Energy | 41.11 | 40 | -0.36 | 16.64% |
| BBU | Brookfield Business | | Industrials | 32.96 | 90 | -0.36 | 39.84% |
| BBRY | BlackBerry | | Technology | 15.81 | 0 | -0.38 | 0.00% |
| VERO | Venus Concept | | Health Care | 2.42 | 70 | -0.41 | -44.16% |
| To view more stocks, click on Next / Previous arrows or select different range: 0 - 25 , 25 - 50 , 50 - 75 , 75 - 100 , 100 - 125 , 125 - 150 , 150 - 175 , 175 - 200 , 200 - 225 , 225 - 250 , 250 - 275 , 275 - 300 , 300 - 325 | ||
 | Click To Change The Sort Order: By Market Cap or Company Size Performance: Year-to-date, Week and Day |  |
| Detailed Overview Of Latin America Stocks |
| Latin America Technical Overview, Leaders & Laggards, Top Latin America ETF Funds & Detailed Latin America Stocks List, Charts, Trends & More |
| Latin America: Technical Analysis, Trends & YTD Performance | |
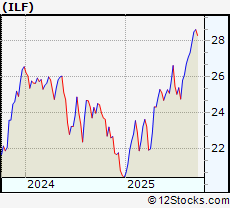
 ILF Weekly Chart |
|
| Long Term Trend: Very Good | |
| Medium Term Trend: Very Good | |
 ILF Daily Chart |
|
| Short Term Trend: Not Good | |
| Overall Trend Score: 40 | |
| YTD Performance: 37.1981% | |
| **Trend Scores & Views Are Only For Educational Purposes And Not For Investing | |
| 12Stocks.com: Investing in Latin America Index using Exchange Traded Funds | |
|
The following table shows list of key exchange traded funds (ETF) that
help investors play Latin America stock market. For detailed view, check out our ETF Funds section of our website. Quick View: Move mouse or cursor over ETF symbol (ticker) to view short-term technical chart and over ETF name to view long term chart. Click on ticker or stock name for detailed view. Click on to add stock symbol to your watchlist and to view watchlist. |
12Stocks.com List of ETFs that track Latin America Index
| Ticker | ETF Name | Watchlist | Recent Price | Market Intelligence Score | Change % | Week % | Year-to-date % |
| LBJ | Latin America Bull | | 60.40 | 50 | 0 | 0 | 0% |
| DBBR | Brazil Hedgd Eq | | 54.06 | 70 | -0.478645 | 0.632911 | 0% |
| FBZ | Brazil AlphaDEX | | 11.52 | 30 | 0 | 0 | 29.5955% |
| 12Stocks.com: Charts, Trends, Fundamental Data and Performances of Latin America Stocks | |
|
We now take in-depth look at all Latin America stocks including charts, multi-period performances and overall trends (as measured by market intelligence score). One can sort Latin America stocks (click link to choose) by Daily, Weekly and by Year-to-Date performances. Also, one can sort by size of the company or by market capitalization. |
| Select Your Default Chart Type: | |||||
| |||||
| Click on stock symbol or name for detailed view. Click on to add stock symbol to your watchlist and to view watchlist. Quick View: Move mouse or cursor over "Daily" to quickly view daily technical stock chart and over "Weekly" to view weekly technical stock chart. | |||||

 | SLF Sun Life Financial, Inc |
| Sector: Financials | |
| SubSector: Insurance - Diversified | |
| MarketCap: 32445.3 Millions | |
| Recent Price: 60.14 Market Intelligence Score: 70 | |
| Day Percent Change: -0.0664673% Day Change: -0.21 | |
| Week Change: 1.9322% Year-to-date Change: 4.2% | |
| SLF Links: Profile News Message Board | |
| Charts:- Daily , Weekly | |
| Add SLF to Watchlist: View: Get Complete SLF Trend Analysis ➞ | |
 | WILN Wi-Lan Inc. |
| Sector: Technology | |
| SubSector: Wireless Communications | |
| MarketCap: 211.06 Millions | |
| Recent Price: 14.15 Market Intelligence Score: 10 | |
| Day Percent Change: -0.0706215% Day Change: -9999 | |
| Week Change: -18.5377% Year-to-date Change: 0.0% | |
| WILN Links: Profile News Message Board | |
| Charts:- Daily , Weekly | |
| Add WILN to Watchlist: View: Get Complete WILN Trend Analysis ➞ | |
 | VINP Vinci Compass Investments Ltd |
| Sector: Financials | |
| SubSector: Asset Management | |
| MarketCap: 641.93 Millions | |
| Recent Price: 10.60 Market Intelligence Score: 90 | |
| Day Percent Change: -0.0942507% Day Change: -0.02 | |
| Week Change: 1.43541% Year-to-date Change: 9.9% | |
| VINP Links: Profile News Message Board | |
| Charts:- Daily , Weekly | |
| Add VINP to Watchlist: View: Get Complete VINP Trend Analysis ➞ | |
 | FSV FirstService Corp |
| Sector: Financials | |
| SubSector: Real Estate Services | |
| MarketCap: 9181.97 Millions | |
| Recent Price: 187.77 Market Intelligence Score: 10 | |
| Day Percent Change: -0.12234% Day Change: 0.11 | |
| Week Change: -1.71683% Year-to-date Change: 5.3% | |
| FSV Links: Profile News Message Board | |
| Charts:- Daily , Weekly | |
| Add FSV to Watchlist: View: Get Complete FSV Trend Analysis ➞ | |
 | MFC Manulife Financial Corp |
| Sector: Financials | |
| SubSector: Insurance - Life | |
| MarketCap: 52077.2 Millions | |
| Recent Price: 31.41 Market Intelligence Score: 70 | |
| Day Percent Change: -0.127186% Day Change: -0.35 | |
| Week Change: 1.42073% Year-to-date Change: 5.1% | |
| MFC Links: Profile News Message Board | |
| Charts:- Daily , Weekly | |
| Add MFC to Watchlist: View: Get Complete MFC Trend Analysis ➞ | |
 | BMO Bank of Montreal |
| Sector: Financials | |
| SubSector: Banks - Diversified | |
| MarketCap: 91053 Millions | |
| Recent Price: 130.28 Market Intelligence Score: 60 | |
| Day Percent Change: -0.137973% Day Change: -0.9 | |
| Week Change: 1.53534% Year-to-date Change: 38.8% | |
| BMO Links: Profile News Message Board | |
| Charts:- Daily , Weekly | |
| Add BMO to Watchlist: View: Get Complete BMO Trend Analysis ➞ | |
 | CIO City Office REIT Inc |
| Sector: Financials | |
| SubSector: REIT - Office | |
| MarketCap: 280.12 Millions | |
| Recent Price: 6.94 Market Intelligence Score: 20 | |
| Day Percent Change: -0.143885% Day Change: 0 | |
| Week Change: -0.143885% Year-to-date Change: 35.5% | |
| CIO Links: Profile News Message Board | |
| Charts:- Daily , Weekly | |
| Add CIO to Watchlist: View: Get Complete CIO Trend Analysis ➞ | |
 | CIGI Colliers International Group Inc |
| Sector: Financials | |
| SubSector: Real Estate Services | |
| MarketCap: 8395.83 Millions | |
| Recent Price: 153.66 Market Intelligence Score: 20 | |
| Day Percent Change: -0.146218% Day Change: -0.41 | |
| Week Change: -2.79307% Year-to-date Change: 14.5% | |
| CIGI Links: Profile News Message Board | |
| Charts:- Daily , Weekly | |
| Add CIGI to Watchlist: View: Get Complete CIGI Trend Analysis ➞ | |
 | PHYS Sprott Physical Gold Trust |
| Sector: Financials | |
| SubSector: Asset Management | |
| MarketCap: 12808.3 Millions | |
| Recent Price: 29.62 Market Intelligence Score: 70 | |
| Day Percent Change: -0.202156% Day Change: -0.29 | |
| Week Change: 3.34962% Year-to-date Change: 44.9% | |
| PHYS Links: Profile News Message Board | |
| Charts:- Daily , Weekly | |
| Add PHYS to Watchlist: View: Get Complete PHYS Trend Analysis ➞ | |
 | PAC Grupo Aeroportuario Del Pacifico SAB de CV ADR |
| Sector: Industrials | |
| SubSector: Airports & Air Services | |
| MarketCap: 10734.5 Millions | |
| Recent Price: 231.96 Market Intelligence Score: 10 | |
| Day Percent Change: -0.206505% Day Change: 0.31 | |
| Week Change: -5.76095% Year-to-date Change: 30.0% | |
| PAC Links: Profile News Message Board | |
| Charts:- Daily , Weekly | |
| Add PAC to Watchlist: View: Get Complete PAC Trend Analysis ➞ | |
 | VTMX Corporacion Inmobiliaria Vesta Sab ADR |
| Sector: Financials | |
| SubSector: Real Estate - Development | |
| MarketCap: 2490.41 Millions | |
| Recent Price: 27.28 Market Intelligence Score: 63 | |
| Day Percent Change: -0.21% Day Change: -0.06 | |
| Week Change: -1.3% Year-to-date Change: 12.6% | |
| VTMX Links: Profile News Message Board | |
| Charts:- Daily , Weekly | |
| Add VTMX to Watchlist: View: Get Complete VTMX Trend Analysis ➞ | |
 | PAAS Pan American Silver Corp |
| Sector: Materials | |
| SubSector: Gold | |
| MarketCap: 12518.3 Millions | |
| Recent Price: 39.19 Market Intelligence Score: 70 | |
| Day Percent Change: -0.229124% Day Change: -1.55 | |
| Week Change: 7.69442% Year-to-date Change: 85.0% | |
| PAAS Links: Profile News Message Board | |
| Charts:- Daily , Weekly | |
| Add PAAS to Watchlist: View: Get Complete PAAS Trend Analysis ➞ | |
 | KL Kirkland Lake Gold Ltd. |
| Sector: Materials | |
| SubSector: Gold | |
| MarketCap: 7317.39 Millions | |
| Recent Price: 38.92 Market Intelligence Score: 30 | |
| Day Percent Change: -0.23071% Day Change: -9999 | |
| Week Change: 3.31829% Year-to-date Change: 0.0% | |
| KL Links: Profile News Message Board | |
| Charts:- Daily , Weekly | |
| Add KL to Watchlist: View: Get Complete KL Trend Analysis ➞ | |
 | FTS Fortis Inc |
| Sector: Utilities | |
| SubSector: Utilities - Regulated Electric | |
| MarketCap: 24792.2 Millions | |
| Recent Price: 50.28 Market Intelligence Score: 50 | |
| Day Percent Change: -0.238095% Day Change: -0.19 | |
| Week Change: 1.61681% Year-to-date Change: 23.8% | |
| FTS Links: Profile News Message Board | |
| Charts:- Daily , Weekly | |
| Add FTS to Watchlist: View: Get Complete FTS Trend Analysis ➞ | |
 | DCBO Docebo Inc |
| Sector: Technology | |
| SubSector: Software - Application | |
| MarketCap: 923.86 Millions | |
| Recent Price: 27.18 Market Intelligence Score: 20 | |
| Day Percent Change: -0.238532% Day Change: 0.92 | |
| Week Change: -6.64492% Year-to-date Change: -40.0% | |
| DCBO Links: Profile News Message Board | |
| Charts:- Daily , Weekly | |
| Add DCBO to Watchlist: View: Get Complete DCBO Trend Analysis ➞ | |
 | ARLZ Aralez Pharmaceuticals Inc. |
| Sector: Health Care | |
| SubSector: Biotechnology | |
| MarketCap: 155.5 Millions | |
| Recent Price: 30.62 Market Intelligence Score: 60 | |
| Day Percent Change: -0.260586% Day Change: -9999 | |
| Week Change: 3.16712% Year-to-date Change: 0.0% | |
| ARLZ Links: Profile News Message Board | |
| Charts:- Daily , Weekly | |
| Add ARLZ to Watchlist: View: Get Complete ARLZ Trend Analysis ➞ | |
 | CORV Correvio Pharma Corp. |
| Sector: Health Care | |
| SubSector: Drug Manufacturers - Other | |
| MarketCap: 20.5033 Millions | |
| Recent Price: 3.49 Market Intelligence Score: 80 | |
| Day Percent Change: -0.285714% Day Change: -9999 | |
| Week Change: 85.6383% Year-to-date Change: 0.0% | |
| CORV Links: Profile News Message Board | |
| Charts:- Daily , Weekly | |
| Add CORV to Watchlist: View: Get Complete CORV Trend Analysis ➞ | |
 | PZE Petrobras Argentina S.A. |
| Sector: Energy | |
| SubSector: Major Integrated Oil & Gas | |
| MarketCap: 1973.47 Millions | |
| Recent Price: 66.65 Market Intelligence Score: 70 | |
| Day Percent Change: -0.314089% Day Change: -9999 | |
| Week Change: 21.7796% Year-to-date Change: 0.0% | |
| PZE Links: Profile News Message Board | |
| Charts:- Daily , Weekly | |
| Add PZE to Watchlist: View: Get Complete PZE Trend Analysis ➞ | |
 | CLS Celestica, Inc |
| Sector: Technology | |
| SubSector: Electronic Components | |
| MarketCap: 27915.5 Millions | |
| Recent Price: 250.91 Market Intelligence Score: 90 | |
| Day Percent Change: -0.309905% Day Change: 0.23 | |
| Week Change: 4.34584% Year-to-date Change: 169.6% | |
| CLS Links: Profile News Message Board | |
| Charts:- Daily , Weekly | |
| Add CLS to Watchlist: View: Get Complete CLS Trend Analysis ➞ | |
 | AGU Agrium Inc. |
| Sector: Materials | |
| SubSector: Agricultural Chemicals | |
| MarketCap: 13316.7 Millions | |
| Recent Price: 16.91 Market Intelligence Score: 10 | |
| Day Percent Change: -0.353565% Day Change: -9999 | |
| Week Change: -37.808% Year-to-date Change: 0.0% | |
| AGU Links: Profile News Message Board | |
| Charts:- Daily , Weekly | |
| Add AGU to Watchlist: View: Get Complete AGU Trend Analysis ➞ | |
 | GG Goldcorp Inc. |
| Sector: Materials | |
| SubSector: Gold | |
| MarketCap: 13240.7 Millions | |
| Recent Price: 16.91 Market Intelligence Score: 0 | |
| Day Percent Change: -0.353565% Day Change: -9999 | |
| Week Change: -37.808% Year-to-date Change: 0.0% | |
| GG Links: Profile News Message Board | |
| Charts:- Daily , Weekly | |
| Add GG to Watchlist: View: Get Complete GG Trend Analysis ➞ | |
 | SU Suncor Energy, Inc |
| Sector: Energy | |
| SubSector: Oil & Gas Integrated | |
| MarketCap: 48493.6 Millions | |
| Recent Price: 41.11 Market Intelligence Score: 40 | |
| Day Percent Change: -0.363548% Day Change: -0.07 | |
| Week Change: -3.06531% Year-to-date Change: 16.6% | |
| SU Links: Profile News Message Board | |
| Charts:- Daily , Weekly | |
| Add SU to Watchlist: View: Get Complete SU Trend Analysis ➞ | |
 | BBU Brookfield Business Partners L.P |
| Sector: Industrials | |
| SubSector: Conglomerates | |
| MarketCap: 2444.54 Millions | |
| Recent Price: 32.96 Market Intelligence Score: 90 | |
| Day Percent Change: -0.362757% Day Change: -0.17 | |
| Week Change: 15.7303% Year-to-date Change: 39.8% | |
| BBU Links: Profile News Message Board | |
| Charts:- Daily , Weekly | |
| Add BBU to Watchlist: View: Get Complete BBU Trend Analysis ➞ | |
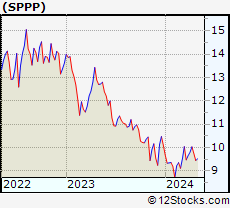 | SPPP Sprott Physical Platinum and Palladium Trust |
| Sector: Financials | |
| SubSector: Asset Management | |
| MarketCap: Millions | |
| Recent Price: 13.52 Market Intelligence Score: 60 | |
| Day Percent Change: -0.36846% Day Change: 0.08 | |
| Week Change: 4.56303% Year-to-date Change: 50.2% | |
| SPPP Links: Profile News Message Board | |
| Charts:- Daily , Weekly | |
| Add SPPP to Watchlist: View: Get Complete SPPP Trend Analysis ➞ | |
 | BBRY BlackBerry Limited |
| Sector: Technology | |
| SubSector: Diversified Communication Services | |
| MarketCap: 3755.71 Millions | |
| Recent Price: 15.81 Market Intelligence Score: 0 | |
| Day Percent Change: -0.378072% Day Change: -9999 | |
| Week Change: -54.9316% Year-to-date Change: 0.0% | |
| BBRY Links: Profile News Message Board | |
| Charts:- Daily , Weekly | |
| Add BBRY to Watchlist: View: Get Complete BBRY Trend Analysis ➞ | |
| To view more stocks, click on Next / Previous arrows or select different range: 0 - 25 , 25 - 50 , 50 - 75 , 75 - 100 , 100 - 125 , 125 - 150 , 150 - 175 , 175 - 200 , 200 - 225 , 225 - 250 , 250 - 275 , 275 - 300 , 300 - 325 | ||
| Click To Change The Sort Order: By Market Cap or Company Size Performance: Year-to-date, Week and Day | |
| Select Chart Type: | ||
 Best Stocks Today 12Stocks.com |
© 2025 12Stocks.com Terms & Conditions Privacy Contact Us
All Information Provided Only For Education And Not To Be Used For Investing or Trading. See Terms & Conditions


One More Thing ... Get Best Stocks Delivered Daily!
Never Ever Miss A Move With Our Top Ten Stocks Lists
Find Best Stocks In Any Market - Bull or Bear Market
Take A Peek At Our Top Ten Stocks Lists: Daily, Weekly, Year-to-Date & Top Trends
Find Best Stocks In Any Market - Bull or Bear Market
Take A Peek At Our Top Ten Stocks Lists: Daily, Weekly, Year-to-Date & Top Trends
Latin America Stocks With Best Up Trends [0-bearish to 100-bullish]: Milestone [100], BRP [100], Turquoise Hill[100], Canada Goose[100], Canadian Solar[100], Nevsun Resources[100], Iamgold Corp[100], Bellatrix Exploration[100], Silvercorp Metals[100], Gerdau S.A.[100], Crescent Point[100]
Best Latin America Stocks Year-to-Date:
Americas Gold[892.308%], Avino Silver[437.523%], Tower[254.565%], Gold Royalty[206.452%], EMX Royalty[189.655%], New Gold[180.534%], Celestica [169.593%], Kinross Gold[153.727%], Iamgold Corp[138.172%], Lithium Americas[124.183%], Vasta Platform[119.556%] Best Latin America Stocks This Week:
Companhia Brasileira[18587.4%], Cosan [16415.2%], Crescent Point[4066.17%], Golden Star[1837.95%], Grupo Financiero[1283.52%], Alexco Resource[690.301%], Yamana Gold[625.812%], Novelion [579.167%], Turquoise Hill[433.11%], Enerplus [415.601%], Nevsun Resources[402.516%] Best Latin America Stocks Daily:
Novelion [7.37813%], Ambipar Emergency[6.89655%], Grupo Supervielle[6.39659%], Milestone [6.34146%], Nutrien [5.50945%], Grupo Financiero[4.91926%], Mitel Networks[4.5045%], BRP [4.30981%], Empresa Distribuidora[4.06396%], Pampa Energia[4.0515%], Loma Negra[3.92707%]