
 Login Sign Up


| |||||
 |  | ||||

| 12Stocks.com Market Intelligence |
Best Healthcare Stocks
 | "Discover best trending healthcare stocks with 12Stocks.com." |
| - Subu Vdaygiri, Founder, 12Stocks.com |
| In a hurry? Healthcare Stocks Lists: Performance Trends Table, Stock Charts
Sort Healthcare stocks: Daily, Weekly, Year-to-Date, Market Cap & Trends. Filter Healthcare stocks list by size:All Healthcare Large Mid-Range Small |
| 12Stocks.com Healthcare Stocks Performances & Trends Daily | |||||||||
|
|  The overall Smart Investing & Trading Score is 57 (0-bearish to 100-bullish) which puts Healthcare sector in short term neutral trend. The Smart Investing & Trading Score from previous trading session is 60 and hence a deterioration of trend.
| ||||||||
Here are the Smart Investing & Trading Scores of the most requested Healthcare stocks at 12Stocks.com (click stock name for detailed review):
|


| 12Stocks.com: Investing in Healthcare sector with Stocks | |
|
The following table helps investors and traders sort through current performance and trends (as measured by Smart Investing & Trading Score) of various
stocks in the Healthcare sector. Quick View: Move mouse or cursor over stock symbol (ticker) to view short-term Technical chart and over stock name to view long term chart. Click on  to add stock symbol to your watchlist and to add stock symbol to your watchlist and  to view watchlist. Click on any ticker or stock name for detailed market intelligence report for that stock. to view watchlist. Click on any ticker or stock name for detailed market intelligence report for that stock. |
12Stocks.com Performance of Stocks in Healthcare Sector
| Ticker | Stock Name | Watchlist | Category | Recent Price | Smart Investing & Trading Score | Change % | YTD Change% |
| PHVS | Pharvaris N.V |   | Biotechnology | 24.38 | 83 | -0.87 | -13.95% |
| PBH | Prestige Consumer | | Equipment | 71.12 | 75 | -0.89 | 16.17% |
| MOH | Molina | | Insurance | 338.87 | 10 | -0.94 | -6.21% |
| CLLS | Cellectis S.A | | Biotechnology | 2.54 | 35 | -0.94 | -17.66% |
| PODD | Insulet | | Instruments | 170.27 | 85 | -0.97 | -21.53% |
| BNR | Burning Rock | | Diagnostics & Research | 0.75 | 8 | -0.97 | -22.50% |
| FENC | Fennec | | Biotechnology | 9.09 | 10 | -0.98 | -18.98% |
| CMPS | COMPASS Pathways | | Medical Care Facilities | 8.48 | 54 | -1.05 | -2.97% |
| PRLD | Prelude | | Biotechnology | 3.73 | 15 | -1.06 | -14.25% |
| HYPR | Hyperfine | | Medical Devices | 0.80 | 10 | -1.10 | -29.11% |
| CNC | Centene | | Insurance | 72.25 | 15 | -1.11 | -2.64% |
| FBIO | Fortress Biotech | | Biotechnology | 1.74 | 35 | -1.14 | -42.19% |
| DXCM | DexCom | | Laboratories | 125.88 | 51 | -1.19 | 1.44% |
| MPLN | MultiPlan | | Healthcare Plans | 0.64 | 47 | -1.23 | -55.43% |
| RANI | Rani | | Biotechnology | 6.30 | 56 | -1.25 | 90.91% |
| ACHC | Acadia | | Specialized | 72.99 | 25 | -1.28 | -6.13% |
| SGRY | Surgery Partners | | Hospitals | 24.63 | 23 | -1.28 | -23.01% |
| ENTA | Enanta | | Biotechnology | 13.56 | 49 | -1.31 | 44.10% |
| TNDM | Tandem Diabetes | | Instruments | 36.20 | 78 | -1.34 | 22.38% |
| TNXP | Tonix | | Biotechnology | 0.18 | 22 | -1.34 | -56.08% |
| XFOR | X4 | | Biotechnology | 1.11 | 41 | -1.34 | 31.78% |
| PIRS | Pieris | | Biotechnology | 11.68 | 76 | -1.35 | NA |
| SEM | Select | | Hospitals | 27.98 | 83 | -1.37 | 19.06% |
| OCS | Oculis Holding | | Biotechnology | 12.89 | 90 | -1.38 | 16.12% |
| AIRS | AirSculpt Technologies | | Medical Care Facilities | 5.54 | 25 | -1.51 | -26.10% |
| For chart view version of above stock list: Chart View ➞ 0 - 25 , 25 - 50 , 50 - 75 , 75 - 100 , 100 - 125 , 125 - 150 , 150 - 175 , 175 - 200 , 200 - 225 , 225 - 250 , 250 - 275 , 275 - 300 , 300 - 325 , 325 - 350 , 350 - 375 , 375 - 400 , 400 - 425 , 425 - 450 , 450 - 475 , 475 - 500 , 500 - 525 , 525 - 550 , 550 - 575 , 575 - 600 , 600 - 625 , 625 - 650 , 650 - 675 , 675 - 700 , 700 - 725 | ||
 | Click To Change The Sort Order: By Market Cap or Company Size Performance: Year-to-date, Week and Day |  |
|
Get the most comprehensive stock market coverage daily at 12Stocks.com ➞ Best Stocks Today ➞ Best Stocks Weekly ➞ Best Stocks Year-to-Date ➞ Best Stocks Trends ➞  Best Stocks Today 12Stocks.com Best Nasdaq Stocks ➞ Best S&P 500 Stocks ➞ Best Tech Stocks ➞ Best Biotech Stocks ➞ |
| Detailed Overview of Healthcare Stocks |
| Healthcare Technical Overview, Leaders & Laggards, Top Healthcare ETF Funds & Detailed Healthcare Stocks List, Charts, Trends & More |
| Healthcare Sector: Technical Analysis, Trends & YTD Performance | |
| Healthcare sector is composed of stocks
from pharmaceutical, biotech, diagnostics labs, insurance providers
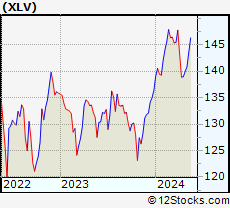
and healthcare services. Healthcare sector, as represented by XLV, an exchange-traded fund [ETF] that holds basket of Healthcare stocks (e.g, Merck, Amgen) is up by 3.08% and is currently underperforming the overall market by -1.46% year-to-date. Below is a quick view of Technical charts and trends: |
|
 XLV Weekly Chart |
|
| Long Term Trend: Not Good | |
| Medium Term Trend: Good | |
 XLV Daily Chart |
|
| Short Term Trend: Very Good | |
| Overall Trend Score: 57 | |
| YTD Performance: 3.08% | |
| **Trend Scores & Views Are Only For Educational Purposes And Not For Investing | |
| 12Stocks.com: Top Performing Healthcare Sector Stocks | ||||||||||||||||||||||||||||||||||||||||||||||||
 The top performing Healthcare sector stocks year to date are
Now, more recently, over last week, the top performing Healthcare sector stocks on the move are


|
||||||||||||||||||||||||||||||||||||||||||||||||
| 12Stocks.com: Investing in Healthcare Sector using Exchange Traded Funds | |
|
The following table shows list of key exchange traded funds (ETF) that
help investors track Healthcare Index. For detailed view, check out our ETF Funds section of our website. Quick View: Move mouse or cursor over ETF symbol (ticker) to view short-term Technical chart and over ETF name to view long term chart. Click on ticker or stock name for detailed view. Click on to add stock symbol to your watchlist and to view watchlist. |
12Stocks.com List of ETFs that track Healthcare Index
| Ticker | ETF Name | Watchlist | Recent Price | Smart Investing & Trading Score | Change % | Week % | Year-to-date % |
| XLV | Health Care | | 140.58 | 57 | 0.18 | 0.44 | 3.08% |
| XBI | Biotech | | 87.33 | 49 | 3.20 | 4.6 | -2.2% |
| IBB | Biotechnology | | 129.49 | 57 | 2.02 | 2.37 | -4.68% |
| BBH | Biotech | | 158.64 | 57 | 1.41 | 1.92 | -4.03% |
| VHT | Health Care | | 257.28 | 57 | 0.48 | 0.77 | 2.62% |
| IYH | Healthcare | | 59.18 | 64 | 0.59 | 0.97 | 3.37% |
| IHF | Healthcare Providers | | 51.44 | 15 | -0.77 | -0.92 | -2.04% |
| IHI | Medical Devices | | 55.02 | 7 | 0.02 | -0.92 | 1.95% |
| BIB | Biotechnology | | 52.58 | 64 | 4.43 | 5.88 | -7.84% |
| BIS | Short Biotech | | 19.11 | 36 | -3.68 | -5.49 | 5.76% |
| XHE | Health Care Equipment | | 83.91 | 67 | 2.20 | 1.8 | -0.41% |
| CURE | Healthcare Bull 3X | | 106.56 | 64 | 0.61 | 1.19 | 4.74% |
| LABU | Biotech Bull 3X | | 99.81 | 49 | 9.84 | 14.06 | -18.17% |
| LABD | Biotech Bear 3X | | 9.03 | 49 | -10.24 | -14.16 | -6.81% |
| PSCH | SmallCap Health Care | | 41.50 | 57 | 1.34 | 1.97 | -3.04% |
| XHS | Health Care Services | | 88.31 | 25 | -0.42 | 0.5 | -0.72% |
| PTH | DWA Healthcare Momentum | | 41.27 | 49 | 1.93 | 3.46 | 5.44% |
| BTEC | Principal Healthcare Innovators | | 35.90 | 62 | 3.60 | 4.81 | -1.19% |
| RXL | Health Care | | 95.32 | 57 | 0.34 | 0.52 | 4.29% |
| RXD | Short Health Care | | 11.36 | 61 | 0.01 | -0.78 | -4.73% |
| 12Stocks.com: Charts, Trends, Fundamental Data and Performances of Healthcare Stocks | |
|
We now take in-depth look at all Healthcare stocks including charts, multi-period performances and overall trends (as measured by Smart Investing & Trading Score). One can sort Healthcare stocks (click link to choose) by Daily, Weekly and by Year-to-Date performances. Also, one can sort by size of the company or by market capitalization. |
| Select Your Default Chart Type: | |||||
| |||||
| Click on stock symbol or name for detailed view. Click on to add stock symbol to your watchlist and to view watchlist. Quick View: Move mouse or cursor over "Daily" to quickly view daily Technical stock chart and over "Weekly" to view weekly Technical stock chart. | |||||

 | PHVS Pharvaris N.V. |
| Sector: Health Care | |
| SubSector: Biotechnology | |
| MarketCap: 475 Millions | |
| Recent Price: 24.38 Smart Investing & Trading Score: 83 | |
| Day Percent Change: -0.87% Day Change: -0.21 | |
| Week Change: 4.39% Year-to-date Change: -14.0% | |
| PHVS Links: Profile News Message Board | |
| Charts:- Daily , Weekly | |
| Add PHVS to Watchlist: View: Get Complete PHVS Trend Analysis ➞ | |
 | PBH Prestige Consumer Healthcare Inc. |
| Sector: Health Care | |
| SubSector: Medical Appliances & Equipment | |
| MarketCap: 1639.6 Millions | |
| Recent Price: 71.12 Smart Investing & Trading Score: 75 | |
| Day Percent Change: -0.89% Day Change: -0.64 | |
| Week Change: 0.92% Year-to-date Change: 16.2% | |
| PBH Links: Profile News Message Board | |
| Charts:- Daily , Weekly | |
| Add PBH to Watchlist: View: Get Complete PBH Trend Analysis ➞ | |
 | MOH Molina Healthcare, Inc. |
| Sector: Health Care | |
| SubSector: Health Care Plans | |
| MarketCap: 7235.6 Millions | |
| Recent Price: 338.87 Smart Investing & Trading Score: 10 | |
| Day Percent Change: -0.94% Day Change: -3.23 | |
| Week Change: -0.98% Year-to-date Change: -6.2% | |
| MOH Links: Profile News Message Board | |
| Charts:- Daily , Weekly | |
| Add MOH to Watchlist: View: Get Complete MOH Trend Analysis ➞ | |
 | CLLS Cellectis S.A. |
| Sector: Health Care | |
| SubSector: Biotechnology | |
| MarketCap: 398.685 Millions | |
| Recent Price: 2.54 Smart Investing & Trading Score: 35 | |
| Day Percent Change: -0.94% Day Change: -0.02 | |
| Week Change: 1.2% Year-to-date Change: -17.7% | |
| CLLS Links: Profile News Message Board | |
| Charts:- Daily , Weekly | |
| Add CLLS to Watchlist: View: Get Complete CLLS Trend Analysis ➞ | |
 | PODD Insulet Corporation |
| Sector: Health Care | |
| SubSector: Medical Instruments & Supplies | |
| MarketCap: 9313.2 Millions | |
| Recent Price: 170.27 Smart Investing & Trading Score: 85 | |
| Day Percent Change: -0.97% Day Change: -1.67 | |
| Week Change: 2.46% Year-to-date Change: -21.5% | |
| PODD Links: Profile News Message Board | |
| Charts:- Daily , Weekly | |
| Add PODD to Watchlist: View: Get Complete PODD Trend Analysis ➞ | |
 | BNR Burning Rock Biotech Limited |
| Sector: Health Care | |
| SubSector: Diagnostics & Research | |
| MarketCap: 27887 Millions | |
| Recent Price: 0.75 Smart Investing & Trading Score: 8 | |
| Day Percent Change: -0.97% Day Change: -0.01 | |
| Week Change: -12.02% Year-to-date Change: -22.5% | |
| BNR Links: Profile News Message Board | |
| Charts:- Daily , Weekly | |
| Add BNR to Watchlist: View: Get Complete BNR Trend Analysis ➞ | |
 | FENC Fennec Pharmaceuticals Inc. |
| Sector: Health Care | |
| SubSector: Biotechnology | |
| MarketCap: 126.785 Millions | |
| Recent Price: 9.09 Smart Investing & Trading Score: 10 | |
| Day Percent Change: -0.98% Day Change: -0.09 | |
| Week Change: -1.3% Year-to-date Change: -19.0% | |
| FENC Links: Profile News Message Board | |
| Charts:- Daily , Weekly | |
| Add FENC to Watchlist: View: Get Complete FENC Trend Analysis ➞ | |
 | CMPS COMPASS Pathways plc |
| Sector: Health Care | |
| SubSector: Medical Care Facilities | |
| MarketCap: 19587 Millions | |
| Recent Price: 8.48 Smart Investing & Trading Score: 54 | |
| Day Percent Change: -1.05% Day Change: -0.09 | |
| Week Change: 6.8% Year-to-date Change: -3.0% | |
| CMPS Links: Profile News Message Board | |
| Charts:- Daily , Weekly | |
| Add CMPS to Watchlist: View: Get Complete CMPS Trend Analysis ➞ | |
 | PRLD Prelude Therapeutics Incorporated |
| Sector: Health Care | |
| SubSector: Biotechnology | |
| MarketCap: 26087 Millions | |
| Recent Price: 3.73 Smart Investing & Trading Score: 15 | |
| Day Percent Change: -1.06% Day Change: -0.04 | |
| Week Change: -8.35% Year-to-date Change: -14.3% | |
| PRLD Links: Profile News Message Board | |
| Charts:- Daily , Weekly | |
| Add PRLD to Watchlist: View: Get Complete PRLD Trend Analysis ➞ | |
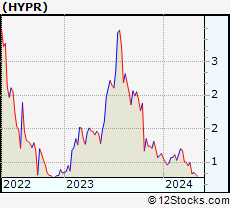 | HYPR Hyperfine, Inc. |
| Sector: Health Care | |
| SubSector: Medical Devices | |
| MarketCap: 154 Millions | |
| Recent Price: 0.80 Smart Investing & Trading Score: 10 | |
| Day Percent Change: -1.10% Day Change: -0.01 | |
| Week Change: -5.2% Year-to-date Change: -29.1% | |
| HYPR Links: Profile News Message Board | |
| Charts:- Daily , Weekly | |
| Add HYPR to Watchlist: View: Get Complete HYPR Trend Analysis ➞ | |
 | CNC Centene Corporation |
| Sector: Health Care | |
| SubSector: Health Care Plans | |
| MarketCap: 29075 Millions | |
| Recent Price: 72.25 Smart Investing & Trading Score: 15 | |
| Day Percent Change: -1.11% Day Change: -0.81 | |
| Week Change: -2.36% Year-to-date Change: -2.6% | |
| CNC Links: Profile News Message Board | |
| Charts:- Daily , Weekly | |
| Add CNC to Watchlist: View: Get Complete CNC Trend Analysis ➞ | |
 | FBIO Fortress Biotech, Inc. |
| Sector: Health Care | |
| SubSector: Biotechnology | |
| MarketCap: 116.885 Millions | |
| Recent Price: 1.74 Smart Investing & Trading Score: 35 | |
| Day Percent Change: -1.14% Day Change: -0.02 | |
| Week Change: 1.16% Year-to-date Change: -42.2% | |
| FBIO Links: Profile News Message Board | |
| Charts:- Daily , Weekly | |
| Add FBIO to Watchlist: View: Get Complete FBIO Trend Analysis ➞ | |
 | DXCM DexCom, Inc. |
| Sector: Health Care | |
| SubSector: Medical Laboratories & Research | |
| MarketCap: 19559 Millions | |
| Recent Price: 125.88 Smart Investing & Trading Score: 51 | |
| Day Percent Change: -1.19% Day Change: -1.51 | |
| Week Change: 1.24% Year-to-date Change: 1.4% | |
| DXCM Links: Profile News Message Board | |
| Charts:- Daily , Weekly | |
| Add DXCM to Watchlist: View: Get Complete DXCM Trend Analysis ➞ | |
 | MPLN MultiPlan Corporation |
| Sector: Health Care | |
| SubSector: Healthcare Plans | |
| MarketCap: 56087 Millions | |
| Recent Price: 0.64 Smart Investing & Trading Score: 47 | |
| Day Percent Change: -1.23% Day Change: -0.01 | |
| Week Change: 11.52% Year-to-date Change: -55.4% | |
| MPLN Links: Profile News Message Board | |
| Charts:- Daily , Weekly | |
| Add MPLN to Watchlist: View: Get Complete MPLN Trend Analysis ➞ | |
 | RANI Rani Therapeutics Holdings, Inc. |
| Sector: Health Care | |
| SubSector: Biotechnology | |
| MarketCap: 202 Millions | |
| Recent Price: 6.30 Smart Investing & Trading Score: 56 | |
| Day Percent Change: -1.25% Day Change: -0.08 | |
| Week Change: -5.69% Year-to-date Change: 90.9% | |
| RANI Links: Profile News Message Board | |
| Charts:- Daily , Weekly | |
| Add RANI to Watchlist: View: Get Complete RANI Trend Analysis ➞ | |
 | ACHC Acadia Healthcare Company, Inc. |
| Sector: Health Care | |
| SubSector: Specialized Health Services | |
| MarketCap: 1331.56 Millions | |
| Recent Price: 72.99 Smart Investing & Trading Score: 25 | |
| Day Percent Change: -1.28% Day Change: -0.95 | |
| Week Change: -0.82% Year-to-date Change: -6.1% | |
| ACHC Links: Profile News Message Board | |
| Charts:- Daily , Weekly | |
| Add ACHC to Watchlist: View: Get Complete ACHC Trend Analysis ➞ | |
 | SGRY Surgery Partners, Inc. |
| Sector: Health Care | |
| SubSector: Hospitals | |
| MarketCap: 328.446 Millions | |
| Recent Price: 24.63 Smart Investing & Trading Score: 23 | |
| Day Percent Change: -1.28% Day Change: -0.32 | |
| Week Change: 0.33% Year-to-date Change: -23.0% | |
| SGRY Links: Profile News Message Board | |
| Charts:- Daily , Weekly | |
| Add SGRY to Watchlist: View: Get Complete SGRY Trend Analysis ➞ | |
 | ENTA Enanta Pharmaceuticals, Inc. |
| Sector: Health Care | |
| SubSector: Biotechnology | |
| MarketCap: 998.385 Millions | |
| Recent Price: 13.56 Smart Investing & Trading Score: 49 | |
| Day Percent Change: -1.31% Day Change: -0.18 | |
| Week Change: 9.62% Year-to-date Change: 44.1% | |
| ENTA Links: Profile News Message Board | |
| Charts:- Daily , Weekly | |
| Add ENTA to Watchlist: View: Get Complete ENTA Trend Analysis ➞ | |
 | TNDM Tandem Diabetes Care, Inc. |
| Sector: Health Care | |
| SubSector: Medical Instruments & Supplies | |
| MarketCap: 3359.1 Millions | |
| Recent Price: 36.20 Smart Investing & Trading Score: 78 | |
| Day Percent Change: -1.34% Day Change: -0.49 | |
| Week Change: 2.72% Year-to-date Change: 22.4% | |
| TNDM Links: Profile News Message Board | |
| Charts:- Daily , Weekly | |
| Add TNDM to Watchlist: View: Get Complete TNDM Trend Analysis ➞ | |
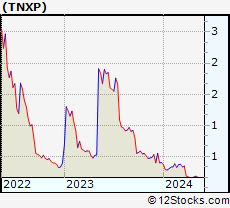 | TNXP Tonix Pharmaceuticals Holding Corp. |
| Sector: Health Care | |
| SubSector: Biotechnology | |
| MarketCap: 52.4785 Millions | |
| Recent Price: 0.18 Smart Investing & Trading Score: 22 | |
| Day Percent Change: -1.34% Day Change: 0.00 | |
| Week Change: 5.04% Year-to-date Change: -56.1% | |
| TNXP Links: Profile News Message Board | |
| Charts:- Daily , Weekly | |
| Add TNXP to Watchlist: View: Get Complete TNXP Trend Analysis ➞ | |
 | XFOR X4 Pharmaceuticals, Inc. |
| Sector: Health Care | |
| SubSector: Biotechnology | |
| MarketCap: 143.385 Millions | |
| Recent Price: 1.11 Smart Investing & Trading Score: 41 | |
| Day Percent Change: -1.34% Day Change: -0.02 | |
| Week Change: -5.15% Year-to-date Change: 31.8% | |
| XFOR Links: Profile News Message Board | |
| Charts:- Daily , Weekly | |
| Add XFOR to Watchlist: View: Get Complete XFOR Trend Analysis ➞ | |
 | PIRS Pieris Pharmaceuticals, Inc. |
| Sector: Health Care | |
| SubSector: Biotechnology | |
| MarketCap: 150.785 Millions | |
| Recent Price: 11.68 Smart Investing & Trading Score: 76 | |
| Day Percent Change: -1.35% Day Change: -0.16 | |
| Week Change: -0.34% Year-to-date Change: 6,317.6% | |
| PIRS Links: Profile News Message Board | |
| Charts:- Daily , Weekly | |
| Add PIRS to Watchlist: View: Get Complete PIRS Trend Analysis ➞ | |
 | SEM Select Medical Holdings Corporation |
| Sector: Health Care | |
| SubSector: Hospitals | |
| MarketCap: 1765.96 Millions | |
| Recent Price: 27.98 Smart Investing & Trading Score: 83 | |
| Day Percent Change: -1.37% Day Change: -0.39 | |
| Week Change: 2.08% Year-to-date Change: 19.1% | |
| SEM Links: Profile News Message Board | |
| Charts:- Daily , Weekly | |
| Add SEM to Watchlist: View: Get Complete SEM Trend Analysis ➞ | |
 | OCS Oculis Holding AG |
| Sector: Health Care | |
| SubSector: Biotechnology | |
| MarketCap: 460 Millions | |
| Recent Price: 12.89 Smart Investing & Trading Score: 90 | |
| Day Percent Change: -1.38% Day Change: -0.18 | |
| Week Change: 7.24% Year-to-date Change: 16.1% | |
| OCS Links: Profile News Message Board | |
| Charts:- Daily , Weekly | |
| Add OCS to Watchlist: View: Get Complete OCS Trend Analysis ➞ | |
 | AIRS AirSculpt Technologies, Inc. |
| Sector: Health Care | |
| SubSector: Medical Care Facilities | |
| MarketCap: 497 Millions | |
| Recent Price: 5.54 Smart Investing & Trading Score: 25 | |
| Day Percent Change: -1.51% Day Change: -0.08 | |
| Week Change: -1.34% Year-to-date Change: -26.1% | |
| AIRS Links: Profile News Message Board | |
| Charts:- Daily , Weekly | |
| Add AIRS to Watchlist: View: Get Complete AIRS Trend Analysis ➞ | |
| For tabular summary view of above stock list: Summary View ➞ 0 - 25 , 25 - 50 , 50 - 75 , 75 - 100 , 100 - 125 , 125 - 150 , 150 - 175 , 175 - 200 , 200 - 225 , 225 - 250 , 250 - 275 , 275 - 300 , 300 - 325 , 325 - 350 , 350 - 375 , 375 - 400 , 400 - 425 , 425 - 450 , 450 - 475 , 475 - 500 , 500 - 525 , 525 - 550 , 550 - 575 , 575 - 600 , 600 - 625 , 625 - 650 , 650 - 675 , 675 - 700 , 700 - 725 | ||
| Click To Change The Sort Order: By Market Cap or Company Size Performance: Year-to-date, Week and Day | |
| Select Chart Type: | ||
|
Best Stocks Today 12Stocks.com |
© 2024 12Stocks.com Terms & Conditions Privacy Contact Us
All Information Provided Only For Education And Not To Be Used For Investing or Trading. See Terms & Conditions


One More Thing ... Get Best Stocks Delivered Daily!
Never Ever Miss A Move With Our Top Ten Stocks Lists
Find Best Stocks In Any Market - Bull or Bear Market
Take A Peek At Our Top Ten Stocks Lists: Daily, Weekly, Year-to-Date & Top Trends
Find Best Stocks In Any Market - Bull or Bear Market
Take A Peek At Our Top Ten Stocks Lists: Daily, Weekly, Year-to-Date & Top Trends
Healthcare Stocks With Best Up Trends [0-bearish to 100-bullish]: CytomX [100], Surmodics [100], TransMedics [100], GeneDx [100], Summit [100], PROCEPT BioRobotics[100], Xencor [100], LivaNova [100], Humacyte [100], Mesoblast [100], United [100]
Best Healthcare Stocks Year-to-Date:
Pieris [6317.58%], Avenue [2856.52%], Precision BioSciences[2771.23%], Inovio [2172.55%], Assembly Biosciences[1518.1%], Agenus [1501.64%], Aurora Cannabis[1445.57%], NuCana [1245.5%], Adverum Biotechnologies[1200.48%], Affimed N.V[756%], CareMax [722.68%] Best Healthcare Stocks This Week:
CytomX [222.64%], GeneDx [88.81%], Deciphera [73.11%], Cue Biopharma[39.56%], Seres [30.91%], Poseida [30.05%], P3 Health[29.62%], Concord [29.33%], Phibro Animal[28.44%], Canopy Growth[28.4%], CareMax [27.88%] Best Healthcare Stocks Daily:
CytomX [214.72%], Surmodics [29.74%], TransMedics [24.93%], Ventyx Biosciences[24.63%], GeneDx [22.55%], Summit [19.59%], MiMedx [18.67%], Cabaletta Bio[16.58%], TG [16.25%], Bio-Techne [16.22%], Brainstorm Cell[15.10%]