
 Login Sign Up


| |||||
 |  | ||||

| 12Stocks.com Market Intelligence |
Best Healthcare Stocks
 | "Discover best trending healthcare stocks with 12Stocks.com." |
| - Subu Vdaygiri, Founder, 12Stocks.com |
| In a hurry? Healthcare Stocks Lists: Performance Trends Table, Stock Charts
Sort Healthcare stocks: Daily, Weekly, Year-to-Date, Market Cap & Trends. Filter Healthcare stocks list by size:All Healthcare Large Mid-Range Small |
| 12Stocks.com Healthcare Stocks Performances & Trends Daily | |||||||||
|
|  The overall Smart Investing & Trading Score is 52 (0-bearish to 100-bullish) which puts Healthcare sector in short term neutral trend. The Smart Investing & Trading Score from previous trading session is 38 and an improvement of trend continues.
| ||||||||
Here are the Smart Investing & Trading Scores of the most requested Healthcare stocks at 12Stocks.com (click stock name for detailed review):
|


| 12Stocks.com: Investing in Healthcare sector with Stocks | |
|
The following table helps investors and traders sort through current performance and trends (as measured by Smart Investing & Trading Score) of various
stocks in the Healthcare sector. Quick View: Move mouse or cursor over stock symbol (ticker) to view short-term Technical chart and over stock name to view long term chart. Click on  to add stock symbol to your watchlist and to add stock symbol to your watchlist and  to view watchlist. Click on any ticker or stock name for detailed market intelligence report for that stock. to view watchlist. Click on any ticker or stock name for detailed market intelligence report for that stock. |
12Stocks.com Performance of Stocks in Healthcare Sector
| Ticker | Stock Name | Watchlist | Category | Recent Price | Smart Investing & Trading Score | Change % | YTD Change% |
| NEO | NeoGenomics |   | Laboratories | 14.03 | 42 | -0.92 | -13.29% |
| OGN | Organon | | Drug Manufacturers - General | 18.35 | 90 | -0.92 | 27.96% |
| SNN | Smith & Nephew | | Equipment | 24.57 | 57 | -0.93 | -9.93% |
| NVAX | Novavax | | Biotechnology | 4.15 | 68 | -0.95 | -13.54% |
| WAT | Waters | | Instruments | 310.25 | 32 | -0.97 | -5.76% |
| ATHA | Athira Pharma | | Biotechnology | 2.02 | 10 | -0.98 | -17.21% |
| PRQR | ProQR | | Biotechnology | 2.00 | 39 | -0.99 | 1.01% |
| ADMA | ADMA Biologics | | Biotechnology | 6.47 | 90 | -0.99 | 43.25% |
| MLTX | MoonLake Immuno | | Biotechnology | 42.81 | 42 | -0.99 | -31.81% |
| ACAD | ACADIA | | Biotechnology | 16.57 | 23 | -1.02 | -47.08% |
| ABBV | AbbVie | | Pharmaceutical | 167.80 | 58 | -1.03 | 8.28% |
| OGI | OrganiGram | | Pharmaceutical | 1.93 | 51 | -1.03 | 47.33% |
| PCVX | Vaxcyte | | Biotechnology | 60.25 | 25 | -1.03 | -4.01% |
| CNTG | Centogene N.V | | Laboratories | 0.47 | 35 | -1.04 | -60.42% |
| VRTX | Vertex | | Biotechnology | 400.66 | 42 | -1.05 | -1.53% |
| ALVR | AlloVir | | Biotechnology | 0.78 | 95 | -1.05 | 15.14% |
| IBIO | iBio | | Biotechnology | 1.88 | 68 | -1.05 | 37.23% |
| VYGR | Voyager | | Biotechnology | 7.57 | 51 | -1.05 | -10.31% |
| SHC | Sotera Health | | Diagnostics & Research | 11.26 | 49 | -1.05 | -33.21% |
| ROIV | Roivant Sciences | | Biotechnology | 10.82 | 61 | -1.05 | -2.57% |
| CVS | CVS Health | | Insurance | 67.77 | 10 | -1.07 | -14.17% |
| PAVM | PAVmed | | Equipment | 1.85 | 20 | -1.07 | -55.10% |
| MDXG | MiMedx | | Equipment | 6.44 | 29 | -1.08 | -26.57% |
| NATR | Nature s | | Pharmaceutical | 19.56 | 66 | -1.09 | 13.10% |
| OVID | Ovid | | Biotechnology | 3.17 | 17 | -1.09 | -1.71% |
| For chart view version of above stock list: Chart View ➞ 0 - 25 , 25 - 50 , 50 - 75 , 75 - 100 , 100 - 125 , 125 - 150 , 150 - 175 , 175 - 200 , 200 - 225 , 225 - 250 , 250 - 275 , 275 - 300 , 300 - 325 , 325 - 350 , 350 - 375 , 375 - 400 , 400 - 425 , 425 - 450 , 450 - 475 , 475 - 500 , 500 - 525 , 525 - 550 , 550 - 575 , 575 - 600 , 600 - 625 , 625 - 650 , 650 - 675 , 675 - 700 , 700 - 725 | ||
 | Click To Change The Sort Order: By Market Cap or Company Size Performance: Year-to-date, Week and Day |  |
|
Get the most comprehensive stock market coverage daily at 12Stocks.com ➞ Best Stocks Today ➞ Best Stocks Weekly ➞ Best Stocks Year-to-Date ➞ Best Stocks Trends ➞  Best Stocks Today 12Stocks.com Best Nasdaq Stocks ➞ Best S&P 500 Stocks ➞ Best Tech Stocks ➞ Best Biotech Stocks ➞ |
| Detailed Overview of Healthcare Stocks |
| Healthcare Technical Overview, Leaders & Laggards, Top Healthcare ETF Funds & Detailed Healthcare Stocks List, Charts, Trends & More |
| Healthcare Sector: Technical Analysis, Trends & YTD Performance | |
| Healthcare sector is composed of stocks
from pharmaceutical, biotech, diagnostics labs, insurance providers
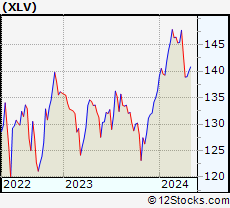
and healthcare services. Healthcare sector, as represented by XLV, an exchange-traded fund [ETF] that holds basket of Healthcare stocks (e.g, Merck, Amgen) is up by 3.28% and is currently underperforming the overall market by -2.38% year-to-date. Below is a quick view of Technical charts and trends: |
|
 XLV Weekly Chart |
|
| Long Term Trend: Good | |
| Medium Term Trend: Not Good | |
 XLV Daily Chart |
|
| Short Term Trend: Very Good | |
| Overall Trend Score: 52 | |
| YTD Performance: 3.28% | |
| **Trend Scores & Views Are Only For Educational Purposes And Not For Investing | |
| 12Stocks.com: Top Performing Healthcare Sector Stocks | ||||||||||||||||||||||||||||||||||||||||||||||||
 The top performing Healthcare sector stocks year to date are
Now, more recently, over last week, the top performing Healthcare sector stocks on the move are


|
||||||||||||||||||||||||||||||||||||||||||||||||
| 12Stocks.com: Investing in Healthcare Sector using Exchange Traded Funds | |
|
The following table shows list of key exchange traded funds (ETF) that
help investors track Healthcare Index. For detailed view, check out our ETF Funds section of our website. Quick View: Move mouse or cursor over ETF symbol (ticker) to view short-term Technical chart and over ETF name to view long term chart. Click on ticker or stock name for detailed view. Click on to add stock symbol to your watchlist and to view watchlist. |
12Stocks.com List of ETFs that track Healthcare Index
| Ticker | ETF Name | Watchlist | Recent Price | Smart Investing & Trading Score | Change % | Week % | Year-to-date % |
| XLV | Health Care | | 140.86 | 52 | -0.31 | 1.37 | 3.28% |
| XBI | Biotech | | 83.94 | 25 | -0.89 | 1.34 | -5.99% |
| IBB | Biotechnology | | 127.81 | 32 | -0.17 | 2.47 | -5.92% |
| BBH | Biotech | | 157.97 | 49 | 0.43 | 3.68 | -4.44% |
| VHT | Health Care | | 257.26 | 30 | -0.22 | 1.55 | 2.62% |
| IYH | Healthcare | | 59.09 | 30 | -0.20 | 1.6 | 3.22% |
| IHF | Healthcare Providers | | 52.31 | 48 | -0.02 | 0.19 | -0.38% |
| IHI | Medical Devices | | 55.64 | 35 | 0.23 | 2.35 | 3.09% |
| BIB | Biotechnology | | 50.18 | 32 | -0.30 | 4.11 | -12.04% |
| BIS | Short Biotech | | 19.94 | 61 | 0.00 | -4.57 | 10.35% |
| XHE | Health Care Equipment | | 83.22 | 35 | 0.25 | 2.39 | -1.24% |
| CURE | Healthcare Bull 3X | | 107.58 | 32 | -0.50 | 4.12 | 5.75% |
| LABU | Biotech Bull 3X | | 89.40 | 25 | -2.80 | 3.89 | -26.7% |
| LABD | Biotech Bear 3X | | 10.37 | 62 | 2.98 | -3.98 | 7.02% |
| PSCH | SmallCap Health Care | | 41.22 | 41 | 0.01 | 2.59 | -3.69% |
| XHS | Health Care Services | | 88.70 | 53 | -0.06 | 1.85 | -0.28% |
| PTH | DWA Healthcare Momentum | | 39.63 | 46 | -1.34 | 0.25 | 1.25% |
| BTEC | Principal Healthcare Innovators | | 34.51 | 18 | -0.85 | 1.92 | -5.01% |
| RXL | Health Care | | 96.00 | 45 | -0.15 | 2.99 | 5.03% |
| RXD | Short Health Care | | 11.34 | 45 | 0.88 | -2.54 | -4.87% |
| 12Stocks.com: Charts, Trends, Fundamental Data and Performances of Healthcare Stocks | |
|
We now take in-depth look at all Healthcare stocks including charts, multi-period performances and overall trends (as measured by Smart Investing & Trading Score). One can sort Healthcare stocks (click link to choose) by Daily, Weekly and by Year-to-Date performances. Also, one can sort by size of the company or by market capitalization. |
| Select Your Default Chart Type: | |||||
| |||||
| Click on stock symbol or name for detailed view. Click on to add stock symbol to your watchlist and to view watchlist. Quick View: Move mouse or cursor over "Daily" to quickly view daily Technical stock chart and over "Weekly" to view weekly Technical stock chart. | |||||

 | NEO NeoGenomics, Inc. |
| Sector: Health Care | |
| SubSector: Medical Laboratories & Research | |
| MarketCap: 2763.8 Millions | |
| Recent Price: 14.03 Smart Investing & Trading Score: 42 | |
| Day Percent Change: -0.92% Day Change: -0.13 | |
| Week Change: 3.7% Year-to-date Change: -13.3% | |
| NEO Links: Profile News Message Board | |
| Charts:- Daily , Weekly | |
| Add NEO to Watchlist: View: Get Complete NEO Trend Analysis ➞ | |
 | OGN Organon & Co. |
| Sector: Health Care | |
| SubSector: Drug Manufacturers - General | |
| MarketCap: 5230 Millions | |
| Recent Price: 18.35 Smart Investing & Trading Score: 90 | |
| Day Percent Change: -0.92% Day Change: -0.17 | |
| Week Change: 2.97% Year-to-date Change: 28.0% | |
| OGN Links: Profile News Message Board | |
| Charts:- Daily , Weekly | |
| Add OGN to Watchlist: View: Get Complete OGN Trend Analysis ➞ | |
 | SNN Smith & Nephew plc |
| Sector: Health Care | |
| SubSector: Medical Appliances & Equipment | |
| MarketCap: 15180.8 Millions | |
| Recent Price: 24.57 Smart Investing & Trading Score: 57 | |
| Day Percent Change: -0.93% Day Change: -0.23 | |
| Week Change: 3.06% Year-to-date Change: -9.9% | |
| SNN Links: Profile News Message Board | |
| Charts:- Daily , Weekly | |
| Add SNN to Watchlist: View: Get Complete SNN Trend Analysis ➞ | |
 | NVAX Novavax, Inc. |
| Sector: Health Care | |
| SubSector: Biotechnology | |
| MarketCap: 376.185 Millions | |
| Recent Price: 4.15 Smart Investing & Trading Score: 68 | |
| Day Percent Change: -0.95% Day Change: -0.04 | |
| Week Change: 4.53% Year-to-date Change: -13.5% | |
| NVAX Links: Profile News Message Board | |
| Charts:- Daily , Weekly | |
| Add NVAX to Watchlist: View: Get Complete NVAX Trend Analysis ➞ | |
 | WAT Waters Corporation |
| Sector: Health Care | |
| SubSector: Medical Instruments & Supplies | |
| MarketCap: 11882 Millions | |
| Recent Price: 310.25 Smart Investing & Trading Score: 32 | |
| Day Percent Change: -0.97% Day Change: -3.05 | |
| Week Change: 4.78% Year-to-date Change: -5.8% | |
| WAT Links: Profile News Message Board | |
| Charts:- Daily , Weekly | |
| Add WAT to Watchlist: View: Get Complete WAT Trend Analysis ➞ | |
 | ATHA Athira Pharma, Inc. |
| Sector: Health Care | |
| SubSector: Biotechnology | |
| MarketCap: 92487 Millions | |
| Recent Price: 2.02 Smart Investing & Trading Score: 10 | |
| Day Percent Change: -0.98% Day Change: -0.02 | |
| Week Change: -5.61% Year-to-date Change: -17.2% | |
| ATHA Links: Profile News Message Board | |
| Charts:- Daily , Weekly | |
| Add ATHA to Watchlist: View: Get Complete ATHA Trend Analysis ➞ | |
 | PRQR ProQR Therapeutics N.V. |
| Sector: Health Care | |
| SubSector: Biotechnology | |
| MarketCap: 324.385 Millions | |
| Recent Price: 2.00 Smart Investing & Trading Score: 39 | |
| Day Percent Change: -0.99% Day Change: -0.02 | |
| Week Change: 0.5% Year-to-date Change: 1.0% | |
| PRQR Links: Profile News Message Board | |
| Charts:- Daily , Weekly | |
| Add PRQR to Watchlist: View: Get Complete PRQR Trend Analysis ➞ | |
 | ADMA ADMA Biologics, Inc. |
| Sector: Health Care | |
| SubSector: Biotechnology | |
| MarketCap: 204.985 Millions | |
| Recent Price: 6.47 Smart Investing & Trading Score: 90 | |
| Day Percent Change: -0.99% Day Change: -0.07 | |
| Week Change: 3.27% Year-to-date Change: 43.3% | |
| ADMA Links: Profile News Message Board | |
| Charts:- Daily , Weekly | |
| Add ADMA to Watchlist: View: Get Complete ADMA Trend Analysis ➞ | |
 | MLTX MoonLake Immunotherapeutics |
| Sector: Health Care | |
| SubSector: Biotechnology | |
| MarketCap: 2670 Millions | |
| Recent Price: 42.81 Smart Investing & Trading Score: 42 | |
| Day Percent Change: -0.99% Day Change: -0.43 | |
| Week Change: 1.47% Year-to-date Change: -31.8% | |
| MLTX Links: Profile News Message Board | |
| Charts:- Daily , Weekly | |
| Add MLTX to Watchlist: View: Get Complete MLTX Trend Analysis ➞ | |
 | ACAD ACADIA Pharmaceuticals Inc. |
| Sector: Health Care | |
| SubSector: Biotechnology | |
| MarketCap: 5400.35 Millions | |
| Recent Price: 16.57 Smart Investing & Trading Score: 23 | |
| Day Percent Change: -1.02% Day Change: -0.17 | |
| Week Change: -1.49% Year-to-date Change: -47.1% | |
| ACAD Links: Profile News Message Board | |
| Charts:- Daily , Weekly | |
| Add ACAD to Watchlist: View: Get Complete ACAD Trend Analysis ➞ | |
 | ABBV AbbVie Inc. |
| Sector: Health Care | |
| SubSector: Drug Manufacturers - Major | |
| MarketCap: 110080 Millions | |
| Recent Price: 167.80 Smart Investing & Trading Score: 58 | |
| Day Percent Change: -1.03% Day Change: -1.74 | |
| Week Change: 0.84% Year-to-date Change: 8.3% | |
| ABBV Links: Profile News Message Board | |
| Charts:- Daily , Weekly | |
| Add ABBV to Watchlist: View: Get Complete ABBV Trend Analysis ➞ | |
 | OGI OrganiGram Holdings Inc. |
| Sector: Health Care | |
| SubSector: Drugs - Generic | |
| MarketCap: 256.885 Millions | |
| Recent Price: 1.93 Smart Investing & Trading Score: 51 | |
| Day Percent Change: -1.03% Day Change: -0.02 | |
| Week Change: 2.66% Year-to-date Change: 47.3% | |
| OGI Links: Profile News Message Board | |
| Charts:- Daily , Weekly | |
| Add OGI to Watchlist: View: Get Complete OGI Trend Analysis ➞ | |
 | PCVX Vaxcyte, Inc. |
| Sector: Health Care | |
| SubSector: Biotechnology | |
| MarketCap: 13887 Millions | |
| Recent Price: 60.25 Smart Investing & Trading Score: 25 | |
| Day Percent Change: -1.03% Day Change: -0.63 | |
| Week Change: -0.76% Year-to-date Change: -4.0% | |
| PCVX Links: Profile News Message Board | |
| Charts:- Daily , Weekly | |
| Add PCVX to Watchlist: View: Get Complete PCVX Trend Analysis ➞ | |
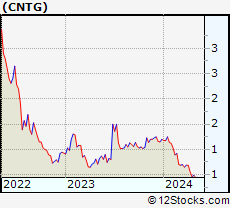 | CNTG Centogene N.V. |
| Sector: Health Care | |
| SubSector: Medical Laboratories & Research | |
| MarketCap: 455.8 Millions | |
| Recent Price: 0.47 Smart Investing & Trading Score: 35 | |
| Day Percent Change: -1.04% Day Change: -0.01 | |
| Week Change: 2.59% Year-to-date Change: -60.4% | |
| CNTG Links: Profile News Message Board | |
| Charts:- Daily , Weekly | |
| Add CNTG to Watchlist: View: Get Complete CNTG Trend Analysis ➞ | |
 | VRTX Vertex Pharmaceuticals Incorporated |
| Sector: Health Care | |
| SubSector: Biotechnology | |
| MarketCap: 57669.6 Millions | |
| Recent Price: 400.66 Smart Investing & Trading Score: 42 | |
| Day Percent Change: -1.05% Day Change: -4.25 | |
| Week Change: 1.62% Year-to-date Change: -1.5% | |
| VRTX Links: Profile News Message Board | |
| Charts:- Daily , Weekly | |
| Add VRTX to Watchlist: View: Get Complete VRTX Trend Analysis ➞ | |
 | ALVR AlloVir, Inc. |
| Sector: Health Care | |
| SubSector: Biotechnology | |
| MarketCap: 25787 Millions | |
| Recent Price: 0.78 Smart Investing & Trading Score: 95 | |
| Day Percent Change: -1.05% Day Change: -0.01 | |
| Week Change: 4.11% Year-to-date Change: 15.1% | |
| ALVR Links: Profile News Message Board | |
| Charts:- Daily , Weekly | |
| Add ALVR to Watchlist: View: Get Complete ALVR Trend Analysis ➞ | |
 | IBIO iBio, Inc. |
| Sector: Health Care | |
| SubSector: Biotechnology | |
| MarketCap: 110.885 Millions | |
| Recent Price: 1.88 Smart Investing & Trading Score: 68 | |
| Day Percent Change: -1.05% Day Change: -0.02 | |
| Week Change: 9.3% Year-to-date Change: 37.2% | |
| IBIO Links: Profile News Message Board | |
| Charts:- Daily , Weekly | |
| Add IBIO to Watchlist: View: Get Complete IBIO Trend Analysis ➞ | |
 | VYGR Voyager Therapeutics, Inc. |
| Sector: Health Care | |
| SubSector: Biotechnology | |
| MarketCap: 321.085 Millions | |
| Recent Price: 7.57 Smart Investing & Trading Score: 51 | |
| Day Percent Change: -1.05% Day Change: -0.08 | |
| Week Change: 0.93% Year-to-date Change: -10.3% | |
| VYGR Links: Profile News Message Board | |
| Charts:- Daily , Weekly | |
| Add VYGR to Watchlist: View: Get Complete VYGR Trend Analysis ➞ | |
 | SHC Sotera Health Company |
| Sector: Health Care | |
| SubSector: Diagnostics & Research | |
| MarketCap: 71087 Millions | |
| Recent Price: 11.26 Smart Investing & Trading Score: 49 | |
| Day Percent Change: -1.05% Day Change: -0.12 | |
| Week Change: 4.36% Year-to-date Change: -33.2% | |
| SHC Links: Profile News Message Board | |
| Charts:- Daily , Weekly | |
| Add SHC to Watchlist: View: Get Complete SHC Trend Analysis ➞ | |
 | ROIV Roivant Sciences Ltd. |
| Sector: Health Care | |
| SubSector: Biotechnology | |
| MarketCap: 7780 Millions | |
| Recent Price: 10.82 Smart Investing & Trading Score: 61 | |
| Day Percent Change: -1.05% Day Change: -0.12 | |
| Week Change: 3.44% Year-to-date Change: -2.6% | |
| ROIV Links: Profile News Message Board | |
| Charts:- Daily , Weekly | |
| Add ROIV to Watchlist: View: Get Complete ROIV Trend Analysis ➞ | |
 | CVS CVS Health Corporation |
| Sector: Health Care | |
| SubSector: Health Care Plans | |
| MarketCap: 80104.3 Millions | |
| Recent Price: 67.77 Smart Investing & Trading Score: 10 | |
| Day Percent Change: -1.07% Day Change: -0.73 | |
| Week Change: -2.84% Year-to-date Change: -14.2% | |
| CVS Links: Profile News Message Board | |
| Charts:- Daily , Weekly | |
| Add CVS to Watchlist: View: Get Complete CVS Trend Analysis ➞ | |
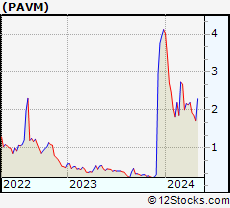 | PAVM PAVmed Inc. |
| Sector: Health Care | |
| SubSector: Medical Appliances & Equipment | |
| MarketCap: 65.408 Millions | |
| Recent Price: 1.85 Smart Investing & Trading Score: 20 | |
| Day Percent Change: -1.07% Day Change: -0.02 | |
| Week Change: -0.54% Year-to-date Change: -55.1% | |
| PAVM Links: Profile News Message Board | |
| Charts:- Daily , Weekly | |
| Add PAVM to Watchlist: View: Get Complete PAVM Trend Analysis ➞ | |
 | MDXG MiMedx Group, Inc. |
| Sector: Health Care | |
| SubSector: Medical Appliances & Equipment | |
| MarketCap: 371.08 Millions | |
| Recent Price: 6.44 Smart Investing & Trading Score: 29 | |
| Day Percent Change: -1.08% Day Change: -0.07 | |
| Week Change: 2.38% Year-to-date Change: -26.6% | |
| MDXG Links: Profile News Message Board | |
| Charts:- Daily , Weekly | |
| Add MDXG to Watchlist: View: Get Complete MDXG Trend Analysis ➞ | |
 | NATR Nature s Sunshine Products, Inc. |
| Sector: Health Care | |
| SubSector: Drugs - Generic | |
| MarketCap: 153.285 Millions | |
| Recent Price: 19.56 Smart Investing & Trading Score: 66 | |
| Day Percent Change: -1.09% Day Change: -0.21 | |
| Week Change: 1.37% Year-to-date Change: 13.1% | |
| NATR Links: Profile News Message Board | |
| Charts:- Daily , Weekly | |
| Add NATR to Watchlist: View: Get Complete NATR Trend Analysis ➞ | |
 | OVID Ovid Therapeutics Inc. |
| Sector: Health Care | |
| SubSector: Biotechnology | |
| MarketCap: 130.385 Millions | |
| Recent Price: 3.17 Smart Investing & Trading Score: 17 | |
| Day Percent Change: -1.09% Day Change: -0.04 | |
| Week Change: -2.47% Year-to-date Change: -1.7% | |
| OVID Links: Profile News Message Board | |
| Charts:- Daily , Weekly | |
| Add OVID to Watchlist: View: Get Complete OVID Trend Analysis ➞ | |
| For tabular summary view of above stock list: Summary View ➞ 0 - 25 , 25 - 50 , 50 - 75 , 75 - 100 , 100 - 125 , 125 - 150 , 150 - 175 , 175 - 200 , 200 - 225 , 225 - 250 , 250 - 275 , 275 - 300 , 300 - 325 , 325 - 350 , 350 - 375 , 375 - 400 , 400 - 425 , 425 - 450 , 450 - 475 , 475 - 500 , 500 - 525 , 525 - 550 , 550 - 575 , 575 - 600 , 600 - 625 , 625 - 650 , 650 - 675 , 675 - 700 , 700 - 725 | ||
| Click To Change The Sort Order: By Market Cap or Company Size Performance: Year-to-date, Week and Day | |
| Select Chart Type: | ||
|
Best Stocks Today 12Stocks.com |
© 2024 12Stocks.com Terms & Conditions Privacy Contact Us
All Information Provided Only For Education And Not To Be Used For Investing or Trading. See Terms & Conditions


One More Thing ... Get Best Stocks Delivered Daily!
Never Ever Miss A Move With Our Top Ten Stocks Lists
Find Best Stocks In Any Market - Bull or Bear Market
Take A Peek At Our Top Ten Stocks Lists: Daily, Weekly, Year-to-Date & Top Trends
Find Best Stocks In Any Market - Bull or Bear Market
Take A Peek At Our Top Ten Stocks Lists: Daily, Weekly, Year-to-Date & Top Trends
Healthcare Stocks With Best Up Trends [0-bearish to 100-bullish]: Annovis Bio[100], Boston Scientific[100], Integer [100], Quest Diagnostics[100], AstraZeneca [100], Oscar Health[100], PureTech Health[100], Glaukos [100], Agios [100], Avadel [100], Pieris [100]
Best Healthcare Stocks Year-to-Date:
Pieris [6273.63%], Precision BioSciences[2587.67%], Inovio [1880.39%], Assembly Biosciences[1543.7%], Aurora Cannabis[1411.97%], Adverum Biotechnologies[1274.87%], NuCana [1198.17%], Agenus [796.24%], Affimed N.V[693.6%], CareMax [574.23%], Corbus [487.75%] Best Healthcare Stocks This Week:
Pieris [7900%], Agenus [39.74%], BeyondSpring [36.67%], VolitionRx [30.91%], Seres [30.29%], Annovis Bio[27.4%], CareMax [27.24%], ProKidney [23.28%], GeneDx [22.61%], Cullinan Oncology[20.69%], Aesthetic [19.36%] Best Healthcare Stocks Daily:
Agenus [14.86%], Cullinan Oncology[13.55%], Apyx [13.26%], Aesthetic [12.50%], Amneal [12.41%], Gritstone Oncology[11.01%], HOOKIPA Pharma[10.20%], Beyond Air[8.26%], Sage [8.11%], Relay [7.46%], BeyondSpring [7.42%]