
 Login Sign Up


| |||||
 |  | ||||

| 12Stocks.com Market Intelligence |
Best Healthcare Stocks
 | "Discover best trending healthcare stocks with 12Stocks.com." |
| - Subu Vdaygiri, Founder, 12Stocks.com |
| In a hurry? Healthcare Stocks Lists: Performance Trends Table, Stock Charts
Sort Healthcare stocks: Daily, Weekly, Year-to-Date, Market Cap & Trends. Filter Healthcare stocks list by size:All Healthcare Large Mid-Range Small |
| 12Stocks.com Healthcare Stocks Performances & Trends Daily | |||||||||
|
|  The overall Smart Investing & Trading Score is 38 (0-bearish to 100-bullish) which puts Healthcare sector in short term bearish to neutral trend. The Smart Investing & Trading Score from previous trading session is 52 and hence a deterioration of trend.
| ||||||||
Here are the Smart Investing & Trading Scores of the most requested Healthcare stocks at 12Stocks.com (click stock name for detailed review):
|


| 12Stocks.com: Investing in Healthcare sector with Stocks | |
|
The following table helps investors and traders sort through current performance and trends (as measured by Smart Investing & Trading Score) of various
stocks in the Healthcare sector. Quick View: Move mouse or cursor over stock symbol (ticker) to view short-term Technical chart and over stock name to view long term chart. Click on  to add stock symbol to your watchlist and to add stock symbol to your watchlist and  to view watchlist. Click on any ticker or stock name for detailed market intelligence report for that stock. to view watchlist. Click on any ticker or stock name for detailed market intelligence report for that stock. |
12Stocks.com Performance of Stocks in Healthcare Sector
| Ticker | Stock Name | Watchlist | Category | Recent Price | Smart Investing & Trading Score | Change % | YTD Change% |
| SNDX | Syndax |   | Biotechnology | 20.45 | 54 | -1.64 | -5.37% |
| NBIX | Neurocrine Biosciences | | Biotechnology | 136.66 | 63 | -1.66 | 3.72% |
| MTD | Mettler-Toledo | | Instruments | 1214.82 | 61 | -1.66 | 0.15% |
| PCVX | Vaxcyte | | Biotechnology | 59.25 | 18 | -1.66 | -5.61% |
| LBPH | Longboard | | Biotechnology | 19.43 | 62 | -1.67 | 218.00% |
| PSTX | Poseida | | Biotechnology | 2.03 | 25 | -1.69 | -39.67% |
| CERT | Certara | | Biotechnology | 16.16 | 33 | -1.70 | -8.21% |
| EPIX | ESSA Pharma | | Biotechnology | 6.27 | 10 | -1.72 | -4.13% |
| WAT | Waters | | Instruments | 304.88 | 25 | -1.73 | -7.40% |
| LMAT | LeMaitre Vascular | | Instruments | 62.92 | 44 | -1.73 | 10.86% |
| STRO | Sutro Biopharma | | Biotechnology | 3.41 | 20 | -1.73 | -20.51% |
| DGX | Quest Diagnostics | | Laboratories | 135.16 | 100 | -1.74 | -1.97% |
| HAE | Haemonetics | | Instruments | 84.72 | 100 | -1.74 | -0.92% |
| PEN | Penumbra | | Instruments | 202.57 | 25 | -1.74 | -19.47% |
| ALC | Alcon | | Instruments | 78.17 | 36 | -1.77 | 0.06% |
| CCM | Concord | | Hospitals | 0.56 | 42 | -1.77 | -49.09% |
| SHCR | Sharecare | | Health Information | 0.74 | 50 | -1.78 | -32.18% |
| MASS | 908 Devices | | Medical Devices | 5.50 | 25 | -1.79 | -50.89% |
| ITCI | Intra-Cellular Therapies | | Biotechnology | 71.81 | 83 | -1.80 | 0.26% |
| NKTR | Nektar | | Biotechnology | 1.36 | 78 | -1.81 | 139.82% |
| ZBH | Zimmer Biomet | | Equipment | 118.98 | 30 | -1.81 | -2.24% |
| NNOX | Nano X | | Medical Devices | 8.94 | 61 | -1.81 | 40.35% |
| GEHC | GE | | Health Information | 84.88 | 56 | -1.81 | 9.74% |
| MASI | Masimo | | Instruments | 133.43 | 61 | -1.83 | 13.84% |
| TARS | Tarsus | | Biotechnology | 32.17 | 49 | -1.83 | 58.63% |
| For chart view version of above stock list: Chart View ➞ 0 - 25 , 25 - 50 , 50 - 75 , 75 - 100 , 100 - 125 , 125 - 150 , 150 - 175 , 175 - 200 , 200 - 225 , 225 - 250 , 250 - 275 , 275 - 300 , 300 - 325 , 325 - 350 , 350 - 375 , 375 - 400 , 400 - 425 , 425 - 450 , 450 - 475 , 475 - 500 , 500 - 525 , 525 - 550 , 550 - 575 , 575 - 600 , 600 - 625 , 625 - 650 | ||
 | Click To Change The Sort Order: By Market Cap or Company Size Performance: Year-to-date, Week and Day |  |
|
Get the most comprehensive stock market coverage daily at 12Stocks.com ➞ Best Stocks Today ➞ Best Stocks Weekly ➞ Best Stocks Year-to-Date ➞ Best Stocks Trends ➞  Best Stocks Today 12Stocks.com Best Nasdaq Stocks ➞ Best S&P 500 Stocks ➞ Best Tech Stocks ➞ Best Biotech Stocks ➞ |
| Detailed Overview of Healthcare Stocks |
| Healthcare Technical Overview, Leaders & Laggards, Top Healthcare ETF Funds & Detailed Healthcare Stocks List, Charts, Trends & More |
| Healthcare Sector: Technical Analysis, Trends & YTD Performance | |
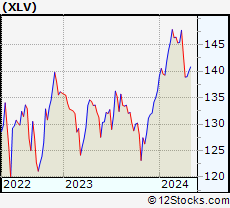
| Healthcare sector is composed of stocks
from pharmaceutical, biotech, diagnostics labs, insurance providers
and healthcare services. Healthcare sector, as represented by XLV, an exchange-traded fund [ETF] that holds basket of Healthcare stocks (e.g, Merck, Amgen) is up by 2.27% and is currently underperforming the overall market by -1.98% year-to-date. Below is a quick view of Technical charts and trends: |
|
 XLV Weekly Chart |
|
| Long Term Trend: Not Good | |
| Medium Term Trend: Not Good | |
 XLV Daily Chart |
|
| Short Term Trend: Very Good | |
| Overall Trend Score: 38 | |
| YTD Performance: 2.27% | |
| **Trend Scores & Views Are Only For Educational Purposes And Not For Investing | |
| 12Stocks.com: Top Performing Healthcare Sector Stocks | ||||||||||||||||||||||||||||||||||||||||||||||||
 The top performing Healthcare sector stocks year to date are
Now, more recently, over last week, the top performing Healthcare sector stocks on the move are


|
||||||||||||||||||||||||||||||||||||||||||||||||
| 12Stocks.com: Investing in Healthcare Sector using Exchange Traded Funds | |
|
The following table shows list of key exchange traded funds (ETF) that
help investors track Healthcare Index. For detailed view, check out our ETF Funds section of our website. Quick View: Move mouse or cursor over ETF symbol (ticker) to view short-term Technical chart and over ETF name to view long term chart. Click on ticker or stock name for detailed view. Click on to add stock symbol to your watchlist and to view watchlist. |
12Stocks.com List of ETFs that track Healthcare Index
| Ticker | ETF Name | Watchlist | Recent Price | Smart Investing & Trading Score | Change % | Week % | Year-to-date % |
| XLV | Health Care | | 139.47 | 38 | -0.99 | 0.37 | 2.27% |
| IBB | Biotechnology | | 124.82 | 10 | -2.30 | 0.08 | -8.12% |
| BBH | Biotech | | 157.33 | 49 | 0.00 | 3.26 | -4.83% |
| IHF | Healthcare Providers | | 51.96 | 43 | -0.57 | -0.48 | -1.05% |
| PSCH | SmallCap Health Care | | 41.08 | 35 | -0.10 | 2.24 | -4.02% |
| XHS | Health Care Services | | 87.93 | 68 | -0.87 | 0.97 | -1.15% |
| PTH | DWA Healthcare Momentum | | 39.60 | 46 | -0.08 | 0.18 | 1.18% |
| BTEC | Principal Healthcare Innovators | | 34.21 | 32 | 0.02 | 1.04 | -5.83% |
| RXL | Health Care | | 93.89 | 38 | -2.20 | 0.72 | 2.72% |
| RXD | Short Health Care | | 11.37 | 45 | 0.19 | -2.36 | -4.7% |
| 12Stocks.com: Charts, Trends, Fundamental Data and Performances of Healthcare Stocks | |
|
We now take in-depth look at all Healthcare stocks including charts, multi-period performances and overall trends (as measured by Smart Investing & Trading Score). One can sort Healthcare stocks (click link to choose) by Daily, Weekly and by Year-to-Date performances. Also, one can sort by size of the company or by market capitalization. |
| Select Your Default Chart Type: | |||||
| |||||
| Click on stock symbol or name for detailed view. Click on to add stock symbol to your watchlist and to view watchlist. Quick View: Move mouse or cursor over "Daily" to quickly view daily Technical stock chart and over "Weekly" to view weekly Technical stock chart. | |||||

 | SNDX Syndax Pharmaceuticals, Inc. |
| Sector: Health Care | |
| SubSector: Biotechnology | |
| MarketCap: 365.985 Millions | |
| Recent Price: 20.45 Smart Investing & Trading Score: 54 | |
| Day Percent Change: -1.64% Day Change: -0.34 | |
| Week Change: -1.68% Year-to-date Change: -5.4% | |
| SNDX Links: Profile News Message Board | |
| Charts:- Daily , Weekly | |
| Add SNDX to Watchlist: View: Get Complete SNDX Trend Analysis ➞ | |
 | NBIX Neurocrine Biosciences, Inc. |
| Sector: Health Care | |
| SubSector: Biotechnology | |
| MarketCap: 7897.85 Millions | |
| Recent Price: 136.66 Smart Investing & Trading Score: 63 | |
| Day Percent Change: -1.66% Day Change: -2.31 | |
| Week Change: 3.53% Year-to-date Change: 3.7% | |
| NBIX Links: Profile News Message Board | |
| Charts:- Daily , Weekly | |
| Add NBIX to Watchlist: View: Get Complete NBIX Trend Analysis ➞ | |
 | MTD Mettler-Toledo International Inc. |
| Sector: Health Care | |
| SubSector: Medical Instruments & Supplies | |
| MarketCap: 15973.1 Millions | |
| Recent Price: 1214.82 Smart Investing & Trading Score: 61 | |
| Day Percent Change: -1.66% Day Change: -20.55 | |
| Week Change: 2.21% Year-to-date Change: 0.2% | |
| MTD Links: Profile News Message Board | |
| Charts:- Daily , Weekly | |
| Add MTD to Watchlist: View: Get Complete MTD Trend Analysis ➞ | |
 | PCVX Vaxcyte, Inc. |
| Sector: Health Care | |
| SubSector: Biotechnology | |
| MarketCap: 13887 Millions | |
| Recent Price: 59.25 Smart Investing & Trading Score: 18 | |
| Day Percent Change: -1.66% Day Change: -1.00 | |
| Week Change: -2.4% Year-to-date Change: -5.6% | |
| PCVX Links: Profile News Message Board | |
| Charts:- Daily , Weekly | |
| Add PCVX to Watchlist: View: Get Complete PCVX Trend Analysis ➞ | |
 | LBPH Longboard Pharmaceuticals, Inc. |
| Sector: Health Care | |
| SubSector: Biotechnology | |
| MarketCap: 169 Millions | |
| Recent Price: 19.43 Smart Investing & Trading Score: 62 | |
| Day Percent Change: -1.67% Day Change: -0.33 | |
| Week Change: 11.41% Year-to-date Change: 218.0% | |
| LBPH Links: Profile News Message Board | |
| Charts:- Daily , Weekly | |
| Add LBPH to Watchlist: View: Get Complete LBPH Trend Analysis ➞ | |
 | PSTX Poseida Therapeutics, Inc. |
| Sector: Health Care | |
| SubSector: Biotechnology | |
| MarketCap: 64487 Millions | |
| Recent Price: 2.03 Smart Investing & Trading Score: 25 | |
| Day Percent Change: -1.69% Day Change: -0.04 | |
| Week Change: -0.98% Year-to-date Change: -39.7% | |
| PSTX Links: Profile News Message Board | |
| Charts:- Daily , Weekly | |
| Add PSTX to Watchlist: View: Get Complete PSTX Trend Analysis ➞ | |
 | CERT Certara, Inc. |
| Sector: Health Care | |
| SubSector: Biotechnology | |
| MarketCap: 21487 Millions | |
| Recent Price: 16.16 Smart Investing & Trading Score: 33 | |
| Day Percent Change: -1.70% Day Change: -0.28 | |
| Week Change: 1.41% Year-to-date Change: -8.2% | |
| CERT Links: Profile News Message Board | |
| Charts:- Daily , Weekly | |
| Add CERT to Watchlist: View: Get Complete CERT Trend Analysis ➞ | |
 | EPIX ESSA Pharma Inc. |
| Sector: Health Care | |
| SubSector: Biotechnology | |
| MarketCap: 70.5785 Millions | |
| Recent Price: 6.27 Smart Investing & Trading Score: 10 | |
| Day Percent Change: -1.72% Day Change: -0.11 | |
| Week Change: -4.57% Year-to-date Change: -4.1% | |
| EPIX Links: Profile News Message Board | |
| Charts:- Daily , Weekly | |
| Add EPIX to Watchlist: View: Get Complete EPIX Trend Analysis ➞ | |
 | WAT Waters Corporation |
| Sector: Health Care | |
| SubSector: Medical Instruments & Supplies | |
| MarketCap: 11882 Millions | |
| Recent Price: 304.88 Smart Investing & Trading Score: 25 | |
| Day Percent Change: -1.73% Day Change: -5.37 | |
| Week Change: 2.97% Year-to-date Change: -7.4% | |
| WAT Links: Profile News Message Board | |
| Charts:- Daily , Weekly | |
| Add WAT to Watchlist: View: Get Complete WAT Trend Analysis ➞ | |
 | LMAT LeMaitre Vascular, Inc. |
| Sector: Health Care | |
| SubSector: Medical Instruments & Supplies | |
| MarketCap: 522.16 Millions | |
| Recent Price: 62.92 Smart Investing & Trading Score: 44 | |
| Day Percent Change: -1.73% Day Change: -1.11 | |
| Week Change: -0.53% Year-to-date Change: 10.9% | |
| LMAT Links: Profile News Message Board | |
| Charts:- Daily , Weekly | |
| Add LMAT to Watchlist: View: Get Complete LMAT Trend Analysis ➞ | |
 | STRO Sutro Biopharma, Inc. |
| Sector: Health Care | |
| SubSector: Biotechnology | |
| MarketCap: 196.485 Millions | |
| Recent Price: 3.41 Smart Investing & Trading Score: 20 | |
| Day Percent Change: -1.73% Day Change: -0.06 | |
| Week Change: -6.19% Year-to-date Change: -20.5% | |
| STRO Links: Profile News Message Board | |
| Charts:- Daily , Weekly | |
| Add STRO to Watchlist: View: Get Complete STRO Trend Analysis ➞ | |
 | DGX Quest Diagnostics Incorporated |
| Sector: Health Care | |
| SubSector: Medical Laboratories & Research | |
| MarketCap: 11076.1 Millions | |
| Recent Price: 135.16 Smart Investing & Trading Score: 100 | |
| Day Percent Change: -1.74% Day Change: -2.39 | |
| Week Change: 5.23% Year-to-date Change: -2.0% | |
| DGX Links: Profile News Message Board | |
| Charts:- Daily , Weekly | |
| Add DGX to Watchlist: View: Get Complete DGX Trend Analysis ➞ | |
 | HAE Haemonetics Corporation |
| Sector: Health Care | |
| SubSector: Medical Instruments & Supplies | |
| MarketCap: 4500.7 Millions | |
| Recent Price: 84.72 Smart Investing & Trading Score: 100 | |
| Day Percent Change: -1.74% Day Change: -1.50 | |
| Week Change: 4.28% Year-to-date Change: -0.9% | |
| HAE Links: Profile News Message Board | |
| Charts:- Daily , Weekly | |
| Add HAE to Watchlist: View: Get Complete HAE Trend Analysis ➞ | |
 | PEN Penumbra, Inc. |
| Sector: Health Care | |
| SubSector: Medical Instruments & Supplies | |
| MarketCap: 4854.1 Millions | |
| Recent Price: 202.57 Smart Investing & Trading Score: 25 | |
| Day Percent Change: -1.74% Day Change: -3.58 | |
| Week Change: -0.07% Year-to-date Change: -19.5% | |
| PEN Links: Profile News Message Board | |
| Charts:- Daily , Weekly | |
| Add PEN to Watchlist: View: Get Complete PEN Trend Analysis ➞ | |
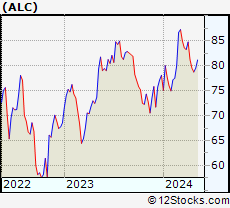 | ALC Alcon, Inc. |
| Sector: Health Care | |
| SubSector: Medical Instruments & Supplies | |
| MarketCap: 20968.1 Millions | |
| Recent Price: 78.17 Smart Investing & Trading Score: 36 | |
| Day Percent Change: -1.77% Day Change: -1.40 | |
| Week Change: -1.74% Year-to-date Change: 0.1% | |
| ALC Links: Profile News Message Board | |
| Charts:- Daily , Weekly | |
| Add ALC to Watchlist: View: Get Complete ALC Trend Analysis ➞ | |
 | CCM Concord Medical Services Holdings Limited |
| Sector: Health Care | |
| SubSector: Hospitals | |
| MarketCap: 138.646 Millions | |
| Recent Price: 0.56 Smart Investing & Trading Score: 42 | |
| Day Percent Change: -1.77% Day Change: -0.01 | |
| Week Change: 1.82% Year-to-date Change: -49.1% | |
| CCM Links: Profile News Message Board | |
| Charts:- Daily , Weekly | |
| Add CCM to Watchlist: View: Get Complete CCM Trend Analysis ➞ | |
 | SHCR Sharecare, Inc. |
| Sector: Health Care | |
| SubSector: Health Information Services | |
| MarketCap: 640 Millions | |
| Recent Price: 0.74 Smart Investing & Trading Score: 50 | |
| Day Percent Change: -1.78% Day Change: -0.01 | |
| Week Change: 12.34% Year-to-date Change: -32.2% | |
| SHCR Links: Profile News Message Board | |
| Charts:- Daily , Weekly | |
| Add SHCR to Watchlist: View: Get Complete SHCR Trend Analysis ➞ | |
 | MASS 908 Devices Inc. |
| Sector: Health Care | |
| SubSector: Medical Devices | |
| MarketCap: 225 Millions | |
| Recent Price: 5.50 Smart Investing & Trading Score: 25 | |
| Day Percent Change: -1.79% Day Change: -0.10 | |
| Week Change: -1.43% Year-to-date Change: -50.9% | |
| MASS Links: Profile News Message Board | |
| Charts:- Daily , Weekly | |
| Add MASS to Watchlist: View: Get Complete MASS Trend Analysis ➞ | |
 | ITCI Intra-Cellular Therapies, Inc. |
| Sector: Health Care | |
| SubSector: Biotechnology | |
| MarketCap: 991.885 Millions | |
| Recent Price: 71.81 Smart Investing & Trading Score: 83 | |
| Day Percent Change: -1.80% Day Change: -1.31 | |
| Week Change: -0.78% Year-to-date Change: 0.3% | |
| ITCI Links: Profile News Message Board | |
| Charts:- Daily , Weekly | |
| Add ITCI to Watchlist: View: Get Complete ITCI Trend Analysis ➞ | |
 | NKTR Nektar Therapeutics |
| Sector: Health Care | |
| SubSector: Biotechnology | |
| MarketCap: 2953.45 Millions | |
| Recent Price: 1.36 Smart Investing & Trading Score: 78 | |
| Day Percent Change: -1.81% Day Change: -0.02 | |
| Week Change: 9.27% Year-to-date Change: 139.8% | |
| NKTR Links: Profile News Message Board | |
| Charts:- Daily , Weekly | |
| Add NKTR to Watchlist: View: Get Complete NKTR Trend Analysis ➞ | |
 | ZBH Zimmer Biomet Holdings, Inc. |
| Sector: Health Care | |
| SubSector: Medical Appliances & Equipment | |
| MarketCap: 19339.4 Millions | |
| Recent Price: 118.98 Smart Investing & Trading Score: 30 | |
| Day Percent Change: -1.81% Day Change: -2.19 | |
| Week Change: -0.38% Year-to-date Change: -2.2% | |
| ZBH Links: Profile News Message Board | |
| Charts:- Daily , Weekly | |
| Add ZBH to Watchlist: View: Get Complete ZBH Trend Analysis ➞ | |
 | NNOX Nano X Imaging Ltd. |
| Sector: Health Care | |
| SubSector: Medical Devices | |
| MarketCap: 22587 Millions | |
| Recent Price: 8.94 Smart Investing & Trading Score: 61 | |
| Day Percent Change: -1.81% Day Change: -0.17 | |
| Week Change: -1.11% Year-to-date Change: 40.4% | |
| NNOX Links: Profile News Message Board | |
| Charts:- Daily , Weekly | |
| Add NNOX to Watchlist: View: Get Complete NNOX Trend Analysis ➞ | |
 | GEHC GE HealthCare Technologies Inc. |
| Sector: Health Care | |
| SubSector: Health Information Services | |
| MarketCap: 36240 Millions | |
| Recent Price: 84.88 Smart Investing & Trading Score: 56 | |
| Day Percent Change: -1.81% Day Change: -1.56 | |
| Week Change: 0.46% Year-to-date Change: 9.7% | |
| GEHC Links: Profile News Message Board | |
| Charts:- Daily , Weekly | |
| Add GEHC to Watchlist: View: Get Complete GEHC Trend Analysis ➞ | |
 | MASI Masimo Corporation |
| Sector: Health Care | |
| SubSector: Medical Instruments & Supplies | |
| MarketCap: 8493.2 Millions | |
| Recent Price: 133.43 Smart Investing & Trading Score: 61 | |
| Day Percent Change: -1.83% Day Change: -2.49 | |
| Week Change: -0.99% Year-to-date Change: 13.8% | |
| MASI Links: Profile News Message Board | |
| Charts:- Daily , Weekly | |
| Add MASI to Watchlist: View: Get Complete MASI Trend Analysis ➞ | |
 | TARS Tarsus Pharmaceuticals, Inc. |
| Sector: Health Care | |
| SubSector: Biotechnology | |
| MarketCap: 74487 Millions | |
| Recent Price: 32.17 Smart Investing & Trading Score: 49 | |
| Day Percent Change: -1.83% Day Change: -0.60 | |
| Week Change: -2.19% Year-to-date Change: 58.6% | |
| TARS Links: Profile News Message Board | |
| Charts:- Daily , Weekly | |
| Add TARS to Watchlist: View: Get Complete TARS Trend Analysis ➞ | |
| For tabular summary view of above stock list: Summary View ➞ 0 - 25 , 25 - 50 , 50 - 75 , 75 - 100 , 100 - 125 , 125 - 150 , 150 - 175 , 175 - 200 , 200 - 225 , 225 - 250 , 250 - 275 , 275 - 300 , 300 - 325 , 325 - 350 , 350 - 375 , 375 - 400 , 400 - 425 , 425 - 450 , 450 - 475 , 475 - 500 , 500 - 525 , 525 - 550 , 550 - 575 , 575 - 600 , 600 - 625 , 625 - 650 | ||
| Click To Change The Sort Order: By Market Cap or Company Size Performance: Year-to-date, Week and Day | |
| Select Chart Type: | ||
|
Best Stocks Today 12Stocks.com |
© 2024 12Stocks.com Terms & Conditions Privacy Contact Us
All Information Provided Only For Education And Not To Be Used For Investing or Trading. See Terms & Conditions


One More Thing ... Get Best Stocks Delivered Daily!
Never Ever Miss A Move With Our Top Ten Stocks Lists
Find Best Stocks In Any Market - Bull or Bear Market
Take A Peek At Our Top Ten Stocks Lists: Daily, Weekly, Year-to-Date & Top Trends
Find Best Stocks In Any Market - Bull or Bear Market
Take A Peek At Our Top Ten Stocks Lists: Daily, Weekly, Year-to-Date & Top Trends
Healthcare Stocks With Best Up Trends [0-bearish to 100-bullish]: AstraZeneca [100], Annovis Bio[100], Merck [100], Boston Scientific[100], Agios [100], Quest Diagnostics[100], Haemonetics [100], Agenus [95], Mesoblast [95], Centene [93], TransMedics [93]
Best Healthcare Stocks Year-to-Date:
Precision BioSciences[2590.41%], Inovio [1849.02%], Assembly Biosciences[1543.7%], Aurora Cannabis[1348.97%], NuCana [1198.17%], Agenus [856.64%], CareMax [572.16%], Corbus [444.45%], Mesoblast [440%], Janux [333.88%], GeneDx [318.75%] Best Healthcare Stocks This Week:
Agenus [49.15%], Seres [38.35%], BeyondSpring [35%], Annovis Bio[30%], CareMax [26.85%], ProKidney [25.74%], Cullinan Oncology[21.1%], OptiNose [18.42%], GeneDx [18.15%], BeiGene [15.29%], Hutchison China[14.55%] Best Healthcare Stocks Daily:
OptiNose [14.56%], ADiTx [10.57%], LENSAR [6.92%], Zura Bio[6.75%], Agenus [6.74%], Community Health[6.44%], Seres [6.18%], AstraZeneca [5.79%], Sanofi [5.43%], Galera [4.98%], Sana Biotechnology[4.00%]