
 Login Sign Up


| |||||
 |  | ||||

| 12Stocks.com Market Intelligence |
Best Healthcare Stocks
 | "Discover best trending healthcare stocks with 12Stocks.com." |
| - Subu Vdaygiri, Founder, 12Stocks.com |
| In a hurry? Healthcare Stocks Lists: Performance Trends Table, Stock Charts
Sort Healthcare stocks: Daily, Weekly, Year-to-Date, Market Cap & Trends. Filter Healthcare stocks list by size:All Healthcare Large Mid-Range Small |
| 12Stocks.com Healthcare Stocks Performances & Trends Daily | |||||||||
|
|  The overall Smart Investing & Trading Score is 52 (0-bearish to 100-bullish) which puts Healthcare sector in short term neutral trend. The Smart Investing & Trading Score from previous trading session is 38 and an improvement of trend continues.
| ||||||||
Here are the Smart Investing & Trading Scores of the most requested Healthcare stocks at 12Stocks.com (click stock name for detailed review):
|


| 12Stocks.com: Investing in Healthcare sector with Stocks | |
|
The following table helps investors and traders sort through current performance and trends (as measured by Smart Investing & Trading Score) of various
stocks in the Healthcare sector. Quick View: Move mouse or cursor over stock symbol (ticker) to view short-term Technical chart and over stock name to view long term chart. Click on  to add stock symbol to your watchlist and to add stock symbol to your watchlist and  to view watchlist. Click on any ticker or stock name for detailed market intelligence report for that stock. to view watchlist. Click on any ticker or stock name for detailed market intelligence report for that stock. |
12Stocks.com Performance of Stocks in Healthcare Sector
| Ticker | Stock Name | Watchlist | Category | Recent Price | Smart Investing & Trading Score | Change % | YTD Change% |
| ENTA | Enanta |   | Biotechnology | 12.92 | 46 | -1.75 | 37.30% |
| DOCS | Doximity | | Health Information | 24.15 | 0 | -1.75 | -15.05% |
| RPTX | Repare | | Biotechnology | 3.30 | 42 | -1.79 | -54.79% |
| TRVN | Trevena | | Biotechnology | 0.38 | 42 | -1.80 | -47.24% |
| LLY | Eli Lilly | | Pharmaceutical | 732.20 | 51 | -1.81 | 25.61% |
| DYN | Dyne | | Biotechnology | 24.98 | 27 | -1.81 | 87.82% |
| CTKB | Cytek Biosciences | | Medical Devices | 5.71 | 20 | -1.81 | -37.96% |
| CNMD | CONMED | | Equipment | 70.01 | 20 | -1.82 | -36.07% |
| RDHL | RedHill Biopharma | | Biotechnology | 0.42 | 20 | -1.82 | -71.24% |
| RXST | RxSight | | Medical Devices | 53.86 | 86 | -1.82 | 34.28% |
| CPIX | Cumberland | | Pharmaceutical | 1.61 | 34 | -1.83 | -10.14% |
| RARE | Ultragenyx | | Biotechnology | 44.28 | 57 | -1.84 | -7.40% |
| FENC | Fennec | | Biotechnology | 9.07 | 10 | -1.84 | -19.16% |
| KRYS | Krystal Biotech | | Biotechnology | 159.05 | 41 | -1.85 | 28.20% |
| RVMD | Revolution Medicines | | Biotechnology | 35.59 | 73 | -1.85 | 24.09% |
| WGS | GeneDx | | Health Information | 11.82 | 88 | -1.87 | 334.56% |
| TGTX | TG | | Biotechnology | 13.98 | 35 | -1.89 | -18.15% |
| TMDX | TransMedics | | Equipment | 88.88 | 86 | -1.90 | 12.61% |
| EHAB | Enhabit | | Medical Care Facilities | 10.07 | 54 | -1.90 | -2.66% |
| NVO | Novo Nordisk | | Biotechnology | 126.16 | 71 | -1.93 | 21.95% |
| PRCT | PROCEPT BioRobotics | | Medical Devices | 52.67 | 86 | -1.95 | 24.40% |
| CELC | Celcuity | | Laboratories | 16.90 | 46 | -1.97 | 15.28% |
| SLNO | Soleno | | Laboratories | 39.34 | 42 | -1.99 | -2.26% |
| RGEN | Repligen | | Biotechnology | 167.86 | 42 | -2.00 | -6.64% |
| AXDX | Accelerate Diagnostics | | Laboratories | 0.93 | 64 | -2.00 | -76.25% |
| For chart view version of above stock list: Chart View ➞ 0 - 25 , 25 - 50 , 50 - 75 , 75 - 100 , 100 - 125 , 125 - 150 , 150 - 175 , 175 - 200 , 200 - 225 , 225 - 250 , 250 - 275 , 275 - 300 , 300 - 325 , 325 - 350 , 350 - 375 , 375 - 400 , 400 - 425 , 425 - 450 , 450 - 475 , 475 - 500 , 500 - 525 , 525 - 550 , 550 - 575 , 575 - 600 , 600 - 625 , 625 - 650 , 650 - 675 , 675 - 700 , 700 - 725 | ||
 | Click To Change The Sort Order: By Market Cap or Company Size Performance: Year-to-date, Week and Day |  |
|
Get the most comprehensive stock market coverage daily at 12Stocks.com ➞ Best Stocks Today ➞ Best Stocks Weekly ➞ Best Stocks Year-to-Date ➞ Best Stocks Trends ➞  Best Stocks Today 12Stocks.com Best Nasdaq Stocks ➞ Best S&P 500 Stocks ➞ Best Tech Stocks ➞ Best Biotech Stocks ➞ |
| Detailed Overview of Healthcare Stocks |
| Healthcare Technical Overview, Leaders & Laggards, Top Healthcare ETF Funds & Detailed Healthcare Stocks List, Charts, Trends & More |
| Healthcare Sector: Technical Analysis, Trends & YTD Performance | |
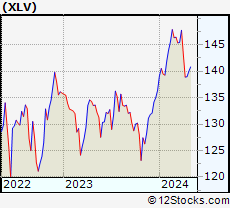
| Healthcare sector is composed of stocks
from pharmaceutical, biotech, diagnostics labs, insurance providers
and healthcare services. Healthcare sector, as represented by XLV, an exchange-traded fund [ETF] that holds basket of Healthcare stocks (e.g, Merck, Amgen) is up by 3.28% and is currently underperforming the overall market by -2.38% year-to-date. Below is a quick view of Technical charts and trends: |
|
 XLV Weekly Chart |
|
| Long Term Trend: Good | |
| Medium Term Trend: Not Good | |
 XLV Daily Chart |
|
| Short Term Trend: Very Good | |
| Overall Trend Score: 52 | |
| YTD Performance: 3.28% | |
| **Trend Scores & Views Are Only For Educational Purposes And Not For Investing | |
| 12Stocks.com: Top Performing Healthcare Sector Stocks | ||||||||||||||||||||||||||||||||||||||||||||||||
 The top performing Healthcare sector stocks year to date are
Now, more recently, over last week, the top performing Healthcare sector stocks on the move are


|
||||||||||||||||||||||||||||||||||||||||||||||||
| 12Stocks.com: Investing in Healthcare Sector using Exchange Traded Funds | |
|
The following table shows list of key exchange traded funds (ETF) that
help investors track Healthcare Index. For detailed view, check out our ETF Funds section of our website. Quick View: Move mouse or cursor over ETF symbol (ticker) to view short-term Technical chart and over ETF name to view long term chart. Click on ticker or stock name for detailed view. Click on to add stock symbol to your watchlist and to view watchlist. |
12Stocks.com List of ETFs that track Healthcare Index
| Ticker | ETF Name | Watchlist | Recent Price | Smart Investing & Trading Score | Change % | Week % | Year-to-date % |
| XLV | Health Care | | 140.86 | 52 | -0.31 | 1.37 | 3.28% |
| XBI | Biotech | | 83.94 | 25 | -0.89 | 1.34 | -5.99% |
| IBB | Biotechnology | | 127.76 | 32 | -0.20 | 2.44 | -5.96% |
| BBH | Biotech | | 157.33 | 49 | 0.03 | 3.26 | -4.83% |
| VHT | Health Care | | 257.26 | 30 | -0.22 | 1.55 | 2.62% |
| IYH | Healthcare | | 59.09 | 30 | -0.20 | 1.6 | 3.22% |
| IHF | Healthcare Providers | | 52.26 | 48 | -0.11 | 0.1 | -0.48% |
| IHI | Medical Devices | | 55.64 | 35 | 0.23 | 2.35 | 3.09% |
| BIB | Biotechnology | | 50.18 | 32 | -0.30 | 4.11 | -12.04% |
| BIS | Short Biotech | | 20.09 | 61 | 0.75 | -3.85 | 11.18% |
| XHE | Health Care Equipment | | 83.21 | 35 | 0.24 | 2.39 | -1.25% |
| CURE | Healthcare Bull 3X | | 107.85 | 32 | -0.25 | 4.37 | 6.01% |
| LABU | Biotech Bull 3X | | 89.40 | 25 | -2.80 | 3.89 | -26.7% |
| LABD | Biotech Bear 3X | | 10.37 | 62 | 2.98 | -3.98 | 7.02% |
| PSCH | SmallCap Health Care | | 41.12 | 41 | -0.23 | 2.35 | -3.92% |
| XHS | Health Care Services | | 88.70 | 53 | -0.06 | 1.85 | -0.28% |
| PTH | DWA Healthcare Momentum | | 39.63 | 46 | -1.34 | 0.25 | 1.25% |
| BTEC | Principal Healthcare Innovators | | 34.20 | 18 | -1.73 | 1.02 | -5.85% |
| RXL | Health Care | | 96.00 | 45 | -0.15 | 2.99 | 5.03% |
| RXD | Short Health Care | | 11.34 | 45 | 0.88 | -2.54 | -4.87% |
| 12Stocks.com: Charts, Trends, Fundamental Data and Performances of Healthcare Stocks | |
|
We now take in-depth look at all Healthcare stocks including charts, multi-period performances and overall trends (as measured by Smart Investing & Trading Score). One can sort Healthcare stocks (click link to choose) by Daily, Weekly and by Year-to-Date performances. Also, one can sort by size of the company or by market capitalization. |
| Select Your Default Chart Type: | |||||
| |||||
| Click on stock symbol or name for detailed view. Click on to add stock symbol to your watchlist and to view watchlist. Quick View: Move mouse or cursor over "Daily" to quickly view daily Technical stock chart and over "Weekly" to view weekly Technical stock chart. | |||||

 | ENTA Enanta Pharmaceuticals, Inc. |
| Sector: Health Care | |
| SubSector: Biotechnology | |
| MarketCap: 998.385 Millions | |
| Recent Price: 12.92 Smart Investing & Trading Score: 46 | |
| Day Percent Change: -1.75% Day Change: -0.23 | |
| Week Change: -3% Year-to-date Change: 37.3% | |
| ENTA Links: Profile News Message Board | |
| Charts:- Daily , Weekly | |
| Add ENTA to Watchlist: View: Get Complete ENTA Trend Analysis ➞ | |
 | DOCS Doximity, Inc. |
| Sector: Health Care | |
| SubSector: Health Information Services | |
| MarketCap: 6540 Millions | |
| Recent Price: 24.15 Smart Investing & Trading Score: 0 | |
| Day Percent Change: -1.75% Day Change: -0.43 | |
| Week Change: -1.95% Year-to-date Change: -15.1% | |
| DOCS Links: Profile News Message Board | |
| Charts:- Daily , Weekly | |
| Add DOCS to Watchlist: View: Get Complete DOCS Trend Analysis ➞ | |
 | RPTX Repare Therapeutics Inc. |
| Sector: Health Care | |
| SubSector: Biotechnology | |
| MarketCap: 13687 Millions | |
| Recent Price: 3.30 Smart Investing & Trading Score: 42 | |
| Day Percent Change: -1.79% Day Change: -0.06 | |
| Week Change: 9.27% Year-to-date Change: -54.8% | |
| RPTX Links: Profile News Message Board | |
| Charts:- Daily , Weekly | |
| Add RPTX to Watchlist: View: Get Complete RPTX Trend Analysis ➞ | |
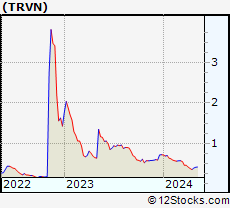 | TRVN Trevena, Inc. |
| Sector: Health Care | |
| SubSector: Biotechnology | |
| MarketCap: 57.7785 Millions | |
| Recent Price: 0.38 Smart Investing & Trading Score: 42 | |
| Day Percent Change: -1.80% Day Change: -0.01 | |
| Week Change: 8.24% Year-to-date Change: -47.2% | |
| TRVN Links: Profile News Message Board | |
| Charts:- Daily , Weekly | |
| Add TRVN to Watchlist: View: Get Complete TRVN Trend Analysis ➞ | |
 | LLY Eli Lilly and Company |
| Sector: Health Care | |
| SubSector: Drug Manufacturers - Major | |
| MarketCap: 130066 Millions | |
| Recent Price: 732.20 Smart Investing & Trading Score: 51 | |
| Day Percent Change: -1.81% Day Change: -13.49 | |
| Week Change: 0.81% Year-to-date Change: 25.6% | |
| LLY Links: Profile News Message Board | |
| Charts:- Daily , Weekly | |
| Add LLY to Watchlist: View: Get Complete LLY Trend Analysis ➞ | |
 | DYN Dyne Therapeutics, Inc. |
| Sector: Health Care | |
| SubSector: Biotechnology | |
| MarketCap: 88487 Millions | |
| Recent Price: 24.98 Smart Investing & Trading Score: 27 | |
| Day Percent Change: -1.81% Day Change: -0.46 | |
| Week Change: 4.69% Year-to-date Change: 87.8% | |
| DYN Links: Profile News Message Board | |
| Charts:- Daily , Weekly | |
| Add DYN to Watchlist: View: Get Complete DYN Trend Analysis ➞ | |
 | CTKB Cytek Biosciences, Inc. |
| Sector: Health Care | |
| SubSector: Medical Devices | |
| MarketCap: 1140 Millions | |
| Recent Price: 5.71 Smart Investing & Trading Score: 20 | |
| Day Percent Change: -1.81% Day Change: -0.10 | |
| Week Change: -3.63% Year-to-date Change: -38.0% | |
| CTKB Links: Profile News Message Board | |
| Charts:- Daily , Weekly | |
| Add CTKB to Watchlist: View: Get Complete CTKB Trend Analysis ➞ | |
 | CNMD CONMED Corporation |
| Sector: Health Care | |
| SubSector: Medical Appliances & Equipment | |
| MarketCap: 1589.2 Millions | |
| Recent Price: 70.01 Smart Investing & Trading Score: 20 | |
| Day Percent Change: -1.82% Day Change: -1.30 | |
| Week Change: -3.62% Year-to-date Change: -36.1% | |
| CNMD Links: Profile News Message Board | |
| Charts:- Daily , Weekly | |
| Add CNMD to Watchlist: View: Get Complete CNMD Trend Analysis ➞ | |
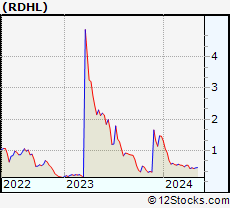 | RDHL RedHill Biopharma Ltd. |
| Sector: Health Care | |
| SubSector: Biotechnology | |
| MarketCap: 138.685 Millions | |
| Recent Price: 0.42 Smart Investing & Trading Score: 20 | |
| Day Percent Change: -1.82% Day Change: -0.01 | |
| Week Change: -7.1% Year-to-date Change: -71.2% | |
| RDHL Links: Profile News Message Board | |
| Charts:- Daily , Weekly | |
| Add RDHL to Watchlist: View: Get Complete RDHL Trend Analysis ➞ | |
 | RXST RxSight, Inc. |
| Sector: Health Care | |
| SubSector: Medical Devices | |
| MarketCap: 893 Millions | |
| Recent Price: 53.86 Smart Investing & Trading Score: 86 | |
| Day Percent Change: -1.82% Day Change: -1.00 | |
| Week Change: 4.42% Year-to-date Change: 34.3% | |
| RXST Links: Profile News Message Board | |
| Charts:- Daily , Weekly | |
| Add RXST to Watchlist: View: Get Complete RXST Trend Analysis ➞ | |
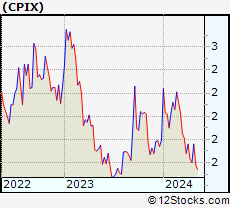 | CPIX Cumberland Pharmaceuticals Inc. |
| Sector: Health Care | |
| SubSector: Drug Manufacturers - Other | |
| MarketCap: 57.4033 Millions | |
| Recent Price: 1.61 Smart Investing & Trading Score: 34 | |
| Day Percent Change: -1.83% Day Change: -0.03 | |
| Week Change: 0.63% Year-to-date Change: -10.1% | |
| CPIX Links: Profile News Message Board | |
| Charts:- Daily , Weekly | |
| Add CPIX to Watchlist: View: Get Complete CPIX Trend Analysis ➞ | |
 | RARE Ultragenyx Pharmaceutical Inc. |
| Sector: Health Care | |
| SubSector: Biotechnology | |
| MarketCap: 2373.35 Millions | |
| Recent Price: 44.28 Smart Investing & Trading Score: 57 | |
| Day Percent Change: -1.84% Day Change: -0.83 | |
| Week Change: 4.51% Year-to-date Change: -7.4% | |
| RARE Links: Profile News Message Board | |
| Charts:- Daily , Weekly | |
| Add RARE to Watchlist: View: Get Complete RARE Trend Analysis ➞ | |
 | FENC Fennec Pharmaceuticals Inc. |
| Sector: Health Care | |
| SubSector: Biotechnology | |
| MarketCap: 126.785 Millions | |
| Recent Price: 9.07 Smart Investing & Trading Score: 10 | |
| Day Percent Change: -1.84% Day Change: -0.17 | |
| Week Change: -2.68% Year-to-date Change: -19.2% | |
| FENC Links: Profile News Message Board | |
| Charts:- Daily , Weekly | |
| Add FENC to Watchlist: View: Get Complete FENC Trend Analysis ➞ | |
 | KRYS Krystal Biotech, Inc. |
| Sector: Health Care | |
| SubSector: Biotechnology | |
| MarketCap: 874.085 Millions | |
| Recent Price: 159.05 Smart Investing & Trading Score: 41 | |
| Day Percent Change: -1.85% Day Change: -2.99 | |
| Week Change: 0.26% Year-to-date Change: 28.2% | |
| KRYS Links: Profile News Message Board | |
| Charts:- Daily , Weekly | |
| Add KRYS to Watchlist: View: Get Complete KRYS Trend Analysis ➞ | |
 | RVMD Revolution Medicines, Inc. |
| Sector: Health Care | |
| SubSector: Biotechnology | |
| MarketCap: 28087 Millions | |
| Recent Price: 35.59 Smart Investing & Trading Score: 73 | |
| Day Percent Change: -1.85% Day Change: -0.67 | |
| Week Change: 1.83% Year-to-date Change: 24.1% | |
| RVMD Links: Profile News Message Board | |
| Charts:- Daily , Weekly | |
| Add RVMD to Watchlist: View: Get Complete RVMD Trend Analysis ➞ | |
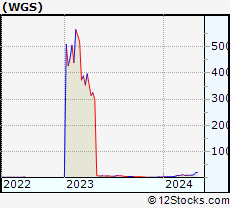 | WGS GeneDx Holdings Corp. |
| Sector: Health Care | |
| SubSector: Health Information Services | |
| MarketCap: 148 Millions | |
| Recent Price: 11.82 Smart Investing & Trading Score: 88 | |
| Day Percent Change: -1.87% Day Change: -0.22 | |
| Week Change: 22.61% Year-to-date Change: 334.6% | |
| WGS Links: Profile News Message Board | |
| Charts:- Daily , Weekly | |
| Add WGS to Watchlist: View: Get Complete WGS Trend Analysis ➞ | |
 | TGTX TG Therapeutics, Inc. |
| Sector: Health Care | |
| SubSector: Biotechnology | |
| MarketCap: 1022.85 Millions | |
| Recent Price: 13.98 Smart Investing & Trading Score: 35 | |
| Day Percent Change: -1.89% Day Change: -0.27 | |
| Week Change: 1.45% Year-to-date Change: -18.2% | |
| TGTX Links: Profile News Message Board | |
| Charts:- Daily , Weekly | |
| Add TGTX to Watchlist: View: Get Complete TGTX Trend Analysis ➞ | |
 | TMDX TransMedics Group, Inc. |
| Sector: Health Care | |
| SubSector: Medical Appliances & Equipment | |
| MarketCap: 331.68 Millions | |
| Recent Price: 88.88 Smart Investing & Trading Score: 86 | |
| Day Percent Change: -1.90% Day Change: -1.72 | |
| Week Change: 5.58% Year-to-date Change: 12.6% | |
| TMDX Links: Profile News Message Board | |
| Charts:- Daily , Weekly | |
| Add TMDX to Watchlist: View: Get Complete TMDX Trend Analysis ➞ | |
 | EHAB Enhabit, Inc. |
| Sector: Health Care | |
| SubSector: Medical Care Facilities | |
| MarketCap: 569 Millions | |
| Recent Price: 10.07 Smart Investing & Trading Score: 54 | |
| Day Percent Change: -1.90% Day Change: -0.20 | |
| Week Change: -1.71% Year-to-date Change: -2.7% | |
| EHAB Links: Profile News Message Board | |
| Charts:- Daily , Weekly | |
| Add EHAB to Watchlist: View: Get Complete EHAB Trend Analysis ➞ | |
 | NVO Novo Nordisk A/S |
| Sector: Health Care | |
| SubSector: Biotechnology | |
| MarketCap: 100744 Millions | |
| Recent Price: 126.16 Smart Investing & Trading Score: 71 | |
| Day Percent Change: -1.93% Day Change: -2.48 | |
| Week Change: 2.81% Year-to-date Change: 22.0% | |
| NVO Links: Profile News Message Board | |
| Charts:- Daily , Weekly | |
| Add NVO to Watchlist: View: Get Complete NVO Trend Analysis ➞ | |
 | PRCT PROCEPT BioRobotics Corporation |
| Sector: Health Care | |
| SubSector: Medical Devices | |
| MarketCap: 1600 Millions | |
| Recent Price: 52.67 Smart Investing & Trading Score: 86 | |
| Day Percent Change: -1.95% Day Change: -1.05 | |
| Week Change: 4.94% Year-to-date Change: 24.4% | |
| PRCT Links: Profile News Message Board | |
| Charts:- Daily , Weekly | |
| Add PRCT to Watchlist: View: Get Complete PRCT Trend Analysis ➞ | |
 | CELC Celcuity Inc. |
| Sector: Health Care | |
| SubSector: Medical Laboratories & Research | |
| MarketCap: 70.53 Millions | |
| Recent Price: 16.90 Smart Investing & Trading Score: 46 | |
| Day Percent Change: -1.97% Day Change: -0.34 | |
| Week Change: -1.86% Year-to-date Change: 15.3% | |
| CELC Links: Profile News Message Board | |
| Charts:- Daily , Weekly | |
| Add CELC to Watchlist: View: Get Complete CELC Trend Analysis ➞ | |
 | SLNO Soleno Therapeutics, Inc. |
| Sector: Health Care | |
| SubSector: Medical Laboratories & Research | |
| MarketCap: 94 Millions | |
| Recent Price: 39.34 Smart Investing & Trading Score: 42 | |
| Day Percent Change: -1.99% Day Change: -0.80 | |
| Week Change: 4.82% Year-to-date Change: -2.3% | |
| SLNO Links: Profile News Message Board | |
| Charts:- Daily , Weekly | |
| Add SLNO to Watchlist: View: Get Complete SLNO Trend Analysis ➞ | |
 | RGEN Repligen Corporation |
| Sector: Health Care | |
| SubSector: Biotechnology | |
| MarketCap: 4711.75 Millions | |
| Recent Price: 167.86 Smart Investing & Trading Score: 42 | |
| Day Percent Change: -2.00% Day Change: -3.42 | |
| Week Change: 6.82% Year-to-date Change: -6.6% | |
| RGEN Links: Profile News Message Board | |
| Charts:- Daily , Weekly | |
| Add RGEN to Watchlist: View: Get Complete RGEN Trend Analysis ➞ | |
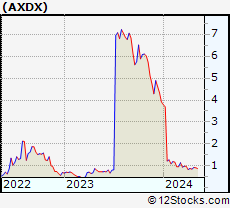 | AXDX Accelerate Diagnostics, Inc. |
| Sector: Health Care | |
| SubSector: Medical Laboratories & Research | |
| MarketCap: 286.4 Millions | |
| Recent Price: 0.93 Smart Investing & Trading Score: 64 | |
| Day Percent Change: -2.00% Day Change: -0.02 | |
| Week Change: 8.38% Year-to-date Change: -76.3% | |
| AXDX Links: Profile News Message Board | |
| Charts:- Daily , Weekly | |
| Add AXDX to Watchlist: View: Get Complete AXDX Trend Analysis ➞ | |
| For tabular summary view of above stock list: Summary View ➞ 0 - 25 , 25 - 50 , 50 - 75 , 75 - 100 , 100 - 125 , 125 - 150 , 150 - 175 , 175 - 200 , 200 - 225 , 225 - 250 , 250 - 275 , 275 - 300 , 300 - 325 , 325 - 350 , 350 - 375 , 375 - 400 , 400 - 425 , 425 - 450 , 450 - 475 , 475 - 500 , 500 - 525 , 525 - 550 , 550 - 575 , 575 - 600 , 600 - 625 , 625 - 650 , 650 - 675 , 675 - 700 , 700 - 725 | ||
| Click To Change The Sort Order: By Market Cap or Company Size Performance: Year-to-date, Week and Day | |
| Select Chart Type: | ||
|
Best Stocks Today 12Stocks.com |
© 2024 12Stocks.com Terms & Conditions Privacy Contact Us
All Information Provided Only For Education And Not To Be Used For Investing or Trading. See Terms & Conditions


One More Thing ... Get Best Stocks Delivered Daily!
Never Ever Miss A Move With Our Top Ten Stocks Lists
Find Best Stocks In Any Market - Bull or Bear Market
Take A Peek At Our Top Ten Stocks Lists: Daily, Weekly, Year-to-Date & Top Trends
Find Best Stocks In Any Market - Bull or Bear Market
Take A Peek At Our Top Ten Stocks Lists: Daily, Weekly, Year-to-Date & Top Trends
Healthcare Stocks With Best Up Trends [0-bearish to 100-bullish]: Annovis Bio[100], Boston Scientific[100], Integer [100], Quest Diagnostics[100], AstraZeneca [100], Oscar Health[100], PureTech Health[100], Glaukos [100], Agios [100], Pieris [100], Avadel [100]
Best Healthcare Stocks Year-to-Date:
Pieris [6427.47%], Precision BioSciences[2590.41%], Inovio [1892.16%], Assembly Biosciences[1543.7%], Aurora Cannabis[1411.97%], Adverum Biotechnologies[1253.61%], NuCana [1198.17%], Agenus [796.24%], Affimed N.V[680.8%], CareMax [574.23%], Corbus [488.41%] Best Healthcare Stocks This Week:
Pieris [8093.1%], Aesthetic [53.58%], Agenus [39.74%], BeyondSpring [35%], Seres [30.29%], VolitionRx [29.87%], Annovis Bio[27.4%], CareMax [27.24%], ProKidney [23.28%], GeneDx [22.61%], Cullinan Oncology[20.69%] Best Healthcare Stocks Daily:
Aesthetic [44.75%], Agenus [14.86%], Apyx [13.64%], Cullinan Oncology[13.55%], Amneal [12.04%], HOOKIPA Pharma[11.11%], Gritstone Oncology[10.06%], DURECT [9.75%], Sage [8.11%], Relay [7.46%], Annovis Bio[7.24%]