
 Login Sign Up


| |||||
 |  | ||||

| 12Stocks.com Market Intelligence |
Best Healthcare Stocks
 | "Discover best trending healthcare stocks with 12Stocks.com." |
| - Subu Vdaygiri, Founder, 12Stocks.com |
| In a hurry? Healthcare Stocks Lists: Performance Trends Table, Stock Charts
Sort Healthcare stocks: Daily, Weekly, Year-to-Date, Market Cap & Trends. Filter Healthcare stocks list by size:All Healthcare Large Mid-Range Small |
| 12Stocks.com Healthcare Stocks Performances & Trends Daily | |||||||||
|
|  The overall Smart Investing & Trading Score is 52 (0-bearish to 100-bullish) which puts Healthcare sector in short term neutral trend. The Smart Investing & Trading Score from previous trading session is 38 and hence an improvement of trend.
| ||||||||
Here are the Smart Investing & Trading Scores of the most requested Healthcare stocks at 12Stocks.com (click stock name for detailed review):
|


| 12Stocks.com: Investing in Healthcare sector with Stocks | |
|
The following table helps investors and traders sort through current performance and trends (as measured by Smart Investing & Trading Score) of various
stocks in the Healthcare sector. Quick View: Move mouse or cursor over stock symbol (ticker) to view short-term Technical chart and over stock name to view long term chart. Click on  to add stock symbol to your watchlist and to add stock symbol to your watchlist and  to view watchlist. Click on any ticker or stock name for detailed market intelligence report for that stock. to view watchlist. Click on any ticker or stock name for detailed market intelligence report for that stock. |
12Stocks.com Performance of Stocks in Healthcare Sector
| Ticker | Stock Name | Watchlist | Category | Recent Price | Smart Investing & Trading Score | Change % | YTD Change% |
| DNLI | Denali |   | Biotechnology | 16.11 | 30 | 0.75 | -24.93% |
| AKBA | Akebia | | Biotechnology | 1.37 | 17 | 0.74 | 10.48% |
| ACHC | Acadia | | Specialized | 70.74 | 25 | 0.68 | -9.03% |
| UBX | Unity Biotechnology | | Biotechnology | 1.49 | 10 | 0.68 | -22.80% |
| HALO | Halozyme | | Biotechnology | 38.97 | 75 | 0.67 | 5.44% |
| CALT | Calliditas | | Drug Manufacturers Specialty & Generic | 18.20 | 17 | 0.65 | -29.10% |
| ABOS | Acumen | | Biotechnology | 3.15 | 22 | 0.64 | -17.97% |
| DCPH | Deciphera | | Biotechnology | 14.67 | 63 | 0.62 | -9.05% |
| ZBH | Zimmer Biomet | | Equipment | 121.52 | 32 | 0.61 | -0.15% |
| AMGN | Amgen | | Biotechnology | 273.54 | 64 | 0.60 | -5.03% |
| CTMX | CytomX | | Biotechnology | 1.68 | 36 | 0.60 | 8.39% |
| HLN | Haleon | | Drug Manufacturers - Specialty & Generic | 8.41 | 90 | 0.60 | 2.19% |
| CCCC | C4 | | Biotechnology | 6.90 | 56 | 0.58 | 22.34% |
| ORIC | ORIC | | Biotechnology | 8.77 | 10 | 0.57 | -4.88% |
| AMRX | Amneal | | Pharmaceutical | 5.40 | 38 | 0.56 | -11.04% |
| RVNC | Revance | | Biotechnology | 3.66 | 20 | 0.55 | -58.36% |
| PETQ | PetIQ | | Pharmaceutical | 16.60 | 49 | 0.55 | -15.95% |
| PHAT | Phathom | | Biotechnology | 9.06 | 43 | 0.55 | -0.77% |
| NVST | Envista | | Instruments | 20.22 | 59 | 0.55 | -15.96% |
| BNTX | BioNTech SE | | Biotechnology | 88.49 | 59 | 0.55 | -16.16% |
| PRLD | Prelude | | Biotechnology | 3.87 | 63 | 0.52 | -11.03% |
| ABT | Abbott | | Equipment | 107.59 | 32 | 0.49 | -2.25% |
| KZR | Kezar Life | | Biotechnology | 0.83 | 57 | 0.49 | -12.81% |
| BCYC | Bicycle | | Biotechnology | 22.68 | 54 | 0.49 | 25.44% |
| CIVI | Civitas | | Long-Term | 73.29 | 22 | 0.47 | 7.18% |
| For chart view version of above stock list: Chart View ➞ 0 - 25 , 25 - 50 , 50 - 75 , 75 - 100 , 100 - 125 , 125 - 150 , 150 - 175 , 175 - 200 , 200 - 225 , 225 - 250 , 250 - 275 , 275 - 300 , 300 - 325 , 325 - 350 , 350 - 375 , 375 - 400 , 400 - 425 , 425 - 450 , 450 - 475 , 475 - 500 , 500 - 525 , 525 - 550 , 550 - 575 , 575 - 600 , 600 - 625 , 625 - 650 , 650 - 675 , 675 - 700 , 700 - 725 | ||
 | Click To Change The Sort Order: By Market Cap or Company Size Performance: Year-to-date, Week and Day |  |
|
Get the most comprehensive stock market coverage daily at 12Stocks.com ➞ Best Stocks Today ➞ Best Stocks Weekly ➞ Best Stocks Year-to-Date ➞ Best Stocks Trends ➞  Best Stocks Today 12Stocks.com Best Nasdaq Stocks ➞ Best S&P 500 Stocks ➞ Best Tech Stocks ➞ Best Biotech Stocks ➞ |
| Detailed Overview of Healthcare Stocks |
| Healthcare Technical Overview, Leaders & Laggards, Top Healthcare ETF Funds & Detailed Healthcare Stocks List, Charts, Trends & More |
| Healthcare Sector: Technical Analysis, Trends & YTD Performance | |
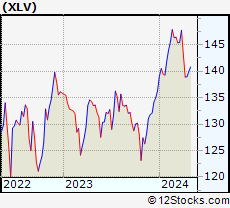
| Healthcare sector is composed of stocks
from pharmaceutical, biotech, diagnostics labs, insurance providers
and healthcare services. Healthcare sector, as represented by XLV, an exchange-traded fund [ETF] that holds basket of Healthcare stocks (e.g, Merck, Amgen) is up by 3.61% and is currently underperforming the overall market by -2.03% year-to-date. Below is a quick view of Technical charts and trends: |
|
 XLV Weekly Chart |
|
| Long Term Trend: Good | |
| Medium Term Trend: Not Good | |
 XLV Daily Chart |
|
| Short Term Trend: Very Good | |
| Overall Trend Score: 52 | |
| YTD Performance: 3.61% | |
| **Trend Scores & Views Are Only For Educational Purposes And Not For Investing | |
| 12Stocks.com: Top Performing Healthcare Sector Stocks | ||||||||||||||||||||||||||||||||||||||||||||||||
 The top performing Healthcare sector stocks year to date are
Now, more recently, over last week, the top performing Healthcare sector stocks on the move are


|
||||||||||||||||||||||||||||||||||||||||||||||||
| 12Stocks.com: Investing in Healthcare Sector using Exchange Traded Funds | |
|
The following table shows list of key exchange traded funds (ETF) that
help investors track Healthcare Index. For detailed view, check out our ETF Funds section of our website. Quick View: Move mouse or cursor over ETF symbol (ticker) to view short-term Technical chart and over ETF name to view long term chart. Click on ticker or stock name for detailed view. Click on to add stock symbol to your watchlist and to view watchlist. |
12Stocks.com List of ETFs that track Healthcare Index
| Ticker | ETF Name | Watchlist | Recent Price | Smart Investing & Trading Score | Change % | Week % | Year-to-date % |
| XLV | Health Care | | 141.30 | 52 | 1.30 | 1.69 | 3.61% |
| XBI | Biotech | | 84.69 | 32 | 2.28 | 2.25 | -5.15% |
| IBB | Biotechnology | | 128.02 | 32 | 1.51 | 2.65 | -5.76% |
| BBH | Biotech | | 157.29 | 49 | 1.77 | 3.24 | -4.85% |
| VHT | Health Care | | 257.82 | 52 | 1.29 | 1.77 | 2.84% |
| IYH | Healthcare | | 59.21 | 65 | 1.33 | 1.81 | 3.43% |
| IHF | Healthcare Providers | | 52.32 | 70 | 0.47 | 0.21 | -0.36% |
| IHI | Medical Devices | | 55.51 | 37 | 1.48 | 2.12 | 2.85% |
| BIB | Biotechnology | | 50.33 | 39 | 2.51 | 4.42 | -11.78% |
| BIS | Short Biotech | | 19.94 | 68 | -2.59 | -4.57 | 10.35% |
| XHE | Health Care Equipment | | 83.01 | 42 | 1.63 | 2.14 | -1.48% |
| CURE | Healthcare Bull 3X | | 108.12 | 39 | 3.52 | 4.64 | 6.27% |
| LABU | Biotech Bull 3X | | 91.98 | 32 | 6.42 | 6.89 | -24.59% |
| LABD | Biotech Bear 3X | | 10.07 | 42 | -6.33 | -6.76 | 3.92% |
| PSCH | SmallCap Health Care | | 41.22 | 42 | 2.05 | 2.58 | -3.7% |
| XHS | Health Care Services | | 88.75 | 75 | 1.49 | 1.91 | -0.22% |
| PTH | DWA Healthcare Momentum | | 40.17 | 35 | 2.11 | 1.62 | 2.63% |
| BTEC | Principal Healthcare Innovators | | 34.81 | 25 | 3.10 | 2.79 | -4.2% |
| RXL | Health Care | | 96.15 | 52 | 0.87 | 3.14 | 5.19% |
| RXD | Short Health Care | | 11.24 | 43 | -2.18 | -3.39 | -5.7% |
| 12Stocks.com: Charts, Trends, Fundamental Data and Performances of Healthcare Stocks | |
|
We now take in-depth look at all Healthcare stocks including charts, multi-period performances and overall trends (as measured by Smart Investing & Trading Score). One can sort Healthcare stocks (click link to choose) by Daily, Weekly and by Year-to-Date performances. Also, one can sort by size of the company or by market capitalization. |
| Select Your Default Chart Type: | |||||
| |||||
| Click on stock symbol or name for detailed view. Click on to add stock symbol to your watchlist and to view watchlist. Quick View: Move mouse or cursor over "Daily" to quickly view daily Technical stock chart and over "Weekly" to view weekly Technical stock chart. | |||||

 | DNLI Denali Therapeutics Inc. |
| Sector: Health Care | |
| SubSector: Biotechnology | |
| MarketCap: 2020.05 Millions | |
| Recent Price: 16.11 Smart Investing & Trading Score: 30 | |
| Day Percent Change: 0.75% Day Change: 0.12 | |
| Week Change: 0.81% Year-to-date Change: -24.9% | |
| DNLI Links: Profile News Message Board | |
| Charts:- Daily , Weekly | |
| Add DNLI to Watchlist: View: Get Complete DNLI Trend Analysis ➞ | |
 | AKBA Akebia Therapeutics, Inc. |
| Sector: Health Care | |
| SubSector: Biotechnology | |
| MarketCap: 794.285 Millions | |
| Recent Price: 1.37 Smart Investing & Trading Score: 17 | |
| Day Percent Change: 0.74% Day Change: 0.01 | |
| Week Change: 0.74% Year-to-date Change: 10.5% | |
| AKBA Links: Profile News Message Board | |
| Charts:- Daily , Weekly | |
| Add AKBA to Watchlist: View: Get Complete AKBA Trend Analysis ➞ | |
 | ACHC Acadia Healthcare Company, Inc. |
| Sector: Health Care | |
| SubSector: Specialized Health Services | |
| MarketCap: 1331.56 Millions | |
| Recent Price: 70.74 Smart Investing & Trading Score: 25 | |
| Day Percent Change: 0.68% Day Change: 0.48 | |
| Week Change: 0.83% Year-to-date Change: -9.0% | |
| ACHC Links: Profile News Message Board | |
| Charts:- Daily , Weekly | |
| Add ACHC to Watchlist: View: Get Complete ACHC Trend Analysis ➞ | |
 | UBX Unity Biotechnology, Inc. |
| Sector: Health Care | |
| SubSector: Biotechnology | |
| MarketCap: 254.985 Millions | |
| Recent Price: 1.49 Smart Investing & Trading Score: 10 | |
| Day Percent Change: 0.68% Day Change: 0.01 | |
| Week Change: -0.67% Year-to-date Change: -22.8% | |
| UBX Links: Profile News Message Board | |
| Charts:- Daily , Weekly | |
| Add UBX to Watchlist: View: Get Complete UBX Trend Analysis ➞ | |
 | HALO Halozyme Therapeutics, Inc. |
| Sector: Health Care | |
| SubSector: Biotechnology | |
| MarketCap: 2383.75 Millions | |
| Recent Price: 38.97 Smart Investing & Trading Score: 75 | |
| Day Percent Change: 0.67% Day Change: 0.26 | |
| Week Change: 0.85% Year-to-date Change: 5.4% | |
| HALO Links: Profile News Message Board | |
| Charts:- Daily , Weekly | |
| Add HALO to Watchlist: View: Get Complete HALO Trend Analysis ➞ | |
 | CALT Calliditas Therapeutics AB (publ) |
| Sector: Health Care | |
| SubSector: Drug Manufacturers Specialty & Generic | |
| MarketCap: 83487 Millions | |
| Recent Price: 18.20 Smart Investing & Trading Score: 17 | |
| Day Percent Change: 0.65% Day Change: 0.12 | |
| Week Change: 3.12% Year-to-date Change: -29.1% | |
| CALT Links: Profile News Message Board | |
| Charts:- Daily , Weekly | |
| Add CALT to Watchlist: View: Get Complete CALT Trend Analysis ➞ | |
 | ABOS Acumen Pharmaceuticals, Inc. |
| Sector: Health Care | |
| SubSector: Biotechnology | |
| MarketCap: 199 Millions | |
| Recent Price: 3.15 Smart Investing & Trading Score: 22 | |
| Day Percent Change: 0.64% Day Change: 0.02 | |
| Week Change: 0% Year-to-date Change: -18.0% | |
| ABOS Links: Profile News Message Board | |
| Charts:- Daily , Weekly | |
| Add ABOS to Watchlist: View: Get Complete ABOS Trend Analysis ➞ | |
 | DCPH Deciphera Pharmaceuticals, Inc. |
| Sector: Health Care | |
| SubSector: Biotechnology | |
| MarketCap: 2329.95 Millions | |
| Recent Price: 14.67 Smart Investing & Trading Score: 63 | |
| Day Percent Change: 0.62% Day Change: 0.09 | |
| Week Change: -0.14% Year-to-date Change: -9.1% | |
| DCPH Links: Profile News Message Board | |
| Charts:- Daily , Weekly | |
| Add DCPH to Watchlist: View: Get Complete DCPH Trend Analysis ➞ | |
 | ZBH Zimmer Biomet Holdings, Inc. |
| Sector: Health Care | |
| SubSector: Medical Appliances & Equipment | |
| MarketCap: 19339.4 Millions | |
| Recent Price: 121.52 Smart Investing & Trading Score: 32 | |
| Day Percent Change: 0.61% Day Change: 0.74 | |
| Week Change: 1.75% Year-to-date Change: -0.2% | |
| ZBH Links: Profile News Message Board | |
| Charts:- Daily , Weekly | |
| Add ZBH to Watchlist: View: Get Complete ZBH Trend Analysis ➞ | |
 | AMGN Amgen Inc. |
| Sector: Health Care | |
| SubSector: Biotechnology | |
| MarketCap: 121030 Millions | |
| Recent Price: 273.54 Smart Investing & Trading Score: 64 | |
| Day Percent Change: 0.60% Day Change: 1.63 | |
| Week Change: 1.71% Year-to-date Change: -5.0% | |
| AMGN Links: Profile News Message Board | |
| Charts:- Daily , Weekly | |
| Add AMGN to Watchlist: View: Get Complete AMGN Trend Analysis ➞ | |
 | CTMX CytomX Therapeutics, Inc. |
| Sector: Health Care | |
| SubSector: Biotechnology | |
| MarketCap: 264.885 Millions | |
| Recent Price: 1.68 Smart Investing & Trading Score: 36 | |
| Day Percent Change: 0.60% Day Change: 0.01 | |
| Week Change: 0.6% Year-to-date Change: 8.4% | |
| CTMX Links: Profile News Message Board | |
| Charts:- Daily , Weekly | |
| Add CTMX to Watchlist: View: Get Complete CTMX Trend Analysis ➞ | |
 | HLN Haleon plc |
| Sector: Health Care | |
| SubSector: Drug Manufacturers - Specialty & Generic | |
| MarketCap: 38310 Millions | |
| Recent Price: 8.41 Smart Investing & Trading Score: 90 | |
| Day Percent Change: 0.60% Day Change: 0.05 | |
| Week Change: 2.31% Year-to-date Change: 2.2% | |
| HLN Links: Profile News Message Board | |
| Charts:- Daily , Weekly | |
| Add HLN to Watchlist: View: Get Complete HLN Trend Analysis ➞ | |
 | CCCC C4 Therapeutics, Inc. |
| Sector: Health Care | |
| SubSector: Biotechnology | |
| MarketCap: 12587 Millions | |
| Recent Price: 6.90 Smart Investing & Trading Score: 56 | |
| Day Percent Change: 0.58% Day Change: 0.04 | |
| Week Change: 1.47% Year-to-date Change: 22.3% | |
| CCCC Links: Profile News Message Board | |
| Charts:- Daily , Weekly | |
| Add CCCC to Watchlist: View: Get Complete CCCC Trend Analysis ➞ | |
 | ORIC ORIC Pharmaceuticals, Inc. |
| Sector: Health Care | |
| SubSector: Biotechnology | |
| MarketCap: 12787 Millions | |
| Recent Price: 8.77 Smart Investing & Trading Score: 10 | |
| Day Percent Change: 0.57% Day Change: 0.05 | |
| Week Change: -4.05% Year-to-date Change: -4.9% | |
| ORIC Links: Profile News Message Board | |
| Charts:- Daily , Weekly | |
| Add ORIC to Watchlist: View: Get Complete ORIC Trend Analysis ➞ | |
 | AMRX Amneal Pharmaceuticals, Inc. |
| Sector: Health Care | |
| SubSector: Drug Related Products | |
| MarketCap: 1218.13 Millions | |
| Recent Price: 5.40 Smart Investing & Trading Score: 38 | |
| Day Percent Change: 0.56% Day Change: 0.03 | |
| Week Change: -0.37% Year-to-date Change: -11.0% | |
| AMRX Links: Profile News Message Board | |
| Charts:- Daily , Weekly | |
| Add AMRX to Watchlist: View: Get Complete AMRX Trend Analysis ➞ | |
 | RVNC Revance Therapeutics, Inc. |
| Sector: Health Care | |
| SubSector: Biotechnology | |
| MarketCap: 854.185 Millions | |
| Recent Price: 3.66 Smart Investing & Trading Score: 20 | |
| Day Percent Change: 0.55% Day Change: 0.02 | |
| Week Change: -3.17% Year-to-date Change: -58.4% | |
| RVNC Links: Profile News Message Board | |
| Charts:- Daily , Weekly | |
| Add RVNC to Watchlist: View: Get Complete RVNC Trend Analysis ➞ | |
 | PETQ PetIQ, Inc. |
| Sector: Health Care | |
| SubSector: Drugs - Generic | |
| MarketCap: 587.585 Millions | |
| Recent Price: 16.60 Smart Investing & Trading Score: 49 | |
| Day Percent Change: 0.55% Day Change: 0.09 | |
| Week Change: 1.97% Year-to-date Change: -16.0% | |
| PETQ Links: Profile News Message Board | |
| Charts:- Daily , Weekly | |
| Add PETQ to Watchlist: View: Get Complete PETQ Trend Analysis ➞ | |
 | PHAT Phathom Pharmaceuticals, Inc. |
| Sector: Health Care | |
| SubSector: Biotechnology | |
| MarketCap: 728.785 Millions | |
| Recent Price: 9.06 Smart Investing & Trading Score: 43 | |
| Day Percent Change: 0.55% Day Change: 0.05 | |
| Week Change: 0.89% Year-to-date Change: -0.8% | |
| PHAT Links: Profile News Message Board | |
| Charts:- Daily , Weekly | |
| Add PHAT to Watchlist: View: Get Complete PHAT Trend Analysis ➞ | |
 | NVST Envista Holdings Corporation |
| Sector: Health Care | |
| SubSector: Medical Instruments & Supplies | |
| MarketCap: 2075.8 Millions | |
| Recent Price: 20.22 Smart Investing & Trading Score: 59 | |
| Day Percent Change: 0.55% Day Change: 0.11 | |
| Week Change: 1.3% Year-to-date Change: -16.0% | |
| NVST Links: Profile News Message Board | |
| Charts:- Daily , Weekly | |
| Add NVST to Watchlist: View: Get Complete NVST Trend Analysis ➞ | |
 | BNTX BioNTech SE |
| Sector: Health Care | |
| SubSector: Biotechnology | |
| MarketCap: 11933.7 Millions | |
| Recent Price: 88.49 Smart Investing & Trading Score: 59 | |
| Day Percent Change: 0.55% Day Change: 0.48 | |
| Week Change: 1.92% Year-to-date Change: -16.2% | |
| BNTX Links: Profile News Message Board | |
| Charts:- Daily , Weekly | |
| Add BNTX to Watchlist: View: Get Complete BNTX Trend Analysis ➞ | |
 | PRLD Prelude Therapeutics Incorporated |
| Sector: Health Care | |
| SubSector: Biotechnology | |
| MarketCap: 26087 Millions | |
| Recent Price: 3.87 Smart Investing & Trading Score: 63 | |
| Day Percent Change: 0.52% Day Change: 0.02 | |
| Week Change: 8.4% Year-to-date Change: -11.0% | |
| PRLD Links: Profile News Message Board | |
| Charts:- Daily , Weekly | |
| Add PRLD to Watchlist: View: Get Complete PRLD Trend Analysis ➞ | |
 | ABT Abbott Laboratories |
| Sector: Health Care | |
| SubSector: Medical Appliances & Equipment | |
| MarketCap: 125288 Millions | |
| Recent Price: 107.59 Smart Investing & Trading Score: 32 | |
| Day Percent Change: 0.49% Day Change: 0.52 | |
| Week Change: 0.29% Year-to-date Change: -2.3% | |
| ABT Links: Profile News Message Board | |
| Charts:- Daily , Weekly | |
| Add ABT to Watchlist: View: Get Complete ABT Trend Analysis ➞ | |
 | KZR Kezar Life Sciences, Inc. |
| Sector: Health Care | |
| SubSector: Biotechnology | |
| MarketCap: 174.885 Millions | |
| Recent Price: 0.83 Smart Investing & Trading Score: 57 | |
| Day Percent Change: 0.49% Day Change: 0.00 | |
| Week Change: 4.89% Year-to-date Change: -12.8% | |
| KZR Links: Profile News Message Board | |
| Charts:- Daily , Weekly | |
| Add KZR to Watchlist: View: Get Complete KZR Trend Analysis ➞ | |
 | BCYC Bicycle Therapeutics plc |
| Sector: Health Care | |
| SubSector: Biotechnology | |
| MarketCap: 214.485 Millions | |
| Recent Price: 22.68 Smart Investing & Trading Score: 54 | |
| Day Percent Change: 0.49% Day Change: 0.11 | |
| Week Change: -3.12% Year-to-date Change: 25.4% | |
| BCYC Links: Profile News Message Board | |
| Charts:- Daily , Weekly | |
| Add BCYC to Watchlist: View: Get Complete BCYC Trend Analysis ➞ | |
 | CIVI Civitas Solutions, Inc. |
| Sector: Health Care | |
| SubSector: Long-Term Care Facilities | |
| MarketCap: 625.74 Millions | |
| Recent Price: 73.29 Smart Investing & Trading Score: 22 | |
| Day Percent Change: 0.47% Day Change: 0.34 | |
| Week Change: 0.91% Year-to-date Change: 7.2% | |
| CIVI Links: Profile News Message Board | |
| Charts:- Daily , Weekly | |
| Add CIVI to Watchlist: View: Get Complete CIVI Trend Analysis ➞ | |
| For tabular summary view of above stock list: Summary View ➞ 0 - 25 , 25 - 50 , 50 - 75 , 75 - 100 , 100 - 125 , 125 - 150 , 150 - 175 , 175 - 200 , 200 - 225 , 225 - 250 , 250 - 275 , 275 - 300 , 300 - 325 , 325 - 350 , 350 - 375 , 375 - 400 , 400 - 425 , 425 - 450 , 450 - 475 , 475 - 500 , 500 - 525 , 525 - 550 , 550 - 575 , 575 - 600 , 600 - 625 , 625 - 650 , 650 - 675 , 675 - 700 , 700 - 725 | ||
| Click To Change The Sort Order: By Market Cap or Company Size Performance: Year-to-date, Week and Day | |
| Select Chart Type: | ||
|
Best Stocks Today 12Stocks.com |
© 2024 12Stocks.com Terms & Conditions Privacy Contact Us
All Information Provided Only For Education And Not To Be Used For Investing or Trading. See Terms & Conditions


One More Thing ... Get Best Stocks Delivered Daily!
Never Ever Miss A Move With Our Top Ten Stocks Lists
Find Best Stocks In Any Market - Bull or Bear Market
Take A Peek At Our Top Ten Stocks Lists: Daily, Weekly, Year-to-Date & Top Trends
Find Best Stocks In Any Market - Bull or Bear Market
Take A Peek At Our Top Ten Stocks Lists: Daily, Weekly, Year-to-Date & Top Trends
Healthcare Stocks With Best Up Trends [0-bearish to 100-bullish]: Pieris [100], PureTech Health[100], Day One[100], Hutchison China[100], Oscar Health[100], Agios [100], BioLife [100], Quest Diagnostics[100], Brookdale Senior[100], Avadel [100], Fresenius [100]
Best Healthcare Stocks Year-to-Date:
Pieris [6493.41%], Precision BioSciences[2702.74%], Inovio [1933.33%], Assembly Biosciences[1518.1%], Aurora Cannabis[1458.17%], Adverum Biotechnologies[1361.21%], NuCana [1252.27%], Affimed N.V[756%], Agenus [680.29%], CareMax [650.52%], Corbus [524.83%] Best Healthcare Stocks This Week:
Pieris [8175.86%], CareMax [41.63%], VolitionRx [37.99%], Seres [35.74%], BeyondSpring [27.22%], GeneDx [24.95%], ProKidney [24.75%], Agenus [21.66%], MSP Recovery[19.2%], Annovis Bio[18.8%], Generation Bio[17.69%] Best Healthcare Stocks Daily:
Pieris [8113.55%], VolitionRx [41.10%], Seres [21.68%], Aurora Cannabis[18.15%], Generation Bio[16.01%], Concord [15.93%], GeneDx [15.93%], Canopy Growth[15.03%], ChromaDex [14.86%], IGM Biosciences[14.07%], CareMax [13.40%]