
 Login Sign Up


| |||||
 |  | ||||

| 12Stocks.com Market Intelligence |
Best Healthcare Stocks
 | "Discover best trending healthcare stocks with 12Stocks.com." |
| - Subu Vdaygiri, Founder, 12Stocks.com |
| In a hurry? Healthcare Stocks Lists: Performance Trends Table, Stock Charts
Sort Healthcare stocks: Daily, Weekly, Year-to-Date, Market Cap & Trends. Filter Healthcare stocks list by size:All Healthcare Large Mid-Range Small |
| 12Stocks.com Healthcare Stocks Performances & Trends Daily | |||||||||
|
|  The overall Smart Investing & Trading Score is 90 (0-bearish to 100-bullish) which puts Healthcare sector in short term bullish trend. The Smart Investing & Trading Score from previous trading session is 90 and an improvement of trend continues.
| ||||||||
Here are the Smart Investing & Trading Scores of the most requested Healthcare stocks at 12Stocks.com (click stock name for detailed review):
|


| 12Stocks.com: Investing in Healthcare sector with Stocks | |
|
The following table helps investors and traders sort through current performance and trends (as measured by Smart Investing & Trading Score) of various
stocks in the Healthcare sector. Quick View: Move mouse or cursor over stock symbol (ticker) to view short-term Technical chart and over stock name to view long term chart. Click on  to add stock symbol to your watchlist and to add stock symbol to your watchlist and  to view watchlist. Click on any ticker or stock name for detailed market intelligence report for that stock. to view watchlist. Click on any ticker or stock name for detailed market intelligence report for that stock. |
12Stocks.com Performance of Stocks in Healthcare Sector
| Ticker | Stock Name | Watchlist | Category | Recent Price | Smart Investing & Trading Score | Change % | YTD Change% |
| AVXL | Anavex Life |   | Biotechnology | 9.64 | 60 | -1.34 | -11.08% |
| VOR | Vor Biopharma | | Biotechnology | 1.97 | 30 | -1.36 | 95.50% |
| OSUR | OraSure Technologies | | Instruments | 3.31 | 70 | -1.38 | -20.78% |
| DVA | DaVita | | Specialized | 135.82 | 40 | -1.41 | -22.92% |
| BFLY | Butterfly Network | | Medical Devices | 1.61 | 40 | -1.42 | -55.45% |
| QTRX | Quanterix | | Biotechnology | 4.55 | 20 | -1.43 | -54.47% |
| DXCM | DexCom | | Laboratories | 74.24 | 0 | -1.46 | -14.50% |
| A | Agilent Technologies | | Laboratories | 123.81 | 90 | -1.47 | -17.94% |
| NEPH | Nephros | | Instruments | 3.73 | 70 | -1.47 | 173.47% |
| CYH | Community Health | | Hospitals | 2.76 | 80 | -1.48 | -10.70% |
| EHAB | Enhabit | | Medical Care Facilities | 7.88 | 15 | -1.48 | 2.30% |
| TMO | Thermo Fisher | | Laboratories | 485.27 | 70 | -1.51 | -18.66% |
| AXON | Axovant Sciences | | Biotechnology | 735.94 | 0 | -1.52 | 12.84% |
| VXRT | Vaxart | | Biotechnology | 0.39 | 80 | -1.52 | -46.08% |
| MNOV | MediciNova | | Biotechnology | 1.31 | 30 | -1.53 | -38.57% |
| RPRX | Royalty Pharma | | Biotechnology | 35.98 | 60 | -1.55 | 44.24% |
| RGEN | Repligen | | Biotechnology | 122.32 | 20 | -1.57 | -16.88% |
| USNA | USANA Health | | Pharmaceutical | 31.91 | 60 | -1.57 | -14.66% |
| PNTG | Pennant | | Long-Term | 24.01 | 0 | -1.63 | -6.67% |
| OABI | OmniAb | | Biotechnology | 1.60 | 56 | -1.64 | -49.15% |
| LCTX | Lineage Cell | | Biotechnology | 1.17 | 50 | -1.68 | 132.84% |
| KIDS | OrthoPediatrics | | Equipment | 21.36 | 50 | -1.69 | -17.39% |
| PEN | Penumbra | | Instruments | 272.64 | 80 | -1.70 | 5.85% |
| AVNS | Avanos | | Instruments | 11.94 | 80 | -1.76 | -29.90% |
| FATE | Fate | | Biotechnology | 1.04 | 20 | -1.77 | -32.73% |
| For chart view version of above stock list: Chart View ➞ 0 - 25 , 25 - 50 , 50 - 75 , 75 - 100 , 100 - 125 , 125 - 150 , 150 - 175 , 175 - 200 , 200 - 225 , 225 - 250 , 250 - 275 , 275 - 300 , 300 - 325 , 325 - 350 , 350 - 375 , 375 - 400 , 400 - 425 , 425 - 450 , 450 - 475 , 475 - 500 , 500 - 525 , 525 - 550 , 550 - 575 , 575 - 600 , 600 - 625 | ||
 | Click To Change The Sort Order: By Market Cap or Company Size Performance: Year-to-date, Week and Day |  |
|
Get the most comprehensive stock market coverage daily at 12Stocks.com ➞ Best Stocks Today ➞ Best Stocks Weekly ➞ Best Stocks Year-to-Date ➞ Best Stocks Trends ➞  Best Stocks Today 12Stocks.com Best Nasdaq Stocks ➞ Best S&P 500 Stocks ➞ Best Tech Stocks ➞ Best Biotech Stocks ➞ |
| Detailed Overview of Healthcare Stocks |
| Healthcare Technical Overview, Leaders & Laggards, Top Healthcare ETF Funds & Detailed Healthcare Stocks List, Charts, Trends & More |
| Healthcare Sector: Technical Analysis, Trends & YTD Performance | |
| Healthcare sector is composed of stocks
from pharmaceutical, biotech, diagnostics labs, insurance providers
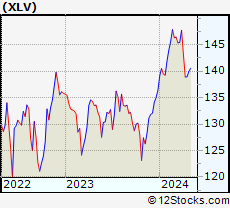
and healthcare services. Healthcare sector, as represented by XLV, an exchange-traded fund [ETF] that holds basket of Healthcare stocks (e.g, Merck, Amgen) is down by -5.53% and is currently underperforming the overall market by -12.05% year-to-date. Below is a quick view of Technical charts and trends: |
|
 XLV Weekly Chart |
|
| Long Term Trend: Good | |
| Medium Term Trend: Good | |
 XLV Daily Chart |
|
| Short Term Trend: Very Good | |
| Overall Trend Score: 90 | |
| YTD Performance: -5.53% | |
| **Trend Scores & Views Are Only For Educational Purposes And Not For Investing | |
| 12Stocks.com: Top Performing Healthcare Sector Stocks | |||||||||||||||||||||||||||||||||||||||||||||||
 The top performing Healthcare sector stocks year to date are
Now, more recently, over last week, the top performing Healthcare sector stocks on the move are


|
|||||||||||||||||||||||||||||||||||||||||||||||
| 12Stocks.com: Investing in Healthcare Sector using Exchange Traded Funds | |
|
The following table shows list of key exchange traded funds (ETF) that
help investors track Healthcare Index. For detailed view, check out our ETF Funds section of our website. Quick View: Move mouse or cursor over ETF symbol (ticker) to view short-term Technical chart and over ETF name to view long term chart. Click on ticker or stock name for detailed view. Click on to add stock symbol to your watchlist and to view watchlist. |
12Stocks.com List of ETFs that track Healthcare Index
| Ticker | ETF Name | Watchlist | Recent Price | Smart Investing & Trading Score | Change % | Week % | Year-to-date % |
| XLV | Health Care | | 137.56 | 90 | 0.09 | 0.09 | -5.53% |
| XBI | Biotech | | 92.88 | 100 | 3.37 | 3.37 | 0.24% |
| IBB | Biotechnology | | 138.22 | 100 | 0.73 | 0.73 | 0.89% |
| BBH | Biotech | | 165.18 | 70 | 0.61 | 0.53 | 1.51% |
| VHT | Health Care | | 255.08 | 90 | -0.22 | 2.2 | 0.9% |
| IYH | Healthcare | | 57.87 | 90 | -0.31 | 2.14 | -0.44% |
| IHF | Healthcare Providers | | 47.35 | 80 | 0.25 | 0.25 | -10.02% |
| IHI | Medical Devices | | 62.15 | 30 | -1.09 | 0.52 | 6.26% |
| BIB | Biotechnology | | 55.26 | 100 | 1.03 | 2.47 | 11.53% |
| BIS | Short Biotech | | 14.42 | 0 | -0.99 | -2.37 | -20.83% |
| XHE | Health Care Equipment | | 82.13 | 50 | -0.65 | 0.56 | -8.82% |
| CURE | Healthcare Bull 3X | | 80.67 | 80 | -1.02 | 6.93 | -12.21% |
| LABU | Biotech Bull 3X | | 69.35 | 100 | 2.38 | 0.61 | -22.08% |
| LABD | Biotech Bear 3X | | 5.75 | 10 | -2.55 | -1.37 | -19.84% |
| PSCH | SmallCap Health Care | | 41.34 | 100 | 0.06 | 0.86 | -9.24% |
| XHS | Health Care Services | | 99.36 | 90 | 0.48 | 2.14 | 7.86% |
| PTH | DWA Healthcare Momentum | | 39.81 | 90 | 0.67 | 0.47 | -1.58% |
| RXL | Health Care | | 41.55 | 80 | 1.45 | 2.54 | -15.15% |
| RXD | Short Health Care | | 11.74 | 20 | -1.42 | -2.61 | 10.49% |
| 12Stocks.com: Charts, Trends, Fundamental Data and Performances of Healthcare Stocks | |
|
We now take in-depth look at all Healthcare stocks including charts, multi-period performances and overall trends (as measured by Smart Investing & Trading Score). One can sort Healthcare stocks (click link to choose) by Daily, Weekly and by Year-to-Date performances. Also, one can sort by size of the company or by market capitalization. |
| Select Your Default Chart Type: | |||||
| |||||
| Click on stock symbol or name for detailed view. Click on to add stock symbol to your watchlist and to view watchlist. Quick View: Move mouse or cursor over "Daily" to quickly view daily Technical stock chart and over "Weekly" to view weekly Technical stock chart. | |||||

 | AVXL Anavex Life Sciences Corp. |
| Sector: Health Care | |
| SubSector: Biotechnology | |
| MarketCap: 175.985 Millions | |
| Recent Price: 9.64 Smart Investing & Trading Score: 60 | |
| Day Percent Change: -1.34% Day Change: -0.13 | |
| Week Change: -5.54% Year-to-date Change: -11.1% | |
| AVXL Links: Profile News Message Board | |
| Charts:- Daily , Weekly | |
| Add AVXL to Watchlist: View: Get Complete AVXL Trend Analysis ➞ | |
 | VOR Vor Biopharma Inc. |
| Sector: Health Care | |
| SubSector: Biotechnology | |
| MarketCap: 224 Millions | |
| Recent Price: 1.97 Smart Investing & Trading Score: 30 | |
| Day Percent Change: -1.36% Day Change: -0.03 | |
| Week Change: 9.6% Year-to-date Change: 95.5% | |
| VOR Links: Profile News Message Board | |
| Charts:- Daily , Weekly | |
| Add VOR to Watchlist: View: Get Complete VOR Trend Analysis ➞ | |
 | OSUR OraSure Technologies, Inc. |
| Sector: Health Care | |
| SubSector: Medical Instruments & Supplies | |
| MarketCap: 468.26 Millions | |
| Recent Price: 3.31 Smart Investing & Trading Score: 70 | |
| Day Percent Change: -1.38% Day Change: -0.04 | |
| Week Change: 3.25% Year-to-date Change: -20.8% | |
| OSUR Links: Profile News Message Board | |
| Charts:- Daily , Weekly | |
| Add OSUR to Watchlist: View: Get Complete OSUR Trend Analysis ➞ | |
 | DVA DaVita Inc. |
| Sector: Health Care | |
| SubSector: Specialized Health Services | |
| MarketCap: 8954.36 Millions | |
| Recent Price: 135.82 Smart Investing & Trading Score: 40 | |
| Day Percent Change: -1.41% Day Change: -1.94 | |
| Week Change: -1.41% Year-to-date Change: -22.9% | |
| DVA Links: Profile News Message Board | |
| Charts:- Daily , Weekly | |
| Add DVA to Watchlist: View: Get Complete DVA Trend Analysis ➞ | |
 | BFLY Butterfly Network, Inc. |
| Sector: Health Care | |
| SubSector: Medical Devices | |
| MarketCap: 461 Millions | |
| Recent Price: 1.61 Smart Investing & Trading Score: 40 | |
| Day Percent Change: -1.42% Day Change: -0.02 | |
| Week Change: -1.42% Year-to-date Change: -55.5% | |
| BFLY Links: Profile News Message Board | |
| Charts:- Daily , Weekly | |
| Add BFLY to Watchlist: View: Get Complete BFLY Trend Analysis ➞ | |
 | QTRX Quanterix Corporation |
| Sector: Health Care | |
| SubSector: Biotechnology | |
| MarketCap: 448.685 Millions | |
| Recent Price: 4.55 Smart Investing & Trading Score: 20 | |
| Day Percent Change: -1.43% Day Change: -0.07 | |
| Week Change: 6.61% Year-to-date Change: -54.5% | |
| QTRX Links: Profile News Message Board | |
| Charts:- Daily , Weekly | |
| Add QTRX to Watchlist: View: Get Complete QTRX Trend Analysis ➞ | |
 | DXCM DexCom, Inc. |
| Sector: Health Care | |
| SubSector: Medical Laboratories & Research | |
| MarketCap: 19559 Millions | |
| Recent Price: 74.24 Smart Investing & Trading Score: 0 | |
| Day Percent Change: -1.46% Day Change: -1.1 | |
| Week Change: -1.46% Year-to-date Change: -14.5% | |
| DXCM Links: Profile News Message Board | |
| Charts:- Daily , Weekly | |
| Add DXCM to Watchlist: View: Get Complete DXCM Trend Analysis ➞ | |
 | A Agilent Technologies, Inc. |
| Sector: Health Care | |
| SubSector: Medical Laboratories & Research | |
| MarketCap: 22337.9 Millions | |
| Recent Price: 123.81 Smart Investing & Trading Score: 90 | |
| Day Percent Change: -1.47% Day Change: -1.85 | |
| Week Change: -1.47% Year-to-date Change: -17.9% | |
| A Links: Profile News Message Board | |
| Charts:- Daily , Weekly | |
| Add A to Watchlist: View: Get Complete A Trend Analysis ➞ | |
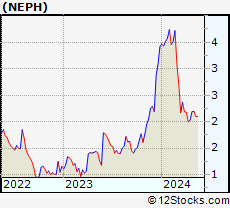 | NEPH Nephros, Inc. |
| Sector: Health Care | |
| SubSector: Medical Instruments & Supplies | |
| MarketCap: 69.486 Millions | |
| Recent Price: 3.73 Smart Investing & Trading Score: 70 | |
| Day Percent Change: -1.47% Day Change: -0.06 | |
| Week Change: 0.5% Year-to-date Change: 173.5% | |
| NEPH Links: Profile News Message Board | |
| Charts:- Daily , Weekly | |
| Add NEPH to Watchlist: View: Get Complete NEPH Trend Analysis ➞ | |
 | CYH Community Health Systems, Inc. |
| Sector: Health Care | |
| SubSector: Hospitals | |
| MarketCap: 371.546 Millions | |
| Recent Price: 2.76 Smart Investing & Trading Score: 80 | |
| Day Percent Change: -1.48% Day Change: -0.04 | |
| Week Change: -2.2% Year-to-date Change: -10.7% | |
| CYH Links: Profile News Message Board | |
| Charts:- Daily , Weekly | |
| Add CYH to Watchlist: View: Get Complete CYH Trend Analysis ➞ | |
 | EHAB Enhabit, Inc. |
| Sector: Health Care | |
| SubSector: Medical Care Facilities | |
| MarketCap: 569 Millions | |
| Recent Price: 7.88 Smart Investing & Trading Score: 15 | |
| Day Percent Change: -1.48% Day Change: -0.12 | |
| Week Change: 8.12% Year-to-date Change: 2.3% | |
| EHAB Links: Profile News Message Board | |
| Charts:- Daily , Weekly | |
| Add EHAB to Watchlist: View: Get Complete EHAB Trend Analysis ➞ | |
 | TMO Thermo Fisher Scientific Inc. |
| Sector: Health Care | |
| SubSector: Medical Laboratories & Research | |
| MarketCap: 112999 Millions | |
| Recent Price: 485.27 Smart Investing & Trading Score: 70 | |
| Day Percent Change: -1.51% Day Change: -7.45 | |
| Week Change: -1.51% Year-to-date Change: -18.7% | |
| TMO Links: Profile News Message Board | |
| Charts:- Daily , Weekly | |
| Add TMO to Watchlist: View: Get Complete TMO Trend Analysis ➞ | |
 | AXON Axovant Sciences Ltd. |
| Sector: Health Care | |
| SubSector: Biotechnology | |
| MarketCap: 1492.04 Millions | |
| Recent Price: 735.94 Smart Investing & Trading Score: 0 | |
| Day Percent Change: -1.52% Day Change: -11.35 | |
| Week Change: -1.52% Year-to-date Change: 12.8% | |
| AXON Links: Profile News Message Board | |
| Charts:- Daily , Weekly | |
| Add AXON to Watchlist: View: Get Complete AXON Trend Analysis ➞ | |
 | VXRT Vaxart, Inc. |
| Sector: Health Care | |
| SubSector: Biotechnology | |
| MarketCap: 129.785 Millions | |
| Recent Price: 0.39 Smart Investing & Trading Score: 80 | |
| Day Percent Change: -1.52% Day Change: -0.01 | |
| Week Change: -0.83% Year-to-date Change: -46.1% | |
| VXRT Links: Profile News Message Board | |
| Charts:- Daily , Weekly | |
| Add VXRT to Watchlist: View: Get Complete VXRT Trend Analysis ➞ | |
 | MNOV MediciNova, Inc. |
| Sector: Health Care | |
| SubSector: Biotechnology | |
| MarketCap: 137.685 Millions | |
| Recent Price: 1.31 Smart Investing & Trading Score: 30 | |
| Day Percent Change: -1.53% Day Change: -0.02 | |
| Week Change: -0.77% Year-to-date Change: -38.6% | |
| MNOV Links: Profile News Message Board | |
| Charts:- Daily , Weekly | |
| Add MNOV to Watchlist: View: Get Complete MNOV Trend Analysis ➞ | |
 | RPRX Royalty Pharma plc |
| Sector: Health Care | |
| SubSector: Biotechnology | |
| MarketCap: 28457 Millions | |
| Recent Price: 35.98 Smart Investing & Trading Score: 60 | |
| Day Percent Change: -1.55% Day Change: -0.57 | |
| Week Change: -0.52% Year-to-date Change: 44.2% | |
| RPRX Links: Profile News Message Board | |
| Charts:- Daily , Weekly | |
| Add RPRX to Watchlist: View: Get Complete RPRX Trend Analysis ➞ | |
 | RGEN Repligen Corporation |
| Sector: Health Care | |
| SubSector: Biotechnology | |
| MarketCap: 4711.75 Millions | |
| Recent Price: 122.32 Smart Investing & Trading Score: 20 | |
| Day Percent Change: -1.57% Day Change: -1.91 | |
| Week Change: -5.52% Year-to-date Change: -16.9% | |
| RGEN Links: Profile News Message Board | |
| Charts:- Daily , Weekly | |
| Add RGEN to Watchlist: View: Get Complete RGEN Trend Analysis ➞ | |
 | USNA USANA Health Sciences, Inc. |
| Sector: Health Care | |
| SubSector: Drug Related Products | |
| MarketCap: 1185.13 Millions | |
| Recent Price: 31.91 Smart Investing & Trading Score: 60 | |
| Day Percent Change: -1.57% Day Change: -0.49 | |
| Week Change: 0.33% Year-to-date Change: -14.7% | |
| USNA Links: Profile News Message Board | |
| Charts:- Daily , Weekly | |
| Add USNA to Watchlist: View: Get Complete USNA Trend Analysis ➞ | |
 | PNTG The Pennant Group, Inc. |
| Sector: Health Care | |
| SubSector: Long-Term Care Facilities | |
| MarketCap: 451.786 Millions | |
| Recent Price: 24.01 Smart Investing & Trading Score: 0 | |
| Day Percent Change: -1.63% Day Change: -0.41 | |
| Week Change: 0.2% Year-to-date Change: -6.7% | |
| PNTG Links: Profile News Message Board | |
| Charts:- Daily , Weekly | |
| Add PNTG to Watchlist: View: Get Complete PNTG Trend Analysis ➞ | |
 | OABI OmniAb, Inc. |
| Sector: Health Care | |
| SubSector: Biotechnology | |
| MarketCap: 570 Millions | |
| Recent Price: 1.60 Smart Investing & Trading Score: 56 | |
| Day Percent Change: -1.64% Day Change: -0.03 | |
| Week Change: -10% Year-to-date Change: -49.2% | |
| OABI Links: Profile News Message Board | |
| Charts:- Daily , Weekly | |
| Add OABI to Watchlist: View: Get Complete OABI Trend Analysis ➞ | |
 | LCTX Lineage Cell Therapeutics, Inc. |
| Sector: Health Care | |
| SubSector: Biotechnology | |
| MarketCap: 141.285 Millions | |
| Recent Price: 1.17 Smart Investing & Trading Score: 50 | |
| Day Percent Change: -1.68% Day Change: -0.02 | |
| Week Change: 14.71% Year-to-date Change: 132.8% | |
| LCTX Links: Profile News Message Board | |
| Charts:- Daily , Weekly | |
| Add LCTX to Watchlist: View: Get Complete LCTX Trend Analysis ➞ | |
 | KIDS OrthoPediatrics Corp. |
| Sector: Health Care | |
| SubSector: Medical Appliances & Equipment | |
| MarketCap: 742.28 Millions | |
| Recent Price: 21.36 Smart Investing & Trading Score: 50 | |
| Day Percent Change: -1.69% Day Change: -0.33 | |
| Week Change: 0.1% Year-to-date Change: -17.4% | |
| KIDS Links: Profile News Message Board | |
| Charts:- Daily , Weekly | |
| Add KIDS to Watchlist: View: Get Complete KIDS Trend Analysis ➞ | |
 | PEN Penumbra, Inc. |
| Sector: Health Care | |
| SubSector: Medical Instruments & Supplies | |
| MarketCap: 4854.1 Millions | |
| Recent Price: 272.64 Smart Investing & Trading Score: 80 | |
| Day Percent Change: -1.7% Day Change: -4.35 | |
| Week Change: -0.73% Year-to-date Change: 5.9% | |
| PEN Links: Profile News Message Board | |
| Charts:- Daily , Weekly | |
| Add PEN to Watchlist: View: Get Complete PEN Trend Analysis ➞ | |
 | AVNS Avanos Medical, Inc. |
| Sector: Health Care | |
| SubSector: Medical Instruments & Supplies | |
| MarketCap: 1229.6 Millions | |
| Recent Price: 11.94 Smart Investing & Trading Score: 80 | |
| Day Percent Change: -1.76% Day Change: -0.2 | |
| Week Change: 1.82% Year-to-date Change: -29.9% | |
| AVNS Links: Profile News Message Board | |
| Charts:- Daily , Weekly | |
| Add AVNS to Watchlist: View: Get Complete AVNS Trend Analysis ➞ | |
 | FATE Fate Therapeutics, Inc. |
| Sector: Health Care | |
| SubSector: Biotechnology | |
| MarketCap: 2022.45 Millions | |
| Recent Price: 1.04 Smart Investing & Trading Score: 20 | |
| Day Percent Change: -1.77% Day Change: -0.02 | |
| Week Change: 3.74% Year-to-date Change: -32.7% | |
| FATE Links: Profile News Message Board | |
| Charts:- Daily , Weekly | |
| Add FATE to Watchlist: View: Get Complete FATE Trend Analysis ➞ | |
| For tabular summary view of above stock list: Summary View ➞ 0 - 25 , 25 - 50 , 50 - 75 , 75 - 100 , 100 - 125 , 125 - 150 , 150 - 175 , 175 - 200 , 200 - 225 , 225 - 250 , 250 - 275 , 275 - 300 , 300 - 325 , 325 - 350 , 350 - 375 , 375 - 400 , 400 - 425 , 425 - 450 , 450 - 475 , 475 - 500 , 500 - 525 , 525 - 550 , 550 - 575 , 575 - 600 , 600 - 625 | ||
| Click To Change The Sort Order: By Market Cap or Company Size Performance: Year-to-date, Week and Day | |
| Select Chart Type: | ||
|
Best Stocks Today 12Stocks.com |
© 2025 12Stocks.com Terms & Conditions Privacy Contact Us
All Information Provided Only For Education And Not To Be Used For Investing or Trading. See Terms & Conditions


One More Thing ... Get Best Stocks Delivered Daily!
Never Ever Miss A Move With Our Top Ten Stocks Lists
Find Best Stocks In Any Market - Bull or Bear Market
Take A Peek At Our Top Ten Stocks Lists: Daily, Weekly, Year-to-Date & Top Trends
Find Best Stocks In Any Market - Bull or Bear Market
Take A Peek At Our Top Ten Stocks Lists: Daily, Weekly, Year-to-Date & Top Trends
Healthcare Stocks With Best Up Trends [0-bearish to 100-bullish]: Sol-Gel Technologies[100], Immuneering [100], Precigen [100], Gossamer Bio[100], Rockwell [100], Fortress Biotech[100], Design [100], Terns [100], Teva [100], Keros [100], Coherus BioSciences[100]
Best Healthcare Stocks Year-to-Date:
Regencell Bioscience[9561.54%], I Mab[454.12%], Matinas BioPharma[241.18%], Nanobiotix S.A[239.28%], Atai Life[230.08%], Precigen [225%], DBV Technologies[208.74%], Galectin [200.78%], Sol-Gel Technologies[177.39%], 908 Devices[173.64%], DURECT [153.33%] Best Healthcare Stocks This Week:
Precigen [96.76%], Sol-Gel Technologies[69.18%], ALX Oncology[57.25%], Immuneering [52.3%], Burning Rock[41.87%], Minerva Neurosciences[34.54%], Aligos [29.73%], Karyopharm [29.46%], CASI [27.32%], GoodRx [26.84%], Zentalis [26.35%] Best Healthcare Stocks Daily:
Sol-Gel Technologies[40.22%], Immuneering [34.99%], ALX Oncology[23.8%], Tyra Biosciences[14.26%], Nanobiotix S.A[14.15%], Zentalis [14.02%], Zura Bio[13.71%], X4 [13.57%], Precigen [13.4%], Vivos [11.38%], Gossamer Bio[11.28%]