
 Login Sign Up


| |||||
 |  | ||||

| 12Stocks.com Market Intelligence |
Best Healthcare Stocks
 | "Discover best trending healthcare stocks with 12Stocks.com." |
| - Subu Vdaygiri, Founder, 12Stocks.com |
| In a hurry? Healthcare Stocks Lists: Performance Trends Table, Stock Charts
Sort Healthcare stocks: Daily, Weekly, Year-to-Date, Market Cap & Trends. Filter Healthcare stocks list by size:All Healthcare Large Mid-Range Small |
| 12Stocks.com Healthcare Stocks Performances & Trends Daily | |||||||||
|
|  The overall Smart Investing & Trading Score is 90 (0-bearish to 100-bullish) which puts Healthcare sector in short term bullish trend. The Smart Investing & Trading Score from previous trading session is 90 and an improvement of trend continues.
| ||||||||
Here are the Smart Investing & Trading Scores of the most requested Healthcare stocks at 12Stocks.com (click stock name for detailed review):
|


| 12Stocks.com: Investing in Healthcare sector with Stocks | |
|
The following table helps investors and traders sort through current performance and trends (as measured by Smart Investing & Trading Score) of various
stocks in the Healthcare sector. Quick View: Move mouse or cursor over stock symbol (ticker) to view short-term Technical chart and over stock name to view long term chart. Click on  to add stock symbol to your watchlist and to add stock symbol to your watchlist and  to view watchlist. Click on any ticker or stock name for detailed market intelligence report for that stock. to view watchlist. Click on any ticker or stock name for detailed market intelligence report for that stock. |
12Stocks.com Performance of Stocks in Healthcare Sector
| Ticker | Stock Name | Watchlist | Category | Recent Price | Smart Investing & Trading Score | Change % | YTD Change% |
| LIVN | LivaNova |   | Equipment | 56.37 | 90 | -0.99 | 14.14% |
| LH | Laboratory | | Laboratories | 275.21 | 40 | -1.00 | 10.81% |
| DGX | Quest Diagnostics | | Laboratories | 179.82 | 20 | -1.00 | 11.29% |
| IDXX | IDEXX | | Diagnostic | 640.59 | 40 | -1.00 | 51.78% |
| ISRG | Intuitive Surgical | | Instruments | 468.52 | 10 | -1.01 | -18.07% |
| HLN | Haleon | | Drug Manufacturers - Specialty & Generic | 9.80 | 41 | -1.01 | 4.09% |
| INBX | Inhibrx | | Biotechnology | 28.20 | 100 | -1.02 | 56.88% |
| REGN | Regeneron | | Biotechnology | 574.73 | 40 | -1.03 | -14.36% |
| ATHA | Athira Pharma | | Biotechnology | 0.39 | 50 | -1.03 | -32.78% |
| BHC | Bausch Health | | Delivery | 7.42 | 90 | -1.06 | -6.95% |
| TAK | Takeda | | Pharmaceutical | 14.99 | 70 | -1.10 | 18.30% |
| RMD | ResMed | | Instruments | 271.47 | 20 | -1.11 | 15.45% |
| CLSD | Clearside Bio | | Biotechnology | 0.37 | 0 | -1.13 | -57.58% |
| INNV | InnovAge Holding | | Medical Care Facilities | 3.83 | 40 | -1.15 | -12.21% |
| ADMA | ADMA Biologics | | Biotechnology | 17.26 | 50 | -1.16 | -0.29% |
| ABT | Abbott | | Equipment | 131.1 | 20 | -1.18 | 3.41% |
| SNN | Smith & Nephew | | Equipment | 37.45 | 50 | -1.18 | 52.89% |
| IMMP | Immutep | | Biotechnology | 1.61 | 0 | -1.20 | -24.42% |
| CRL | Charles River | | Laboratories | 161.3 | 50 | -1.23 | -2.10% |
| NVST | Envista | | Instruments | 21.18 | 40 | -1.25 | 6.07% |
| CLPT | ClearPoint Neuro | | Equipment | 10.49 | 0 | -1.25 | -33.42% |
| GKOS | Glaukos | | Instruments | 95.82 | 40 | -1.26 | -40.12% |
| SVRA | Savara | | Biotechnology | 3.28 | 100 | -1.29 | -0.65% |
| WST | West | | Instruments | 243.73 | 30 | -1.30 | -28.46% |
| ICUI | ICU | | Instruments | 127.66 | 70 | -1.31 | -21.54% |
| For chart view version of above stock list: Chart View ➞ 0 - 25 , 25 - 50 , 50 - 75 , 75 - 100 , 100 - 125 , 125 - 150 , 150 - 175 , 175 - 200 , 200 - 225 , 225 - 250 , 250 - 275 , 275 - 300 , 300 - 325 , 325 - 350 , 350 - 375 , 375 - 400 , 400 - 425 , 425 - 450 , 450 - 475 , 475 - 500 , 500 - 525 , 525 - 550 , 550 - 575 , 575 - 600 , 600 - 625 | ||
 | Click To Change The Sort Order: By Market Cap or Company Size Performance: Year-to-date, Week and Day |  |
|
Get the most comprehensive stock market coverage daily at 12Stocks.com ➞ Best Stocks Today ➞ Best Stocks Weekly ➞ Best Stocks Year-to-Date ➞ Best Stocks Trends ➞  Best Stocks Today 12Stocks.com Best Nasdaq Stocks ➞ Best S&P 500 Stocks ➞ Best Tech Stocks ➞ Best Biotech Stocks ➞ |
| Detailed Overview of Healthcare Stocks |
| Healthcare Technical Overview, Leaders & Laggards, Top Healthcare ETF Funds & Detailed Healthcare Stocks List, Charts, Trends & More |
| Healthcare Sector: Technical Analysis, Trends & YTD Performance | |
| Healthcare sector is composed of stocks
from pharmaceutical, biotech, diagnostics labs, insurance providers
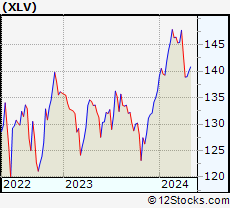
and healthcare services. Healthcare sector, as represented by XLV, an exchange-traded fund [ETF] that holds basket of Healthcare stocks (e.g, Merck, Amgen) is down by -5.64% and is currently underperforming the overall market by -12.18% year-to-date. Below is a quick view of Technical charts and trends: |
|
 XLV Weekly Chart |
|
| Long Term Trend: Good | |
| Medium Term Trend: Good | |
 XLV Daily Chart |
|
| Short Term Trend: Very Good | |
| Overall Trend Score: 90 | |
| YTD Performance: -5.64% | |
| **Trend Scores & Views Are Only For Educational Purposes And Not For Investing | |
| 12Stocks.com: Top Performing Healthcare Sector Stocks | |||||||||||||||||||||||||||||||||||||||||||||||
 The top performing Healthcare sector stocks year to date are
Now, more recently, over last week, the top performing Healthcare sector stocks on the move are


|
|||||||||||||||||||||||||||||||||||||||||||||||
| 12Stocks.com: Investing in Healthcare Sector using Exchange Traded Funds | |
|
The following table shows list of key exchange traded funds (ETF) that
help investors track Healthcare Index. For detailed view, check out our ETF Funds section of our website. Quick View: Move mouse or cursor over ETF symbol (ticker) to view short-term Technical chart and over ETF name to view long term chart. Click on ticker or stock name for detailed view. Click on to add stock symbol to your watchlist and to view watchlist. |
12Stocks.com List of ETFs that track Healthcare Index
| Ticker | ETF Name | Watchlist | Recent Price | Smart Investing & Trading Score | Change % | Week % | Year-to-date % |
| XLV | Health Care | | 137.4 | 90 | -0.02 | -0.02 | -5.64% |
| XBI | Biotech | | 93.03 | 100 | 3.54 | 3.54 | 0.4% |
| IBB | Biotechnology | | 138.22 | 100 | 0.73 | 0.73 | 0.89% |
| BBH | Biotech | | 165.18 | 70 | 0.61 | 0.53 | 1.51% |
| VHT | Health Care | | 255.08 | 90 | -0.22 | 2.2 | 0.9% |
| IYH | Healthcare | | 57.87 | 90 | -0.31 | 2.14 | -0.44% |
| IHF | Healthcare Providers | | 47.35 | 80 | 0.25 | 0.25 | -10.02% |
| IHI | Medical Devices | | 62.15 | 30 | -1.09 | 0.52 | 6.26% |
| BIB | Biotechnology | | 55.26 | 100 | 1.03 | 2.47 | 11.53% |
| BIS | Short Biotech | | 14.42 | 0 | -0.99 | -2.37 | -20.83% |
| XHE | Health Care Equipment | | 82.13 | 50 | -0.65 | 0.56 | -8.82% |
| CURE | Healthcare Bull 3X | | 80.67 | 80 | -1.02 | 6.93 | -12.21% |
| LABU | Biotech Bull 3X | | 69.35 | 100 | 2.38 | 0.61 | -22.08% |
| LABD | Biotech Bear 3X | | 5.75 | 10 | -2.55 | -1.37 | -19.84% |
| PSCH | SmallCap Health Care | | 41.34 | 100 | 0.06 | 0.86 | -9.24% |
| XHS | Health Care Services | | 99.36 | 90 | 0.48 | 2.14 | 7.86% |
| PTH | DWA Healthcare Momentum | | 39.81 | 90 | 0.67 | 0.47 | -1.58% |
| RXL | Health Care | | 41.55 | 80 | 1.45 | 2.54 | -15.15% |
| RXD | Short Health Care | | 11.74 | 20 | -1.42 | -2.61 | 10.49% |
| 12Stocks.com: Charts, Trends, Fundamental Data and Performances of Healthcare Stocks | |
|
We now take in-depth look at all Healthcare stocks including charts, multi-period performances and overall trends (as measured by Smart Investing & Trading Score). One can sort Healthcare stocks (click link to choose) by Daily, Weekly and by Year-to-Date performances. Also, one can sort by size of the company or by market capitalization. |
| Select Your Default Chart Type: | |||||
| |||||
| Click on stock symbol or name for detailed view. Click on to add stock symbol to your watchlist and to view watchlist. Quick View: Move mouse or cursor over "Daily" to quickly view daily Technical stock chart and over "Weekly" to view weekly Technical stock chart. | |||||

 | LIVN LivaNova PLC |
| Sector: Health Care | |
| SubSector: Medical Appliances & Equipment | |
| MarketCap: 2060.5 Millions | |
| Recent Price: 56.37 Smart Investing & Trading Score: 90 | |
| Day Percent Change: -0.99% Day Change: -0.53 | |
| Week Change: -2.35% Year-to-date Change: 14.1% | |
| LIVN Links: Profile News Message Board | |
| Charts:- Daily , Weekly | |
| Add LIVN to Watchlist: View: Get Complete LIVN Trend Analysis ➞ | |
 | LH Laboratory Corporation of America Holdings |
| Sector: Health Care | |
| SubSector: Medical Laboratories & Research | |
| MarketCap: 12119.2 Millions | |
| Recent Price: 275.21 Smart Investing & Trading Score: 40 | |
| Day Percent Change: -1% Day Change: -2.78 | |
| Week Change: -1% Year-to-date Change: 10.8% | |
| LH Links: Profile News Message Board | |
| Charts:- Daily , Weekly | |
| Add LH to Watchlist: View: Get Complete LH Trend Analysis ➞ | |
 | DGX Quest Diagnostics Incorporated |
| Sector: Health Care | |
| SubSector: Medical Laboratories & Research | |
| MarketCap: 11076.1 Millions | |
| Recent Price: 179.82 Smart Investing & Trading Score: 20 | |
| Day Percent Change: -1% Day Change: -1.82 | |
| Week Change: -1% Year-to-date Change: 11.3% | |
| DGX Links: Profile News Message Board | |
| Charts:- Daily , Weekly | |
| Add DGX to Watchlist: View: Get Complete DGX Trend Analysis ➞ | |
 | IDXX IDEXX Laboratories, Inc. |
| Sector: Health Care | |
| SubSector: Diagnostic Substances | |
| MarketCap: 15937.1 Millions | |
| Recent Price: 640.59 Smart Investing & Trading Score: 40 | |
| Day Percent Change: -1% Day Change: -6.5 | |
| Week Change: -1% Year-to-date Change: 51.8% | |
| IDXX Links: Profile News Message Board | |
| Charts:- Daily , Weekly | |
| Add IDXX to Watchlist: View: Get Complete IDXX Trend Analysis ➞ | |
 | ISRG Intuitive Surgical, Inc. |
| Sector: Health Care | |
| SubSector: Medical Instruments & Supplies | |
| MarketCap: 50917.5 Millions | |
| Recent Price: 468.52 Smart Investing & Trading Score: 10 | |
| Day Percent Change: -1.01% Day Change: -4.78 | |
| Week Change: -1.01% Year-to-date Change: -18.1% | |
| ISRG Links: Profile News Message Board | |
| Charts:- Daily , Weekly | |
| Add ISRG to Watchlist: View: Get Complete ISRG Trend Analysis ➞ | |
 | HLN Haleon plc |
| Sector: Health Care | |
| SubSector: Drug Manufacturers - Specialty & Generic | |
| MarketCap: 38310 Millions | |
| Recent Price: 9.80 Smart Investing & Trading Score: 41 | |
| Day Percent Change: -1.01% Day Change: -0.1 | |
| Week Change: 1.13% Year-to-date Change: 4.1% | |
| HLN Links: Profile News Message Board | |
| Charts:- Daily , Weekly | |
| Add HLN to Watchlist: View: Get Complete HLN Trend Analysis ➞ | |
 | INBX Inhibrx, Inc. |
| Sector: Health Care | |
| SubSector: Biotechnology | |
| MarketCap: 14187 Millions | |
| Recent Price: 28.20 Smart Investing & Trading Score: 100 | |
| Day Percent Change: -1.02% Day Change: -0.25 | |
| Week Change: 0.92% Year-to-date Change: 56.9% | |
| INBX Links: Profile News Message Board | |
| Charts:- Daily , Weekly | |
| Add INBX to Watchlist: View: Get Complete INBX Trend Analysis ➞ | |
 | REGN Regeneron Pharmaceuticals, Inc. |
| Sector: Health Care | |
| SubSector: Biotechnology | |
| MarketCap: 51903.7 Millions | |
| Recent Price: 574.73 Smart Investing & Trading Score: 40 | |
| Day Percent Change: -1.03% Day Change: -5.97 | |
| Week Change: -1.03% Year-to-date Change: -14.4% | |
| REGN Links: Profile News Message Board | |
| Charts:- Daily , Weekly | |
| Add REGN to Watchlist: View: Get Complete REGN Trend Analysis ➞ | |
 | ATHA Athira Pharma, Inc. |
| Sector: Health Care | |
| SubSector: Biotechnology | |
| MarketCap: 92487 Millions | |
| Recent Price: 0.39 Smart Investing & Trading Score: 50 | |
| Day Percent Change: -1.03% Day Change: 0 | |
| Week Change: -0.93% Year-to-date Change: -32.8% | |
| ATHA Links: Profile News Message Board | |
| Charts:- Daily , Weekly | |
| Add ATHA to Watchlist: View: Get Complete ATHA Trend Analysis ➞ | |
 | BHC Bausch Health Companies Inc. |
| Sector: Health Care | |
| SubSector: Drug Delivery | |
| MarketCap: 5485.3 Millions | |
| Recent Price: 7.42 Smart Investing & Trading Score: 90 | |
| Day Percent Change: -1.06% Day Change: -0.08 | |
| Week Change: -0.13% Year-to-date Change: -7.0% | |
| BHC Links: Profile News Message Board | |
| Charts:- Daily , Weekly | |
| Add BHC to Watchlist: View: Get Complete BHC Trend Analysis ➞ | |
 | TAK Takeda Pharmaceutical Company Limited |
| Sector: Health Care | |
| SubSector: Drugs - Generic | |
| MarketCap: 41342.5 Millions | |
| Recent Price: 14.99 Smart Investing & Trading Score: 70 | |
| Day Percent Change: -1.1% Day Change: -0.17 | |
| Week Change: 3.45% Year-to-date Change: 18.3% | |
| TAK Links: Profile News Message Board | |
| Charts:- Daily , Weekly | |
| Add TAK to Watchlist: View: Get Complete TAK Trend Analysis ➞ | |
 | RMD ResMed Inc. |
| Sector: Health Care | |
| SubSector: Medical Instruments & Supplies | |
| MarketCap: 18660.2 Millions | |
| Recent Price: 271.47 Smart Investing & Trading Score: 20 | |
| Day Percent Change: -1.11% Day Change: -3.04 | |
| Week Change: -1.11% Year-to-date Change: 15.5% | |
| RMD Links: Profile News Message Board | |
| Charts:- Daily , Weekly | |
| Add RMD to Watchlist: View: Get Complete RMD Trend Analysis ➞ | |
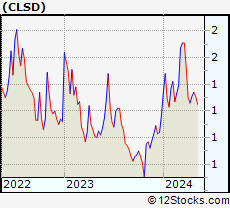 | CLSD Clearside Biomedical, Inc. |
| Sector: Health Care | |
| SubSector: Biotechnology | |
| MarketCap: 73.2785 Millions | |
| Recent Price: 0.37 Smart Investing & Trading Score: 0 | |
| Day Percent Change: -1.13% Day Change: 0 | |
| Week Change: -10.22% Year-to-date Change: -57.6% | |
| CLSD Links: Profile News Message Board | |
| Charts:- Daily , Weekly | |
| Add CLSD to Watchlist: View: Get Complete CLSD Trend Analysis ➞ | |
 | INNV InnovAge Holding Corp. |
| Sector: Health Care | |
| SubSector: Medical Care Facilities | |
| MarketCap: 1010 Millions | |
| Recent Price: 3.83 Smart Investing & Trading Score: 40 | |
| Day Percent Change: -1.15% Day Change: -0.04 | |
| Week Change: -2.27% Year-to-date Change: -12.2% | |
| INNV Links: Profile News Message Board | |
| Charts:- Daily , Weekly | |
| Add INNV to Watchlist: View: Get Complete INNV Trend Analysis ➞ | |
 | ADMA ADMA Biologics, Inc. |
| Sector: Health Care | |
| SubSector: Biotechnology | |
| MarketCap: 204.985 Millions | |
| Recent Price: 17.26 Smart Investing & Trading Score: 50 | |
| Day Percent Change: -1.16% Day Change: -0.2 | |
| Week Change: 0.77% Year-to-date Change: -0.3% | |
| ADMA Links: Profile News Message Board | |
| Charts:- Daily , Weekly | |
| Add ADMA to Watchlist: View: Get Complete ADMA Trend Analysis ➞ | |
 | ABT Abbott Laboratories |
| Sector: Health Care | |
| SubSector: Medical Appliances & Equipment | |
| MarketCap: 125288 Millions | |
| Recent Price: 131.1 Smart Investing & Trading Score: 20 | |
| Day Percent Change: -1.18% Day Change: -1.56 | |
| Week Change: -1.18% Year-to-date Change: 3.4% | |
| ABT Links: Profile News Message Board | |
| Charts:- Daily , Weekly | |
| Add ABT to Watchlist: View: Get Complete ABT Trend Analysis ➞ | |
 | SNN Smith & Nephew plc |
| Sector: Health Care | |
| SubSector: Medical Appliances & Equipment | |
| MarketCap: 15180.8 Millions | |
| Recent Price: 37.45 Smart Investing & Trading Score: 50 | |
| Day Percent Change: -1.18% Day Change: -0.44 | |
| Week Change: 0.96% Year-to-date Change: 52.9% | |
| SNN Links: Profile News Message Board | |
| Charts:- Daily , Weekly | |
| Add SNN to Watchlist: View: Get Complete SNN Trend Analysis ➞ | |
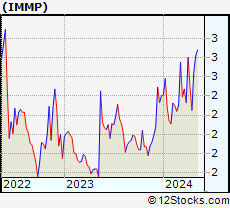 | IMMP Immutep Limited |
| Sector: Health Care | |
| SubSector: Biotechnology | |
| MarketCap: 71.5785 Millions | |
| Recent Price: 1.61 Smart Investing & Trading Score: 0 | |
| Day Percent Change: -1.2% Day Change: -0.02 | |
| Week Change: -4.65% Year-to-date Change: -24.4% | |
| IMMP Links: Profile News Message Board | |
| Charts:- Daily , Weekly | |
| Add IMMP to Watchlist: View: Get Complete IMMP Trend Analysis ➞ | |
 | CRL Charles River Laboratories International, Inc. |
| Sector: Health Care | |
| SubSector: Medical Laboratories & Research | |
| MarketCap: 5700.5 Millions | |
| Recent Price: 161.3 Smart Investing & Trading Score: 50 | |
| Day Percent Change: -1.23% Day Change: -2.01 | |
| Week Change: -1.23% Year-to-date Change: -2.1% | |
| CRL Links: Profile News Message Board | |
| Charts:- Daily , Weekly | |
| Add CRL to Watchlist: View: Get Complete CRL Trend Analysis ➞ | |
 | NVST Envista Holdings Corporation |
| Sector: Health Care | |
| SubSector: Medical Instruments & Supplies | |
| MarketCap: 2075.8 Millions | |
| Recent Price: 21.18 Smart Investing & Trading Score: 40 | |
| Day Percent Change: -1.25% Day Change: -0.26 | |
| Week Change: -1.73% Year-to-date Change: 6.1% | |
| NVST Links: Profile News Message Board | |
| Charts:- Daily , Weekly | |
| Add NVST to Watchlist: View: Get Complete NVST Trend Analysis ➞ | |
 | CLPT ClearPoint Neuro, Inc. |
| Sector: Health Care | |
| SubSector: Medical Appliances & Equipment | |
| MarketCap: 55.108 Millions | |
| Recent Price: 10.49 Smart Investing & Trading Score: 0 | |
| Day Percent Change: -1.25% Day Change: -0.13 | |
| Week Change: -12.33% Year-to-date Change: -33.4% | |
| CLPT Links: Profile News Message Board | |
| Charts:- Daily , Weekly | |
| Add CLPT to Watchlist: View: Get Complete CLPT Trend Analysis ➞ | |
 | GKOS Glaukos Corporation |
| Sector: Health Care | |
| SubSector: Medical Instruments & Supplies | |
| MarketCap: 1103.6 Millions | |
| Recent Price: 95.82 Smart Investing & Trading Score: 40 | |
| Day Percent Change: -1.26% Day Change: -1.15 | |
| Week Change: -1.42% Year-to-date Change: -40.1% | |
| GKOS Links: Profile News Message Board | |
| Charts:- Daily , Weekly | |
| Add GKOS to Watchlist: View: Get Complete GKOS Trend Analysis ➞ | |
 | SVRA Savara Inc. |
| Sector: Health Care | |
| SubSector: Biotechnology | |
| MarketCap: 80.3785 Millions | |
| Recent Price: 3.28 Smart Investing & Trading Score: 100 | |
| Day Percent Change: -1.29% Day Change: -0.04 | |
| Week Change: 1.33% Year-to-date Change: -0.7% | |
| SVRA Links: Profile News Message Board | |
| Charts:- Daily , Weekly | |
| Add SVRA to Watchlist: View: Get Complete SVRA Trend Analysis ➞ | |
 | WST West Pharmaceutical Services, Inc. |
| Sector: Health Care | |
| SubSector: Medical Instruments & Supplies | |
| MarketCap: 9989 Millions | |
| Recent Price: 243.73 Smart Investing & Trading Score: 30 | |
| Day Percent Change: -1.3% Day Change: -3.22 | |
| Week Change: -1.3% Year-to-date Change: -28.5% | |
| WST Links: Profile News Message Board | |
| Charts:- Daily , Weekly | |
| Add WST to Watchlist: View: Get Complete WST Trend Analysis ➞ | |
 | ICUI ICU Medical, Inc. |
| Sector: Health Care | |
| SubSector: Medical Instruments & Supplies | |
| MarketCap: 3640.7 Millions | |
| Recent Price: 127.66 Smart Investing & Trading Score: 70 | |
| Day Percent Change: -1.31% Day Change: -1.61 | |
| Week Change: 8.8% Year-to-date Change: -21.5% | |
| ICUI Links: Profile News Message Board | |
| Charts:- Daily , Weekly | |
| Add ICUI to Watchlist: View: Get Complete ICUI Trend Analysis ➞ | |
| For tabular summary view of above stock list: Summary View ➞ 0 - 25 , 25 - 50 , 50 - 75 , 75 - 100 , 100 - 125 , 125 - 150 , 150 - 175 , 175 - 200 , 200 - 225 , 225 - 250 , 250 - 275 , 275 - 300 , 300 - 325 , 325 - 350 , 350 - 375 , 375 - 400 , 400 - 425 , 425 - 450 , 450 - 475 , 475 - 500 , 500 - 525 , 525 - 550 , 550 - 575 , 575 - 600 , 600 - 625 | ||
| Click To Change The Sort Order: By Market Cap or Company Size Performance: Year-to-date, Week and Day | |
| Select Chart Type: | ||
|
Best Stocks Today 12Stocks.com |
© 2025 12Stocks.com Terms & Conditions Privacy Contact Us
All Information Provided Only For Education And Not To Be Used For Investing or Trading. See Terms & Conditions


One More Thing ... Get Best Stocks Delivered Daily!
Never Ever Miss A Move With Our Top Ten Stocks Lists
Find Best Stocks In Any Market - Bull or Bear Market
Take A Peek At Our Top Ten Stocks Lists: Daily, Weekly, Year-to-Date & Top Trends
Find Best Stocks In Any Market - Bull or Bear Market
Take A Peek At Our Top Ten Stocks Lists: Daily, Weekly, Year-to-Date & Top Trends
Healthcare Stocks With Best Up Trends [0-bearish to 100-bullish]: Sol-Gel Technologies[100], Immuneering [100], Precigen [100], Gossamer Bio[100], Rockwell [100], Fortress Biotech[100], Design [100], Terns [100], Teva [100], Keros [100], Coherus BioSciences[100]
Best Healthcare Stocks Year-to-Date:
Regencell Bioscience[9561.54%], I Mab[454.12%], Matinas BioPharma[241.18%], Nanobiotix S.A[239.28%], Atai Life[230.08%], Precigen [225%], DBV Technologies[208.74%], Galectin [200.78%], Sol-Gel Technologies[177.39%], 908 Devices[173.64%], DURECT [153.33%] Best Healthcare Stocks This Week:
Precigen [96.76%], Sol-Gel Technologies[69.18%], ALX Oncology[57.25%], Immuneering [52.3%], Burning Rock[41.87%], Minerva Neurosciences[34.54%], Aligos [29.73%], Karyopharm [29.46%], CASI [27.32%], GoodRx [26.84%], Zentalis [26.35%] Best Healthcare Stocks Daily:
Sol-Gel Technologies[40.22%], Immuneering [34.99%], ALX Oncology[23.8%], Tyra Biosciences[14.26%], Nanobiotix S.A[14.15%], Zentalis [14.02%], Zura Bio[13.71%], X4 [13.57%], Precigen [13.4%], Vivos [11.38%], Gossamer Bio[11.28%]