
 Login Sign Up


| |||||
 |  | ||||

| 12Stocks.com Market Intelligence |
Best Consumer Services Stocks
| In a hurry? Services & Goods Stocks: Performance Trends Table, Stock Charts
Sort Consumer Services: Daily, Weekly, Year-to-Date, Market Cap & Trends. Filter Services & Goods stocks list by size: All Large Mid-Range Small |
| 12Stocks.com Consumer Services Stocks Performances & Trends Daily | |||||||||
|
|  The overall Smart Investing & Trading Score is 100 (0-bearish to 100-bullish) which puts Consumer Services sector in short term bullish trend. The Smart Investing & Trading Score from previous trading session is 50 and an improvement of trend continues.
| ||||||||
Here are the Smart Investing & Trading Scores of the most requested Consumer Services stocks at 12Stocks.com (click stock name for detailed review):
|


| Consider signing up for our daily 12Stocks.com "Best Stocks Newsletter". You will never ever miss a big stock move again! |
| 12Stocks.com: Investing in Consumer Services sector with Stocks | |
|
The following table helps investors and traders sort through current performance and trends (as measured by Smart Investing & Trading Score) of various
stocks in the Consumer Services sector. Quick View: Move mouse or cursor over stock symbol (ticker) to view short-term Technical chart and over stock name to view long term chart. Click on  to add stock symbol to your watchlist and to add stock symbol to your watchlist and  to view watchlist. Click on any ticker or stock name for detailed market intelligence report for that stock. to view watchlist. Click on any ticker or stock name for detailed market intelligence report for that stock. |
12Stocks.com Performance of Stocks in Consumer Services Sector
| Ticker | Stock Name | Watchlist | Category | Recent Price | Smart Investing & Trading Score | Change % | YTD Change% |
| HOFT | Hooker Furnishings |   | Furnishings, Fixtures & Appliances | 10.00 | 40 | -3.29 | -22.75% |
| GENK | GEN Restaurant | | Restaurants | 3.07 | 58 | -3.34 | -57.18% |
| VIOT | Viomi Technology | | Furnishings, Fixtures & Appliances | 3.42 | 60 | -3.39 | 130.06% |
| MYTE | MYT Netherlands | | Luxury Goods | 7.61 | 0 | -3.55 | 1.74% |
| BZUN | Baozun | | Internet Retail | 4.60 | 90 | -3.56 | 66.07% |
| STS | Supreme Industries | | Automotive | 3.46 | 10 | -3.62 | 0.00% |
| CURV | Torrid | | Apparel Retail | 1.84 | 30 | -3.66 | -65.15% |
| OSB | Norbord | | Wholesale | 37.02 | 0 | -3.67 | 0.00% |
| BFAM | Bright Horizons | | Services | 109.13 | 0 | -3.71 | -1.28% |
| ROIAK | Radio One | | Broadcasting | 2.55 | 0 | -3.77 | 0.00% |
| BSET | Bassett Furniture | | Furnishings, Fixtures & Appliances | 16.37 | 50 | -3.93 | 19.90% |
| PNRA | Panera Bread | | Restaurants | 8.98 | 0 | -3.96 | 0.00% |
| PENN | PENN Entertainment | | Casinos | 18.83 | 30 | -3.98 | -2.13% |
| RAD | Rite Aid | | Drug Stores | 18.36 | 70 | -4.03 | 0.00% |
| CAAS | China Automotive | | Auto Parts | 4.40 | 60 | -4.14 | 7.84% |
| GSX | GSX Techedu | | Education | 12.97 | 10 | -4.35 | 0.00% |
| GGR | Gogoro | | Auto Manufacturers | 0.33 | 20 | -4.45 | -34.69% |
| BARK | BARK | | Specialty Retail | 0.84 | 10 | -4.66 | -55.48% |
| UXIN | Uxin | | Auto & Truck Dealerships | 3.33 | 10 | -4.86 | -29.00% |
| SNBR | Sleep Number | | Furnishings, Fixtures & Appliances | 8.92 | 30 | -4.90 | -40.33% |
| SGC | Superior of | | Apparel Manufacturing | 11.19 | 30 | -5.09 | -29.30% |
| NORD | Nord Anglia | | Education | 1.80 | 10 | -5.26 | -80.00% |
| FTCH | Farfetch | | Retail | 0.02 | 20 | -6.25 | 0.00% |
| NEWM | New Media | | Publishing | 72.03 | 0 | -7.18 | 0.00% |
| GTN.A | GRAY TELEVSN | | BRDCST-RADIO/TV | 7.85 | 0 | -7.65 | 0.00% |
| For chart view version of above stock list: Chart View ➞ 0 - 25 , 25 - 50 , 50 - 75 , 75 - 100 , 100 - 125 , 125 - 150 , 150 - 175 , 175 - 200 , 200 - 225 , 225 - 250 , 250 - 275 , 275 - 300 , 300 - 325 , 325 - 350 , 350 - 375 , 375 - 400 , 400 - 425 , 425 - 450 , 450 - 475 , 475 - 500 , 500 - 525 , 525 - 550 , 550 - 575 , 575 - 600 , 600 - 625 | ||
 | Click To Change The Sort Order: By Market Cap or Company Size Performance: Year-to-date, Week and Day |  |
|
Get the most comprehensive stock market coverage daily at 12Stocks.com ➞ Best Stocks Today ➞ Best Stocks Weekly ➞ Best Stocks Year-to-Date ➞ Best Stocks Trends ➞  Best Stocks Today 12Stocks.com Best Nasdaq Stocks ➞ Best S&P 500 Stocks ➞ Best Tech Stocks ➞ Best Biotech Stocks ➞ |
| Detailed Overview of Consumer Services Stocks |
| Consumer Services Technical Overview, Leaders & Laggards, Top Consumer Services ETF Funds & Detailed Consumer Services Stocks List, Charts, Trends & More |
| Consumer Services Sector: Technical Analysis, Trends & YTD Performance | |
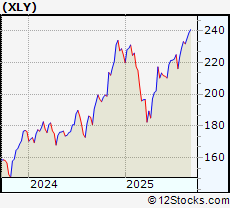
| Consumer Services sector is composed of stocks
from retail, entertainment, media/publishing, consumer goods
and services subsectors. Consumer Services sector, as represented by XLY, an exchange-traded fund [ETF] that holds basket of Consumer Services stocks (e.g, Walmart, Alibaba) is up by 9.2482% and is currently underperforming the overall market by -4.1526% year-to-date. Below is a quick view of Technical charts and trends: |
|
 XLY Weekly Chart |
|
| Long Term Trend: Very Good | |
| Medium Term Trend: Good | |
 XLY Daily Chart |
|
| Short Term Trend: Very Good | |
| Overall Trend Score: 100 | |
| YTD Performance: 9.2482% | |
| **Trend Scores & Views Are Only For Educational Purposes And Not For Investing | |
| 12Stocks.com: Top Performing Consumer Services Sector Stocks | ||||||||||||||||||||||||||||||||||||||||||||||||
 The top performing Consumer Services sector stocks year to date are
Now, more recently, over last week, the top performing Consumer Services sector stocks on the move are


|
||||||||||||||||||||||||||||||||||||||||||||||||
| 12Stocks.com: Investing in Consumer Services Sector using Exchange Traded Funds | |
|
The following table shows list of key exchange traded funds (ETF) that
help investors track Consumer Services Index. For detailed view, check out our ETF Funds section of our website. Quick View: Move mouse or cursor over ETF symbol (ticker) to view short-term Technical chart and over ETF name to view long term chart. Click on ticker or stock name for detailed view. Click on to add stock symbol to your watchlist and to view watchlist. |
12Stocks.com List of ETFs that track Consumer Services Index
| Ticker | ETF Name | Watchlist | Recent Price | Smart Investing & Trading Score | Change % | Week % | Year-to-date % |
| PMR | Retail | | 40.96 | 70 | -0.0244081 | 2.86288 | 0% |
| 12Stocks.com: Charts, Trends, Fundamental Data and Performances of Consumer Services Stocks | |
|
We now take in-depth look at all Consumer Services stocks including charts, multi-period performances and overall trends (as measured by Smart Investing & Trading Score). One can sort Consumer Services stocks (click link to choose) by Daily, Weekly and by Year-to-Date performances. Also, one can sort by size of the company or by market capitalization. |
| Select Your Default Chart Type: | |||||
| |||||
| Click on stock symbol or name for detailed view. Click on to add stock symbol to your watchlist and to view watchlist. Quick View: Move mouse or cursor over "Daily" to quickly view daily Technical stock chart and over "Weekly" to view weekly Technical stock chart. | |||||

 | HOFT Hooker Furnishings Corporation |
| Sector: Services & Goods | |
| SubSector: Furnishings, Fixtures & Appliances | |
| MarketCap: 116.81 Millions | |
| Recent Price: 10.00 Smart Investing & Trading Score: 40 | |
| Day Percent Change: -3.2882% Day Change: -0.15 | |
| Week Change: -8.42491% Year-to-date Change: -22.8% | |
| HOFT Links: Profile News Message Board | |
| Charts:- Daily , Weekly | |
| Add HOFT to Watchlist: View: Get Complete HOFT Trend Analysis ➞ | |
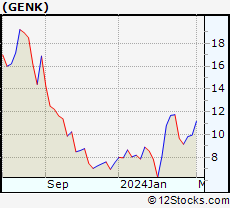 | GENK GEN Restaurant Group Inc |
| Sector: Services & Goods | |
| SubSector: Restaurants | |
| MarketCap: 102.42 Millions | |
| Recent Price: 3.07 Smart Investing & Trading Score: 58 | |
| Day Percent Change: -3.34% Day Change: -0.11 | |
| Week Change: -6.47% Year-to-date Change: -57.2% | |
| GENK Links: Profile News Message Board | |
| Charts:- Daily , Weekly | |
| Add GENK to Watchlist: View: Get Complete GENK Trend Analysis ➞ | |
 | VIOT Viomi Technology Co Ltd ADR |
| Sector: Services & Goods | |
| SubSector: Furnishings, Fixtures & Appliances | |
| MarketCap: 110.06 Millions | |
| Recent Price: 3.42 Smart Investing & Trading Score: 60 | |
| Day Percent Change: -3.38983% Day Change: 0.31 | |
| Week Change: 5.55556% Year-to-date Change: 130.1% | |
| VIOT Links: Profile News Message Board | |
| Charts:- Daily , Weekly | |
| Add VIOT to Watchlist: View: Get Complete VIOT Trend Analysis ➞ | |
 | MYTE MYT Netherlands Parent B.V. |
| Sector: Services & Goods | |
| SubSector: Luxury Goods | |
| MarketCap: 330 Millions | |
| Recent Price: 7.61 Smart Investing & Trading Score: 0 | |
| Day Percent Change: -3.5488% Day Change: -9999 | |
| Week Change: -5.58313% Year-to-date Change: 1.7% | |
| MYTE Links: Profile News Message Board | |
| Charts:- Daily , Weekly | |
| Add MYTE to Watchlist: View: Get Complete MYTE Trend Analysis ➞ | |
 | BZUN Baozun Inc ADR |
| Sector: Services & Goods | |
| SubSector: Internet Retail | |
| MarketCap: 190.99 Millions | |
| Recent Price: 4.60 Smart Investing & Trading Score: 90 | |
| Day Percent Change: -3.56394% Day Change: 0.07 | |
| Week Change: 28.4916% Year-to-date Change: 66.1% | |
| BZUN Links: Profile News Message Board | |
| Charts:- Daily , Weekly | |
| Add BZUN to Watchlist: View: Get Complete BZUN Trend Analysis ➞ | |
 | STS Supreme Industries, Inc. |
| Sector: Services & Goods | |
| SubSector: Trucks & Other Vehicles | |
| MarketCap: 335.57 Millions | |
| Recent Price: 3.46 Smart Investing & Trading Score: 10 | |
| Day Percent Change: -3.62117% Day Change: -9999 | |
| Week Change: -63.6172% Year-to-date Change: 0.0% | |
| STS Links: Profile News Message Board | |
| Charts:- Daily , Weekly | |
| Add STS to Watchlist: View: Get Complete STS Trend Analysis ➞ | |
 | CURV Torrid Holdings Inc |
| Sector: Services & Goods | |
| SubSector: Apparel Retail | |
| MarketCap: 187.03 Millions | |
| Recent Price: 1.84 Smart Investing & Trading Score: 30 | |
| Day Percent Change: -3.66492% Day Change: 0.03 | |
| Week Change: 3.37079% Year-to-date Change: -65.2% | |
| CURV Links: Profile News Message Board | |
| Charts:- Daily , Weekly | |
| Add CURV to Watchlist: View: Get Complete CURV Trend Analysis ➞ | |
 | OSB Norbord Inc. |
| Sector: Services & Goods | |
| SubSector: Building Materials Wholesale | |
| MarketCap: 847.243 Millions | |
| Recent Price: 37.02 Smart Investing & Trading Score: 0 | |
| Day Percent Change: -3.66901% Day Change: -9999 | |
| Week Change: -92.3035% Year-to-date Change: 0.0% | |
| OSB Links: Profile News Message Board | |
| Charts:- Daily , Weekly | |
| Add OSB to Watchlist: View: Get Complete OSB Trend Analysis ➞ | |
 | BFAM Bright Horizons Family Solutions, Inc |
| Sector: Services & Goods | |
| SubSector: Personal Services | |
| MarketCap: 6643.77 Millions | |
| Recent Price: 109.13 Smart Investing & Trading Score: 0 | |
| Day Percent Change: -3.70599% Day Change: -3.15 | |
| Week Change: -6.58278% Year-to-date Change: -1.3% | |
| BFAM Links: Profile News Message Board | |
| Charts:- Daily , Weekly | |
| Add BFAM to Watchlist: View: Get Complete BFAM Trend Analysis ➞ | |
 | ROIAK Radio One, Inc. |
| Sector: Services & Goods | |
| SubSector: Broadcasting - Radio | |
| MarketCap: 140.13 Millions | |
| Recent Price: 2.55 Smart Investing & Trading Score: 0 | |
| Day Percent Change: -3.77358% Day Change: -9999 | |
| Week Change: -17.7419% Year-to-date Change: 0.0% | |
| ROIAK Links: Profile News Message Board | |
| Charts:- Daily , Weekly | |
| Add ROIAK to Watchlist: View: Get Complete ROIAK Trend Analysis ➞ | |
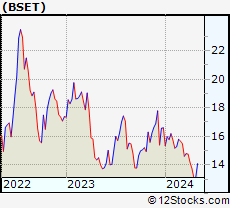 | BSET Bassett Furniture Industries Inc |
| Sector: Services & Goods | |
| SubSector: Furnishings, Fixtures & Appliances | |
| MarketCap: 145.98 Millions | |
| Recent Price: 16.37 Smart Investing & Trading Score: 50 | |
| Day Percent Change: -3.93192% Day Change: -0.52 | |
| Week Change: -2.41431% Year-to-date Change: 19.9% | |
| BSET Links: Profile News Message Board | |
| Charts:- Daily , Weekly | |
| Add BSET to Watchlist: View: Get Complete BSET Trend Analysis ➞ | |
 | PNRA Panera Bread Company |
| Sector: Services & Goods | |
| SubSector: Specialty Eateries | |
| MarketCap: 5396.7 Millions | |
| Recent Price: 8.98 Smart Investing & Trading Score: 0 | |
| Day Percent Change: -3.95722% Day Change: -9999 | |
| Week Change: -91.3521% Year-to-date Change: 0.0% | |
| PNRA Links: Profile News Message Board | |
| Charts:- Daily , Weekly | |
| Add PNRA to Watchlist: View: Get Complete PNRA Trend Analysis ➞ | |
 | PENN PENN Entertainment Inc |
| Sector: Services & Goods | |
| SubSector: Resorts & Casinos | |
| MarketCap: 2988.72 Millions | |
| Recent Price: 18.83 Smart Investing & Trading Score: 30 | |
| Day Percent Change: -3.97756% Day Change: -0.59 | |
| Week Change: -8.01172% Year-to-date Change: -2.1% | |
| PENN Links: Profile News Message Board | |
| Charts:- Daily , Weekly | |
| Add PENN to Watchlist: View: Get Complete PENN Trend Analysis ➞ | |
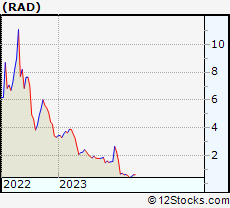 | RAD Rite Aid Corporation |
| Sector: Services & Goods | |
| SubSector: Drug Stores | |
| MarketCap: 1416.51 Millions | |
| Recent Price: 18.36 Smart Investing & Trading Score: 70 | |
| Day Percent Change: -4.02509% Day Change: -9999 | |
| Week Change: 10214.6% Year-to-date Change: 0.0% | |
| RAD Links: Profile News Message Board | |
| Charts:- Daily , Weekly | |
| Add RAD to Watchlist: View: Get Complete RAD Trend Analysis ➞ | |
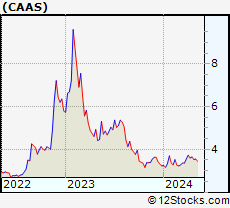 | CAAS China Automotive Systems Inc |
| Sector: Services & Goods | |
| SubSector: Auto Parts | |
| MarketCap: 133.96 Millions | |
| Recent Price: 4.40 Smart Investing & Trading Score: 60 | |
| Day Percent Change: -4.13943% Day Change: -0.01 | |
| Week Change: -0.900901% Year-to-date Change: 7.8% | |
| CAAS Links: Profile News Message Board | |
| Charts:- Daily , Weekly | |
| Add CAAS to Watchlist: View: Get Complete CAAS Trend Analysis ➞ | |
 | GSX GSX Techedu Inc. |
| Sector: Services & Goods | |
| SubSector: Education & Training Services | |
| MarketCap: 10687.6 Millions | |
| Recent Price: 12.97 Smart Investing & Trading Score: 10 | |
| Day Percent Change: -4.35103% Day Change: -9999 | |
| Week Change: -13.2441% Year-to-date Change: 0.0% | |
| GSX Links: Profile News Message Board | |
| Charts:- Daily , Weekly | |
| Add GSX to Watchlist: View: Get Complete GSX Trend Analysis ➞ | |
 | GGR Gogoro Inc |
| Sector: Services & Goods | |
| SubSector: Auto Manufacturers | |
| MarketCap: 103.1 Millions | |
| Recent Price: 0.33 Smart Investing & Trading Score: 20 | |
| Day Percent Change: -4.45274% Day Change: 0 | |
| Week Change: 0.0601685% Year-to-date Change: -34.7% | |
| GGR Links: Profile News Message Board | |
| Charts:- Daily , Weekly | |
| Add GGR to Watchlist: View: Get Complete GGR Trend Analysis ➞ | |
 | BARK BARK Inc |
| Sector: Services & Goods | |
| SubSector: Specialty Retail | |
| MarketCap: 148.92 Millions | |
| Recent Price: 0.84 Smart Investing & Trading Score: 10 | |
| Day Percent Change: -4.65722% Day Change: 0 | |
| Week Change: -4.01551% Year-to-date Change: -55.5% | |
| BARK Links: Profile News Message Board | |
| Charts:- Daily , Weekly | |
| Add BARK to Watchlist: View: Get Complete BARK Trend Analysis ➞ | |
 | UXIN Uxin Ltd ADR |
| Sector: Services & Goods | |
| SubSector: Auto & Truck Dealerships | |
| MarketCap: 721.11 Millions | |
| Recent Price: 3.33 Smart Investing & Trading Score: 10 | |
| Day Percent Change: -4.85714% Day Change: 0.1 | |
| Week Change: -4.85714% Year-to-date Change: -29.0% | |
| UXIN Links: Profile News Message Board | |
| Charts:- Daily , Weekly | |
| Add UXIN to Watchlist: View: Get Complete UXIN Trend Analysis ➞ | |
 | SNBR Sleep Number Corp |
| Sector: Services & Goods | |
| SubSector: Furnishings, Fixtures & Appliances | |
| MarketCap: 220.2 Millions | |
| Recent Price: 8.92 Smart Investing & Trading Score: 30 | |
| Day Percent Change: -4.90405% Day Change: -0.2 | |
| Week Change: -7.75595% Year-to-date Change: -40.3% | |
| SNBR Links: Profile News Message Board | |
| Charts:- Daily , Weekly | |
| Add SNBR to Watchlist: View: Get Complete SNBR Trend Analysis ➞ | |
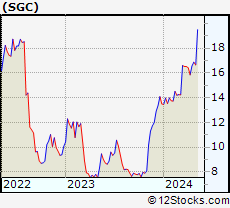 | SGC SuperiorGroup of Companies Inc |
| Sector: Services & Goods | |
| SubSector: Apparel Manufacturing | |
| MarketCap: 194.97 Millions | |
| Recent Price: 11.19 Smart Investing & Trading Score: 30 | |
| Day Percent Change: -5.08906% Day Change: -0.12 | |
| Week Change: -8.35381% Year-to-date Change: -29.3% | |
| SGC Links: Profile News Message Board | |
| Charts:- Daily , Weekly | |
| Add SGC to Watchlist: View: Get Complete SGC Trend Analysis ➞ | |
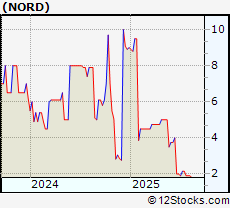 | NORD Nord Anglia Education, Inc. |
| Sector: Services & Goods | |
| SubSector: Education & Training Services | |
| MarketCap: 2506.4 Millions | |
| Recent Price: 1.80 Smart Investing & Trading Score: 10 | |
| Day Percent Change: -5.26316% Day Change: -9999 | |
| Week Change: -5.26316% Year-to-date Change: -80.0% | |
| NORD Links: Profile News Message Board | |
| Charts:- Daily , Weekly | |
| Add NORD to Watchlist: View: Get Complete NORD Trend Analysis ➞ | |
 | FTCH Farfetch Limited |
| Sector: Services & Goods | |
| SubSector: Specialty Retail, Other | |
| MarketCap: 2597.74 Millions | |
| Recent Price: 0.02 Smart Investing & Trading Score: 20 | |
| Day Percent Change: -6.25% Day Change: -9999 | |
| Week Change: 1.94175% Year-to-date Change: 0.0% | |
| FTCH Links: Profile News Message Board | |
| Charts:- Daily , Weekly | |
| Add FTCH to Watchlist: View: Get Complete FTCH Trend Analysis ➞ | |
 | NEWM New Media Investment Group Inc. |
| Sector: Services & Goods | |
| SubSector: Publishing - Newspapers | |
| MarketCap: 795.04 Millions | |
| Recent Price: 72.03 Smart Investing & Trading Score: 0 | |
| Day Percent Change: -7.17783% Day Change: -9999 | |
| Week Change: -18.4997% Year-to-date Change: 0.0% | |
| NEWM Links: Profile News Message Board | |
| Charts:- Daily , Weekly | |
| Add NEWM to Watchlist: View: Get Complete NEWM Trend Analysis ➞ | |
 | GTN.A GRAY TELEVSN -A |
| Sector: Services & Goods | |
| SubSector: BRDCST-RADIO/TV | |
| MarketCap: 253.421 Millions | |
| Recent Price: 7.85 Smart Investing & Trading Score: 0 | |
| Day Percent Change: -7.64706% Day Change: -9999 | |
| Week Change: -49.3221% Year-to-date Change: 0.0% | |
| GTN.A Links: Profile News Message Board | |
| Charts:- Daily , Weekly | |
| Add GTN.A to Watchlist: View: Get Complete GTN.A Trend Analysis ➞ | |
| For tabular summary view of above stock list: Summary View ➞ 0 - 25 , 25 - 50 , 50 - 75 , 75 - 100 , 100 - 125 , 125 - 150 , 150 - 175 , 175 - 200 , 200 - 225 , 225 - 250 , 250 - 275 , 275 - 300 , 300 - 325 , 325 - 350 , 350 - 375 , 375 - 400 , 400 - 425 , 425 - 450 , 450 - 475 , 475 - 500 , 500 - 525 , 525 - 550 , 550 - 575 , 575 - 600 , 600 - 625 | ||
| Click To Change The Sort Order: By Market Cap or Company Size Performance: Year-to-date, Week and Day | |
| Select Chart Type: | ||
|
Best Stocks Today 12Stocks.com |
© 2025 12Stocks.com Terms & Conditions Privacy Contact Us
All Information Provided Only For Education And Not To Be Used For Investing or Trading. See Terms & Conditions


One More Thing ... Get Best Stocks Delivered Daily!
Never Ever Miss A Move With Our Top Ten Stocks Lists
Find Best Stocks In Any Market - Bull or Bear Market
Take A Peek At Our Top Ten Stocks Lists: Daily, Weekly, Year-to-Date & Top Trends
Find Best Stocks In Any Market - Bull or Bear Market
Take A Peek At Our Top Ten Stocks Lists: Daily, Weekly, Year-to-Date & Top Trends
Consumer Services Stocks With Best Up Trends [0-bearish to 100-bullish]: Whole Foods[100], Net 1[100], LiveWire [100], Denny's Corp[100], Ermenegildo Zegna[100], Revolve [100], Therealreal [100], Carters [100], Resources Connection[100], Sally Beauty[100], Advance Auto[100]
Best Consumer Services Stocks Year-to-Date:
WW [1871.33%], Nova Lifestyle[690.41%], ThredUp [665.957%], Lucid [554.785%], Vroom [455.146%], China Yuchai[297.742%], Luxottica [210.802%], Cooper-Standard [190.99%], Masterbeef [156.098%], Jumia Technologies[151.026%], Niu Technologies[136.782%] Best Consumer Services Stocks This Week:
Party City[37593.9%], Companhia Brasileira[18587.4%], Conn s[16420.1%], Rite Aid[10214.6%], Arctic Cat[2387.5%], Chico s[2120.53%], Multi-Color [2063.68%], Reis [1734.59%], Quotient Technology[954.386%], Express [946.725%], Volt Information[705.085%] Best Consumer Services Stocks Daily:
Container Store[22.6852%], SUPERVALU [20.4138%], Irobot Corp[15.4971%], World Wrestling[14.734%], Global Sources[13.1016%], Masterbeef [12.2995%], Whole Foods[11.8363%], iClick Interactive[10%], Net 1[9.46197%], LiveWire [9.09091%], Peloton Interactive[8.17942%]