
 Login Sign Up


| |||||
 |  | ||||

| 12Stocks.com Market Intelligence |
Best Consumer Services Stocks
| In a hurry? Services & Goods Stocks: Performance Trends Table, Stock Charts
Sort Consumer Services: Daily, Weekly, Year-to-Date, Market Cap & Trends. Filter Services & Goods stocks list by size: All Large Mid-Range Small |
| 12Stocks.com Consumer Services Stocks Performances & Trends Daily | |||||||||
|
|  The overall Smart Investing & Trading Score is 90 (0-bearish to 100-bullish) which puts Consumer Services sector in short term bullish trend. The Smart Investing & Trading Score from previous trading session is 50 and hence an improvement of trend.
| ||||||||
Here are the Smart Investing & Trading Scores of the most requested Consumer Services stocks at 12Stocks.com (click stock name for detailed review):
|


| Consider signing up for our daily 12Stocks.com "Best Stocks Newsletter". You will never ever miss a big stock move again! |
| 12Stocks.com: Investing in Consumer Services sector with Stocks | |
|
The following table helps investors and traders sort through current performance and trends (as measured by Smart Investing & Trading Score) of various
stocks in the Consumer Services sector. Quick View: Move mouse or cursor over stock symbol (ticker) to view short-term Technical chart and over stock name to view long term chart. Click on  to add stock symbol to your watchlist and to add stock symbol to your watchlist and  to view watchlist. Click on any ticker or stock name for detailed market intelligence report for that stock. to view watchlist. Click on any ticker or stock name for detailed market intelligence report for that stock. |
12Stocks.com Performance of Stocks in Consumer Services Sector
| Ticker | Stock Name | Watchlist | Category | Recent Price | Smart Investing & Trading Score | Change % | Weekly Change% |
| SAH | Sonic Automotive |   | Automobile | 78.50 | 70 | 4.40% | 8.20% |
| NYT | New York | | Publishing | 58.01 | 60 | 0.77% | 8.19% |
| AMC | AMC Entertainment | | Entertainment | 3.07 | 50 | 2.85% | 8.10% |
| MUSA | Murphy USA | | Retail | 390.59 | 50 | 1.21% | 7.95% |
| NXST | Nexstar Media | | Broadcasting | 202.05 | 100 | 2.48% | 7.92% |
| DENN | Denny s | | Restaurants | 3.82 | 70 | 2.46% | 7.91% |
| IMKTA | Ingles Markets | | Grocery | 64.32 | 80 | 1.98% | 7.88% |
| SBH | Sally Beauty | | Retail | 12.57 | 100 | 1.77% | 7.80% |
| QS | QuantumScape | | Auto Parts | 9.35 | 60 | 1.08% | 7.59% |
| FIGS | FIGS | | Apparel Manufacturing | 6.63 | 80 | 4.80% | 7.46% |
| DXPE | DXP Enterprises | | Equipment | 122.29 | 100 | 3.67% | 7.14% |
| RRGB | Red Robin | | Restaurants | 6.16 | 60 | -69.46% | 6.94% |
| VLGEA | Village Super | | Grocery | 35.90 | 50 | 3.83% | 6.85% |
| LTH | Life Time | | Leisure | 27.60 | 10 | 4.76% | 6.85% |
| CBRL | Cracker Barrel | | Restaurants | 59.88 | 60 | -0.46% | 6.80% |
| HZO | MarineMax | | Retail | 24.86 | 90 | 7.86% | 6.74% |
| FAST | Fastenal | | Equipment | 48.45 | 100 | 20.11% | 6.62% |
| WINA | Winmark | | Retail | 404.43 | 90 | 2.73% | 6.51% |
| RUSHB | Rush Enterprises | | Automobile | 57.95 | 100 | 6.54% | 6.48% |
| MGA | Magna | | Auto Parts | 44.47 | 100 | 3.86% | 6.46% |
| RBA | Ritchie Bros. | | Services | 116.61 | 80 | 47.48% | 6.42% |
| BBSI | Barrett Business | | Staffing | 47.29 | 90 | 0.60% | 6.34% |
| EBAY | eBay | | Retail | 97.06 | 100 | 35.29% | 6.33% |
| HCSG | Healthcare Services | | Services | 14.84 | 90 | 3.66% | 6.23% |
| CSV | Carriage Services | | Services | 48.29 | 70 | 3.86% | 6.11% |
| For chart view version of above stock list: Chart View ➞ 0 - 25 , 25 - 50 , 50 - 75 , 75 - 100 , 100 - 125 , 125 - 150 , 150 - 175 , 175 - 200 , 200 - 225 , 225 - 250 , 250 - 275 , 275 - 300 , 300 - 325 , 325 - 350 , 350 - 375 | ||
 | Click To Change The Sort Order: By Market Cap or Company Size Performance: Year-to-date, Week and Day |  |
|
Get the most comprehensive stock market coverage daily at 12Stocks.com ➞ Best Stocks Today ➞ Best Stocks Weekly ➞ Best Stocks Year-to-Date ➞ Best Stocks Trends ➞  Best Stocks Today 12Stocks.com Best Nasdaq Stocks ➞ Best S&P 500 Stocks ➞ Best Tech Stocks ➞ Best Biotech Stocks ➞ |
| Detailed Overview of Consumer Services Stocks |
| Consumer Services Technical Overview, Leaders & Laggards, Top Consumer Services ETF Funds & Detailed Consumer Services Stocks List, Charts, Trends & More |
| Consumer Services Sector: Technical Analysis, Trends & YTD Performance | |
| Consumer Services sector is composed of stocks
from retail, entertainment, media/publishing, consumer goods
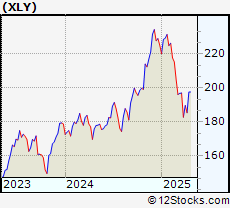
and services subsectors. Consumer Services sector, as represented by XLY, an exchange-traded fund [ETF] that holds basket of Consumer Services stocks (e.g, Walmart, Alibaba) is up by 1.56% and is currently underperforming the overall market by -8.24% year-to-date. Below is a quick view of Technical charts and trends: |
|
 XLY Weekly Chart |
|
| Long Term Trend: Very Good | |
| Medium Term Trend: Very Good | |
 XLY Daily Chart |
|
| Short Term Trend: Very Good | |
| Overall Trend Score: 90 | |
| YTD Performance: 1.56% | |
| **Trend Scores & Views Are Only For Educational Purposes And Not For Investing | |
| 12Stocks.com: Top Performing Consumer Services Sector Stocks | ||||||||||||||||||||||||||||||||||||||||||||||||
 The top performing Consumer Services sector stocks year to date are
Now, more recently, over last week, the top performing Consumer Services sector stocks on the move are


|
||||||||||||||||||||||||||||||||||||||||||||||||
| 12Stocks.com: Investing in Consumer Services Sector using Exchange Traded Funds | |
|
The following table shows list of key exchange traded funds (ETF) that
help investors track Consumer Services Index. For detailed view, check out our ETF Funds section of our website. Quick View: Move mouse or cursor over ETF symbol (ticker) to view short-term Technical chart and over ETF name to view long term chart. Click on ticker or stock name for detailed view. Click on to add stock symbol to your watchlist and to view watchlist. |
12Stocks.com List of ETFs that track Consumer Services Index
| Ticker | ETF Name | Watchlist | Recent Price | Smart Investing & Trading Score | Change % | Week % | Year-to-date % |
| XLY | Consumer Discret Sel | | 226.74 | 90 | 2.01 | 3.58 | 1.56% |
| RTH | Retail | | 245.88 | 90 | 0.63 | 2.04 | 9.67% |
| IYC | Consumer Services | | 101.87 | 90 | 1.68 | 2.71 | 6.29% |
| XRT | Retail | | 83.23 | 90 | 2.54 | 4.59 | 5.13% |
| IYK | Consumer Goods | | 70.15 | 40 | 0.37 | 1.9 | 8.01% |
| UCC | Consumer Services | | 48.63 | 90 | 2.96 | 7 | -5.38% |
| RETL | Retail Bull 3X | | 9.28 | 90 | 26.94 | 13.31 | -5.36% |
| SCC | Short Consumer Services | | 16.35 | 0 | -19.86 | -6.67 | -9.94% |
| UGE | Consumer Goods | | 19.12 | 50 | 1.05 | 5.18 | 6.94% |
| 12Stocks.com: Charts, Trends, Fundamental Data and Performances of Consumer Services Stocks | |
|
We now take in-depth look at all Consumer Services stocks including charts, multi-period performances and overall trends (as measured by Smart Investing & Trading Score). One can sort Consumer Services stocks (click link to choose) by Daily, Weekly and by Year-to-Date performances. Also, one can sort by size of the company or by market capitalization. |
| Select Your Default Chart Type: | |||||
| |||||
| Click on stock symbol or name for detailed view. Click on to add stock symbol to your watchlist and to view watchlist. Quick View: Move mouse or cursor over "Daily" to quickly view daily Technical stock chart and over "Weekly" to view weekly Technical stock chart. | |||||

 | SAH Sonic Automotive, Inc. |
| Sector: Services & Goods | |
| SubSector: Auto Dealerships | |
| MarketCap: 581.321 Millions | |
| Recent Price: 78.50 Smart Investing & Trading Score: 70 | |
| Day Percent Change: 4.4% Day Change: 2.64 | |
| Week Change: 8.2% Year-to-date Change: 25.2% | |
| SAH Links: Profile News Message Board | |
| Charts:- Daily , Weekly | |
| Add SAH to Watchlist: View: Get Complete SAH Trend Analysis ➞ | |
 | NYT The New York Times Company |
| Sector: Services & Goods | |
| SubSector: Publishing - Newspapers | |
| MarketCap: 5188.22 Millions | |
| Recent Price: 58.01 Smart Investing & Trading Score: 60 | |
| Day Percent Change: 0.77% Day Change: 0.42 | |
| Week Change: 8.19% Year-to-date Change: 12.5% | |
| NYT Links: Profile News Message Board | |
| Charts:- Daily , Weekly | |
| Add NYT to Watchlist: View: Get Complete NYT Trend Analysis ➞ | |
 | AMC AMC Entertainment Holdings, Inc. |
| Sector: Services & Goods | |
| SubSector: Movie Production, Theaters | |
| MarketCap: 415.929 Millions | |
| Recent Price: 3.07 Smart Investing & Trading Score: 50 | |
| Day Percent Change: 2.85% Day Change: 0.14 | |
| Week Change: 8.1% Year-to-date Change: -22.9% | |
| AMC Links: Profile News Message Board | |
| Charts:- Daily , Weekly | |
| Add AMC to Watchlist: View: Get Complete AMC Trend Analysis ➞ | |
 | MUSA Murphy USA Inc. |
| Sector: Services & Goods | |
| SubSector: Specialty Retail, Other | |
| MarketCap: 3133.14 Millions | |
| Recent Price: 390.59 Smart Investing & Trading Score: 50 | |
| Day Percent Change: 1.21% Day Change: 6.14 | |
| Week Change: 7.95% Year-to-date Change: -22.0% | |
| MUSA Links: Profile News Message Board | |
| Charts:- Daily , Weekly | |
| Add MUSA to Watchlist: View: Get Complete MUSA Trend Analysis ➞ | |
 | NXST Nexstar Media Group, Inc. |
| Sector: Services & Goods | |
| SubSector: Broadcasting - TV | |
| MarketCap: 2763.73 Millions | |
| Recent Price: 202.05 Smart Investing & Trading Score: 100 | |
| Day Percent Change: 2.48% Day Change: 4.15 | |
| Week Change: 7.92% Year-to-date Change: 30.9% | |
| NXST Links: Profile News Message Board | |
| Charts:- Daily , Weekly | |
| Add NXST to Watchlist: View: Get Complete NXST Trend Analysis ➞ | |
 | DENN Denny s Corporation |
| Sector: Services & Goods | |
| SubSector: Restaurants | |
| MarketCap: 367.47 Millions | |
| Recent Price: 3.82 Smart Investing & Trading Score: 70 | |
| Day Percent Change: 2.46% Day Change: 0.15 | |
| Week Change: 7.91% Year-to-date Change: -36.9% | |
| DENN Links: Profile News Message Board | |
| Charts:- Daily , Weekly | |
| Add DENN to Watchlist: View: Get Complete DENN Trend Analysis ➞ | |
 | IMKTA Ingles Markets, Incorporated |
| Sector: Services & Goods | |
| SubSector: Grocery Stores | |
| MarketCap: 827.075 Millions | |
| Recent Price: 64.32 Smart Investing & Trading Score: 80 | |
| Day Percent Change: 1.98% Day Change: 1.4 | |
| Week Change: 7.88% Year-to-date Change: 0.6% | |
| IMKTA Links: Profile News Message Board | |
| Charts:- Daily , Weekly | |
| Add IMKTA to Watchlist: View: Get Complete IMKTA Trend Analysis ➞ | |
 | SBH Sally Beauty Holdings, Inc. |
| Sector: Services & Goods | |
| SubSector: Specialty Retail, Other | |
| MarketCap: 1229.44 Millions | |
| Recent Price: 12.57 Smart Investing & Trading Score: 100 | |
| Day Percent Change: 1.77% Day Change: 0.23 | |
| Week Change: 7.8% Year-to-date Change: 20.3% | |
| SBH Links: Profile News Message Board | |
| Charts:- Daily , Weekly | |
| Add SBH to Watchlist: View: Get Complete SBH Trend Analysis ➞ | |
 | QS QuantumScape Corporation |
| Sector: Services & Goods | |
| SubSector: Auto Parts | |
| MarketCap: 13137 Millions | |
| Recent Price: 9.35 Smart Investing & Trading Score: 60 | |
| Day Percent Change: 1.08% Day Change: 0.06 | |
| Week Change: 7.59% Year-to-date Change: 80.2% | |
| QS Links: Profile News Message Board | |
| Charts:- Daily , Weekly | |
| Add QS to Watchlist: View: Get Complete QS Trend Analysis ➞ | |
 | FIGS FIGS, Inc. |
| Sector: Services & Goods | |
| SubSector: Apparel Manufacturing | |
| MarketCap: 1370 Millions | |
| Recent Price: 6.63 Smart Investing & Trading Score: 80 | |
| Day Percent Change: 4.8% Day Change: 0.27 | |
| Week Change: 7.46% Year-to-date Change: 7.1% | |
| FIGS Links: Profile News Message Board | |
| Charts:- Daily , Weekly | |
| Add FIGS to Watchlist: View: Get Complete FIGS Trend Analysis ➞ | |
 | DXPE DXP Enterprises, Inc. |
| Sector: Services & Goods | |
| SubSector: Industrial Equipment Wholesale | |
| MarketCap: 243.758 Millions | |
| Recent Price: 122.29 Smart Investing & Trading Score: 100 | |
| Day Percent Change: 3.67% Day Change: 1.84 | |
| Week Change: 7.14% Year-to-date Change: 48.0% | |
| DXPE Links: Profile News Message Board | |
| Charts:- Daily , Weekly | |
| Add DXPE to Watchlist: View: Get Complete DXPE Trend Analysis ➞ | |
 | RRGB Red Robin Gourmet Burgers, Inc. |
| Sector: Services & Goods | |
| SubSector: Restaurants | |
| MarketCap: 121.57 Millions | |
| Recent Price: 6.16 Smart Investing & Trading Score: 60 | |
| Day Percent Change: -69.46% Day Change: -9.87 | |
| Week Change: 6.94% Year-to-date Change: 12.2% | |
| RRGB Links: Profile News Message Board | |
| Charts:- Daily , Weekly | |
| Add RRGB to Watchlist: View: Get Complete RRGB Trend Analysis ➞ | |
 | VLGEA Village Super Market, Inc. |
| Sector: Services & Goods | |
| SubSector: Grocery Stores | |
| MarketCap: 222.375 Millions | |
| Recent Price: 35.90 Smart Investing & Trading Score: 50 | |
| Day Percent Change: 3.83% Day Change: 1.16 | |
| Week Change: 6.85% Year-to-date Change: 15.0% | |
| VLGEA Links: Profile News Message Board | |
| Charts:- Daily , Weekly | |
| Add VLGEA to Watchlist: View: Get Complete VLGEA Trend Analysis ➞ | |
 | LTH Life Time Group Holdings, Inc. |
| Sector: Services & Goods | |
| SubSector: Leisure | |
| MarketCap: 3740 Millions | |
| Recent Price: 27.60 Smart Investing & Trading Score: 10 | |
| Day Percent Change: 4.76% Day Change: 1.13 | |
| Week Change: 6.85% Year-to-date Change: 24.8% | |
| LTH Links: Profile News Message Board | |
| Charts:- Daily , Weekly | |
| Add LTH to Watchlist: View: Get Complete LTH Trend Analysis ➞ | |
 | CBRL Cracker Barrel Old Country Store, Inc. |
| Sector: Services & Goods | |
| SubSector: Restaurants | |
| MarketCap: 1839.6 Millions | |
| Recent Price: 59.88 Smart Investing & Trading Score: 60 | |
| Day Percent Change: -0.46% Day Change: -0.19 | |
| Week Change: 6.8% Year-to-date Change: 15.0% | |
| CBRL Links: Profile News Message Board | |
| Charts:- Daily , Weekly | |
| Add CBRL to Watchlist: View: Get Complete CBRL Trend Analysis ➞ | |
 | HZO MarineMax, Inc. |
| Sector: Services & Goods | |
| SubSector: Specialty Retail, Other | |
| MarketCap: 234.744 Millions | |
| Recent Price: 24.86 Smart Investing & Trading Score: 90 | |
| Day Percent Change: 7.86% Day Change: 2.34 | |
| Week Change: 6.74% Year-to-date Change: -14.1% | |
| HZO Links: Profile News Message Board | |
| Charts:- Daily , Weekly | |
| Add HZO to Watchlist: View: Get Complete HZO Trend Analysis ➞ | |
 | FAST Fastenal Company |
| Sector: Services & Goods | |
| SubSector: Industrial Equipment Wholesale | |
| MarketCap: 17609.9 Millions | |
| Recent Price: 48.45 Smart Investing & Trading Score: 100 | |
| Day Percent Change: 20.11% Day Change: 11.4 | |
| Week Change: 6.62% Year-to-date Change: 36.9% | |
| FAST Links: Profile News Message Board | |
| Charts:- Daily , Weekly | |
| Add FAST to Watchlist: View: Get Complete FAST Trend Analysis ➞ | |
 | WINA Winmark Corporation |
| Sector: Services & Goods | |
| SubSector: Specialty Retail, Other | |
| MarketCap: 520.444 Millions | |
| Recent Price: 404.43 Smart Investing & Trading Score: 90 | |
| Day Percent Change: 2.73% Day Change: 9.88 | |
| Week Change: 6.51% Year-to-date Change: 3.4% | |
| WINA Links: Profile News Message Board | |
| Charts:- Daily , Weekly | |
| Add WINA to Watchlist: View: Get Complete WINA Trend Analysis ➞ | |
 | RUSHB Rush Enterprises, Inc. |
| Sector: Services & Goods | |
| SubSector: Auto Dealerships | |
| MarketCap: 203.221 Millions | |
| Recent Price: 57.95 Smart Investing & Trading Score: 100 | |
| Day Percent Change: 6.54% Day Change: 2.93 | |
| Week Change: 6.48% Year-to-date Change: 7.5% | |
| RUSHB Links: Profile News Message Board | |
| Charts:- Daily , Weekly | |
| Add RUSHB to Watchlist: View: Get Complete RUSHB Trend Analysis ➞ | |
 | MGA Magna International Inc. |
| Sector: Services & Goods | |
| SubSector: Auto Parts Wholesale | |
| MarketCap: 8967.3 Millions | |
| Recent Price: 44.47 Smart Investing & Trading Score: 100 | |
| Day Percent Change: 3.86% Day Change: 1.58 | |
| Week Change: 6.46% Year-to-date Change: 9.3% | |
| MGA Links: Profile News Message Board | |
| Charts:- Daily , Weekly | |
| Add MGA to Watchlist: View: Get Complete MGA Trend Analysis ➞ | |
 | RBA Ritchie Bros. Auctioneers Incorporated |
| Sector: Services & Goods | |
| SubSector: Business Services | |
| MarketCap: 3491.02 Millions | |
| Recent Price: 116.61 Smart Investing & Trading Score: 80 | |
| Day Percent Change: 47.48% Day Change: 27.58 | |
| Week Change: 6.42% Year-to-date Change: 30.0% | |
| RBA Links: Profile News Message Board | |
| Charts:- Daily , Weekly | |
| Add RBA to Watchlist: View: Get Complete RBA Trend Analysis ➞ | |
 | BBSI Barrett Business Services, Inc. |
| Sector: Services & Goods | |
| SubSector: Staffing & Outsourcing Services | |
| MarketCap: 262.028 Millions | |
| Recent Price: 47.29 Smart Investing & Trading Score: 90 | |
| Day Percent Change: 0.6% Day Change: 0.22 | |
| Week Change: 6.34% Year-to-date Change: 9.3% | |
| BBSI Links: Profile News Message Board | |
| Charts:- Daily , Weekly | |
| Add BBSI to Watchlist: View: Get Complete BBSI Trend Analysis ➞ | |
 | EBAY eBay Inc. |
| Sector: Services & Goods | |
| SubSector: Specialty Retail, Other | |
| MarketCap: 23152.3 Millions | |
| Recent Price: 97.06 Smart Investing & Trading Score: 100 | |
| Day Percent Change: 35.29% Day Change: 15.36 | |
| Week Change: 6.33% Year-to-date Change: 58.0% | |
| EBAY Links: Profile News Message Board | |
| Charts:- Daily , Weekly | |
| Add EBAY to Watchlist: View: Get Complete EBAY Trend Analysis ➞ | |
 | HCSG Healthcare Services Group, Inc. |
| Sector: Services & Goods | |
| SubSector: Business Services | |
| MarketCap: 1758.32 Millions | |
| Recent Price: 14.84 Smart Investing & Trading Score: 90 | |
| Day Percent Change: 3.66% Day Change: 0.38 | |
| Week Change: 6.23% Year-to-date Change: 27.8% | |
| HCSG Links: Profile News Message Board | |
| Charts:- Daily , Weekly | |
| Add HCSG to Watchlist: View: Get Complete HCSG Trend Analysis ➞ | |
 | CSV Carriage Services, Inc. |
| Sector: Services & Goods | |
| SubSector: Personal Services | |
| MarketCap: 304.725 Millions | |
| Recent Price: 48.29 Smart Investing & Trading Score: 70 | |
| Day Percent Change: 3.86% Day Change: 1.2 | |
| Week Change: 6.11% Year-to-date Change: 22.2% | |
| CSV Links: Profile News Message Board | |
| Charts:- Daily , Weekly | |
| Add CSV to Watchlist: View: Get Complete CSV Trend Analysis ➞ | |
| For tabular summary view of above stock list: Summary View ➞ 0 - 25 , 25 - 50 , 50 - 75 , 75 - 100 , 100 - 125 , 125 - 150 , 150 - 175 , 175 - 200 , 200 - 225 , 225 - 250 , 250 - 275 , 275 - 300 , 300 - 325 , 325 - 350 , 350 - 375 | ||
| Click To Change The Sort Order: By Market Cap or Company Size Performance: Year-to-date, Week and Day | |
| Select Chart Type: | ||
|
Best Stocks Today 12Stocks.com |
© 2025 12Stocks.com Terms & Conditions Privacy Contact Us
All Information Provided Only For Education And Not To Be Used For Investing or Trading. See Terms & Conditions


One More Thing ... Get Best Stocks Delivered Daily!
Never Ever Miss A Move With Our Top Ten Stocks Lists
Find Best Stocks In Any Market - Bull or Bear Market
Take A Peek At Our Top Ten Stocks Lists: Daily, Weekly, Year-to-Date & Top Trends
Find Best Stocks In Any Market - Bull or Bear Market
Take A Peek At Our Top Ten Stocks Lists: Daily, Weekly, Year-to-Date & Top Trends
Consumer Services Stocks With Best Up Trends [0-bearish to 100-bullish]: VSE [100], eBay [100], Kratos Defense[100], Graham [100], CompX [100], Fastenal [100], Jacobs Engineering[100], Willdan [100], Gray Television[100], Williams-Sonoma [100], Rush Enterprises[100]
Best Consumer Services Stocks Year-to-Date:
ThredUp [640.29%], Vivid Seats[278.19%], Willdan [211.45%], Kratos Defense[162.09%], Roblox [123.87%], National Vision[120.92%], Altisource Portfolio[99.84%], Noodles & [90.05%], Gray Television[89.96%], QuantumScape [80.15%], PaySign [80.13%] Best Consumer Services Stocks This Week:
Vivid Seats[1616.67%], Holley [66.18%], Money[64.55%], Myriad Genetics[55.81%], Grocery Outlet[42.09%], RealReal [33.98%], CompX [30.87%], Willdan [30.08%], comScore [29.36%], Arhaus [27.48%], Gray Television[26.37%] Best Consumer Services Stocks Daily:
CareDx [185.69%], Wingstop [150.46%], National CineMedia[112.46%], VSE [69.41%], Burlington Stores[66.03%], Myriad Genetics[64.88%], Costco Wholesale[58.1%], Daily Journal[57.5%], Texas Roadhouse[55.27%], Royal Caribbean[53.63%], CRA [53.26%]