
 Login Sign Up


| |||||
 |  | ||||

| 12Stocks.com Market Intelligence |
Best Consumer Services Stocks
| In a hurry? Services & Goods Stocks: Performance Trends Table, Stock Charts
Sort Consumer Services: Daily, Weekly, Year-to-Date, Market Cap & Trends. Filter Services & Goods stocks list by size: All Large Mid-Range Small |
| 12Stocks.com Consumer Services Stocks Performances & Trends Daily | |||||||||
|
|  The overall Smart Investing & Trading Score is 100 (0-bearish to 100-bullish) which puts Consumer Services sector in short term bullish trend. The Smart Investing & Trading Score from previous trading session is 50 and an improvement of trend continues.
| ||||||||
Here are the Smart Investing & Trading Scores of the most requested Consumer Services stocks at 12Stocks.com (click stock name for detailed review):
|


| Consider signing up for our daily 12Stocks.com "Best Stocks Newsletter". You will never ever miss a big stock move again! |
| 12Stocks.com: Investing in Consumer Services sector with Stocks | |
|
The following table helps investors and traders sort through current performance and trends (as measured by Smart Investing & Trading Score) of various
stocks in the Consumer Services sector. Quick View: Move mouse or cursor over stock symbol (ticker) to view short-term Technical chart and over stock name to view long term chart. Click on  to add stock symbol to your watchlist and to add stock symbol to your watchlist and  to view watchlist. Click on any ticker or stock name for detailed market intelligence report for that stock. to view watchlist. Click on any ticker or stock name for detailed market intelligence report for that stock. |
12Stocks.com Performance of Stocks in Consumer Services Sector
| Ticker | Stock Name | Watchlist | Category | Recent Price | Smart Investing & Trading Score | Change % | YTD Change% |
| HBB | Hamilton Beach |   | Furnishings, Fixtures & Appliances | 14.57 | 20 | -0.41% | -9.17% |
| LKQ | LKQ Corp | | Auto Parts | 32.30 | 60 | -1.88% | -9.59% |
| BBY | Best Buy | | Specialty Retail | 75.87 | 60 | -3.30% | -9.60% |
| VAC | Marriott Vacations | | Casinos | 77.07 | 40 | -3.00% | -9.76% |
| SBUX | Starbucks Corp | | Restaurants | 81.90 | 0 | -0.56% | -10.03% |
| MBUU | Malibu Boats | | Recreational | 32.66 | 70 | -3.54% | -10.23% |
| XPEL | XPEL | | Auto Parts | 34.68 | 20 | -3.40% | -11.01% |
| LOCO | El Pollo | | Restaurants | 10.12 | 0 | -2.97% | -11.31% |
| GHG | GreenTree Hospitality | | Lodging | 2.24 | 90 | 7.30% | -11.36% |
| THRM | Gentherm | | Auto Parts | 34.81 | 30 | -3.33% | -11.49% |
| ICLK | iClick Interactive | | Marketing | 9.24 | 80 | 10.00% | -11.58% |
| IP | Paper | | Packaging | 45.99 | 0 | -1.16% | -11.92% |
| DBI | Designer Brands | | Footwear & Accessories | 4.54 | 90 | 0.22% | -12.03% |
| REYN | Reynolds Consumer | | Packaging | 23.03 | 50 | -1.29% | -12.45% |
| SKY | Champion Homes | | Residential Construction | 74.70 | 70 | -2.01% | -13.12% |
| SLGN | Silgan | | Packaging | 43.98 | 0 | -1.21% | -13.19% |
| WH | Wyndham Hotels | | Lodging | 85.81 | 40 | -3.00% | -13.19% |
| AMWD | American Woodmark | | Furnishings, Fixtures & Appliances | 68.32 | 100 | -0.20% | -13.26% |
| ESCA | Escalade | | Leisure | 12.40 | 10 | -1.04% | -13.36% |
| ECX | ECARX | | Auto Parts | 1.75 | 80 | 0.00% | -13.37% |
| BJRI | BJ's Restaurant | | Restaurants | 30.93 | 0 | -4.42% | -13.84% |
| GBTG | Global Business | | Travel Services | 8.16 | 58 | 1.01% | -14.01% |
| PTON | Peloton Interactive | | Leisure | 7.58 | 30 | -0.92% | -14.16% |
| HEPS | D-MARKET Electronic | | Internet Retail | 2.71 | 20 | 0.74% | -14.24% |
| PSNY | Polestar Automotive | | Auto Manufacturers | 0.94 | 0 | -2.74% | -14.25% |
| For chart view version of above stock list: Chart View ➞ 0 - 25 , 25 - 50 , 50 - 75 , 75 - 100 , 100 - 125 , 125 - 150 , 150 - 175 , 175 - 200 , 200 - 225 , 225 - 250 , 250 - 275 , 275 - 300 , 300 - 325 , 325 - 350 , 350 - 375 , 375 - 400 , 400 - 425 , 425 - 450 , 450 - 475 , 475 - 500 , 500 - 525 , 525 - 550 , 550 - 575 , 575 - 600 , 600 - 625 | ||
 | Click To Change The Sort Order: By Market Cap or Company Size Performance: Year-to-date, Week and Day |  |
|
Get the most comprehensive stock market coverage daily at 12Stocks.com ➞ Best Stocks Today ➞ Best Stocks Weekly ➞ Best Stocks Year-to-Date ➞ Best Stocks Trends ➞  Best Stocks Today 12Stocks.com Best Nasdaq Stocks ➞ Best S&P 500 Stocks ➞ Best Tech Stocks ➞ Best Biotech Stocks ➞ |
| Detailed Overview of Consumer Services Stocks |
| Consumer Services Technical Overview, Leaders & Laggards, Top Consumer Services ETF Funds & Detailed Consumer Services Stocks List, Charts, Trends & More |
| Consumer Services Sector: Technical Analysis, Trends & YTD Performance | |
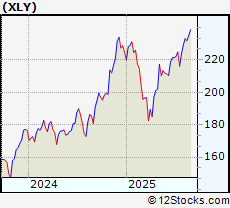
| Consumer Services sector is composed of stocks
from retail, entertainment, media/publishing, consumer goods
and services subsectors. Consumer Services sector, as represented by XLY, an exchange-traded fund [ETF] that holds basket of Consumer Services stocks (e.g, Walmart, Alibaba) is up by 8.30867% and is currently underperforming the overall market by -4.54233% year-to-date. Below is a quick view of Technical charts and trends: |
|
 XLY Weekly Chart |
|
| Long Term Trend: Very Good | |
| Medium Term Trend: Good | |
 XLY Daily Chart |
|
| Short Term Trend: Very Good | |
| Overall Trend Score: 100 | |
| YTD Performance: 8.30867% | |
| **Trend Scores & Views Are Only For Educational Purposes And Not For Investing | |
| 12Stocks.com: Top Performing Consumer Services Sector Stocks | ||||||||||||||||||||||||||||||||||||||||||||||||
 The top performing Consumer Services sector stocks year to date are
Now, more recently, over last week, the top performing Consumer Services sector stocks on the move are


|
||||||||||||||||||||||||||||||||||||||||||||||||
| 12Stocks.com: Investing in Consumer Services Sector using Exchange Traded Funds | |
|
The following table shows list of key exchange traded funds (ETF) that
help investors track Consumer Services Index. For detailed view, check out our ETF Funds section of our website. Quick View: Move mouse or cursor over ETF symbol (ticker) to view short-term Technical chart and over ETF name to view long term chart. Click on ticker or stock name for detailed view. Click on to add stock symbol to your watchlist and to view watchlist. |
12Stocks.com List of ETFs that track Consumer Services Index
| Ticker | ETF Name | Watchlist | Recent Price | Smart Investing & Trading Score | Change % | Week % | Year-to-date % |
| PMR | Retail | | 40.96 | 70 | -0.0244081 | 2.86288 | 0% |
| 12Stocks.com: Charts, Trends, Fundamental Data and Performances of Consumer Services Stocks | |
|
We now take in-depth look at all Consumer Services stocks including charts, multi-period performances and overall trends (as measured by Smart Investing & Trading Score). One can sort Consumer Services stocks (click link to choose) by Daily, Weekly and by Year-to-Date performances. Also, one can sort by size of the company or by market capitalization. |
| Select Your Default Chart Type: | |||||
| |||||
| Click on stock symbol or name for detailed view. Click on to add stock symbol to your watchlist and to view watchlist. Quick View: Move mouse or cursor over "Daily" to quickly view daily Technical stock chart and over "Weekly" to view weekly Technical stock chart. | |||||

 | HBB Hamilton Beach Brands Holding Co |
| Sector: Services & Goods | |
| SubSector: Furnishings, Fixtures & Appliances | |
| MarketCap: 203.64 Millions | |
| Recent Price: 14.57 Smart Investing & Trading Score: 20 | |
| Day Percent Change: -0.410116% Day Change: 0.98 | |
| Week Change: -3.70126% Year-to-date Change: -9.2% | |
| HBB Links: Profile News Message Board | |
| Charts:- Daily , Weekly | |
| Add HBB to Watchlist: View: Get Complete HBB Trend Analysis ➞ | |
 | LKQ LKQ Corp |
| Sector: Services & Goods | |
| SubSector: Auto Parts | |
| MarketCap: 8331.15 Millions | |
| Recent Price: 32.30 Smart Investing & Trading Score: 60 | |
| Day Percent Change: -1.88335% Day Change: -0.45 | |
| Week Change: 0% Year-to-date Change: -9.6% | |
| LKQ Links: Profile News Message Board | |
| Charts:- Daily , Weekly | |
| Add LKQ to Watchlist: View: Get Complete LKQ Trend Analysis ➞ | |
 | BBY Best Buy Co. Inc |
| Sector: Services & Goods | |
| SubSector: Specialty Retail | |
| MarketCap: 16098.3 Millions | |
| Recent Price: 75.87 Smart Investing & Trading Score: 60 | |
| Day Percent Change: -3.30105% Day Change: -2.34 | |
| Week Change: -1.53147% Year-to-date Change: -9.6% | |
| BBY Links: Profile News Message Board | |
| Charts:- Daily , Weekly | |
| Add BBY to Watchlist: View: Get Complete BBY Trend Analysis ➞ | |
 | VAC Marriott Vacations Worldwide Corp |
| Sector: Services & Goods | |
| SubSector: Resorts & Casinos | |
| MarketCap: 2734.29 Millions | |
| Recent Price: 77.07 Smart Investing & Trading Score: 40 | |
| Day Percent Change: -2.99559% Day Change: -1.65 | |
| Week Change: -2.22025% Year-to-date Change: -9.8% | |
| VAC Links: Profile News Message Board | |
| Charts:- Daily , Weekly | |
| Add VAC to Watchlist: View: Get Complete VAC Trend Analysis ➞ | |
 | SBUX Starbucks Corp |
| Sector: Services & Goods | |
| SubSector: Restaurants | |
| MarketCap: 97108.3 Millions | |
| Recent Price: 81.90 Smart Investing & Trading Score: 0 | |
| Day Percent Change: -0.558524% Day Change: -0.49 | |
| Week Change: -5.87289% Year-to-date Change: -10.0% | |
| SBUX Links: Profile News Message Board | |
| Charts:- Daily , Weekly | |
| Add SBUX to Watchlist: View: Get Complete SBUX Trend Analysis ➞ | |
 | MBUU Malibu Boats Inc |
| Sector: Services & Goods | |
| SubSector: Recreational Vehicles | |
| MarketCap: 647.79 Millions | |
| Recent Price: 32.66 Smart Investing & Trading Score: 70 | |
| Day Percent Change: -3.544% Day Change: -0.22 | |
| Week Change: -1.62651% Year-to-date Change: -10.2% | |
| MBUU Links: Profile News Message Board | |
| Charts:- Daily , Weekly | |
| Add MBUU to Watchlist: View: Get Complete MBUU Trend Analysis ➞ | |
 | XPEL XPEL Inc |
| Sector: Services & Goods | |
| SubSector: Auto Parts | |
| MarketCap: 987.36 Millions | |
| Recent Price: 34.68 Smart Investing & Trading Score: 20 | |
| Day Percent Change: -3.39833% Day Change: -0.23 | |
| Week Change: -3.34448% Year-to-date Change: -11.0% | |
| XPEL Links: Profile News Message Board | |
| Charts:- Daily , Weekly | |
| Add XPEL to Watchlist: View: Get Complete XPEL Trend Analysis ➞ | |
 | LOCO El Pollo Loco Holdings Inc |
| Sector: Services & Goods | |
| SubSector: Restaurants | |
| MarketCap: 313.75 Millions | |
| Recent Price: 10.12 Smart Investing & Trading Score: 0 | |
| Day Percent Change: -2.9722% Day Change: 0.01 | |
| Week Change: -2.59865% Year-to-date Change: -11.3% | |
| LOCO Links: Profile News Message Board | |
| Charts:- Daily , Weekly | |
| Add LOCO to Watchlist: View: Get Complete LOCO Trend Analysis ➞ | |
 | GHG GreenTree Hospitality Group Ltd ADR |
| Sector: Services & Goods | |
| SubSector: Lodging | |
| MarketCap: 134.19 Millions | |
| Recent Price: 2.24 Smart Investing & Trading Score: 90 | |
| Day Percent Change: 7.29665% Day Change: 0 | |
| Week Change: 2.86697% Year-to-date Change: -11.4% | |
| GHG Links: Profile News Message Board | |
| Charts:- Daily , Weekly | |
| Add GHG to Watchlist: View: Get Complete GHG Trend Analysis ➞ | |
 | THRM Gentherm Inc |
| Sector: Services & Goods | |
| SubSector: Auto Parts | |
| MarketCap: 1100.39 Millions | |
| Recent Price: 34.81 Smart Investing & Trading Score: 30 | |
| Day Percent Change: -3.33241% Day Change: -0.5 | |
| Week Change: -2.90098% Year-to-date Change: -11.5% | |
| THRM Links: Profile News Message Board | |
| Charts:- Daily , Weekly | |
| Add THRM to Watchlist: View: Get Complete THRM Trend Analysis ➞ | |
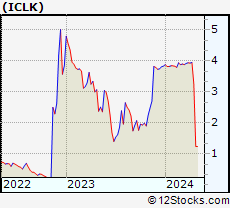 | ICLK iClick Interactive Asia Group Limited |
| Sector: Services & Goods | |
| SubSector: Marketing Services | |
| MarketCap: 258.915 Millions | |
| Recent Price: 9.24 Smart Investing & Trading Score: 80 | |
| Day Percent Change: 10% Day Change: -9999 | |
| Week Change: 42.3729% Year-to-date Change: -11.6% | |
| ICLK Links: Profile News Message Board | |
| Charts:- Daily , Weekly | |
| Add ICLK to Watchlist: View: Get Complete ICLK Trend Analysis ➞ | |
 | IP International Paper Co |
| Sector: Services & Goods | |
| SubSector: Packaging & Containers | |
| MarketCap: 25707.4 Millions | |
| Recent Price: 45.99 Smart Investing & Trading Score: 0 | |
| Day Percent Change: -1.16054% Day Change: -0.5 | |
| Week Change: -4.80232% Year-to-date Change: -11.9% | |
| IP Links: Profile News Message Board | |
| Charts:- Daily , Weekly | |
| Add IP to Watchlist: View: Get Complete IP Trend Analysis ➞ | |
 | DBI Designer Brands Inc |
| Sector: Services & Goods | |
| SubSector: Footwear & Accessories | |
| MarketCap: 230.94 Millions | |
| Recent Price: 4.54 Smart Investing & Trading Score: 90 | |
| Day Percent Change: 0.220751% Day Change: 0.29 | |
| Week Change: 2.94785% Year-to-date Change: -12.0% | |
| DBI Links: Profile News Message Board | |
| Charts:- Daily , Weekly | |
| Add DBI to Watchlist: View: Get Complete DBI Trend Analysis ➞ | |
 | REYN Reynolds Consumer Products Inc |
| Sector: Services & Goods | |
| SubSector: Packaging & Containers | |
| MarketCap: 5003.63 Millions | |
| Recent Price: 23.03 Smart Investing & Trading Score: 50 | |
| Day Percent Change: -1.2859% Day Change: -0.03 | |
| Week Change: -2.29105% Year-to-date Change: -12.5% | |
| REYN Links: Profile News Message Board | |
| Charts:- Daily , Weekly | |
| Add REYN to Watchlist: View: Get Complete REYN Trend Analysis ➞ | |
 | SKY Champion Homes Inc |
| Sector: Services & Goods | |
| SubSector: Residential Construction | |
| MarketCap: 4431.02 Millions | |
| Recent Price: 74.70 Smart Investing & Trading Score: 70 | |
| Day Percent Change: -2.00708% Day Change: -0.12 | |
| Week Change: -5.25114% Year-to-date Change: -13.1% | |
| SKY Links: Profile News Message Board | |
| Charts:- Daily , Weekly | |
| Add SKY to Watchlist: View: Get Complete SKY Trend Analysis ➞ | |
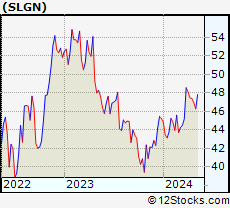 | SLGN Silgan Holdings Inc |
| Sector: Services & Goods | |
| SubSector: Packaging & Containers | |
| MarketCap: 4832.88 Millions | |
| Recent Price: 43.98 Smart Investing & Trading Score: 0 | |
| Day Percent Change: -1.21294% Day Change: -0.48 | |
| Week Change: -1.9398% Year-to-date Change: -13.2% | |
| SLGN Links: Profile News Message Board | |
| Charts:- Daily , Weekly | |
| Add SLGN to Watchlist: View: Get Complete SLGN Trend Analysis ➞ | |
 | WH Wyndham Hotels & Resorts Inc |
| Sector: Services & Goods | |
| SubSector: Lodging | |
| MarketCap: 6594.13 Millions | |
| Recent Price: 85.81 Smart Investing & Trading Score: 40 | |
| Day Percent Change: -2.9957% Day Change: -2.27 | |
| Week Change: -0.463983% Year-to-date Change: -13.2% | |
| WH Links: Profile News Message Board | |
| Charts:- Daily , Weekly | |
| Add WH to Watchlist: View: Get Complete WH Trend Analysis ➞ | |
 | AMWD American Woodmark Corp |
| Sector: Services & Goods | |
| SubSector: Furnishings, Fixtures & Appliances | |
| MarketCap: 997.1 Millions | |
| Recent Price: 68.32 Smart Investing & Trading Score: 100 | |
| Day Percent Change: -0.19721% Day Change: 0.01 | |
| Week Change: 2.82962% Year-to-date Change: -13.3% | |
| AMWD Links: Profile News Message Board | |
| Charts:- Daily , Weekly | |
| Add AMWD to Watchlist: View: Get Complete AMWD Trend Analysis ➞ | |
 | ESCA Escalade, Inc |
| Sector: Services & Goods | |
| SubSector: Leisure | |
| MarketCap: 177.52 Millions | |
| Recent Price: 12.40 Smart Investing & Trading Score: 10 | |
| Day Percent Change: -1.03751% Day Change: -0.01 | |
| Week Change: -2.89742% Year-to-date Change: -13.4% | |
| ESCA Links: Profile News Message Board | |
| Charts:- Daily , Weekly | |
| Add ESCA to Watchlist: View: Get Complete ESCA Trend Analysis ➞ | |
 | ECX ECARX Holdings Inc |
| Sector: Services & Goods | |
| SubSector: Auto Parts | |
| MarketCap: 575.54 Millions | |
| Recent Price: 1.75 Smart Investing & Trading Score: 80 | |
| Day Percent Change: 0% Day Change: 0.03 | |
| Week Change: 14.3791% Year-to-date Change: -13.4% | |
| ECX Links: Profile News Message Board | |
| Charts:- Daily , Weekly | |
| Add ECX to Watchlist: View: Get Complete ECX Trend Analysis ➞ | |
 | BJRI BJ's Restaurant Inc |
| Sector: Services & Goods | |
| SubSector: Restaurants | |
| MarketCap: 742.49 Millions | |
| Recent Price: 30.93 Smart Investing & Trading Score: 0 | |
| Day Percent Change: -4.41904% Day Change: -0.69 | |
| Week Change: -8.76106% Year-to-date Change: -13.8% | |
| BJRI Links: Profile News Message Board | |
| Charts:- Daily , Weekly | |
| Add BJRI to Watchlist: View: Get Complete BJRI Trend Analysis ➞ | |
 | GBTG Global Business Travel Group Inc |
| Sector: Services & Goods | |
| SubSector: Travel Services | |
| MarketCap: 3884.82 Millions | |
| Recent Price: 8.16 Smart Investing & Trading Score: 58 | |
| Day Percent Change: 1.01% Day Change: 0.08 | |
| Week Change: 2.05% Year-to-date Change: -14.0% | |
| GBTG Links: Profile News Message Board | |
| Charts:- Daily , Weekly | |
| Add GBTG to Watchlist: View: Get Complete GBTG Trend Analysis ➞ | |
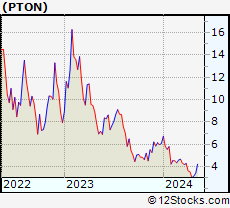 | PTON Peloton Interactive Inc |
| Sector: Services & Goods | |
| SubSector: Leisure | |
| MarketCap: 3270.26 Millions | |
| Recent Price: 7.58 Smart Investing & Trading Score: 30 | |
| Day Percent Change: -0.915033% Day Change: -0.04 | |
| Week Change: -6.65025% Year-to-date Change: -14.2% | |
| PTON Links: Profile News Message Board | |
| Charts:- Daily , Weekly | |
| Add PTON to Watchlist: View: Get Complete PTON Trend Analysis ➞ | |
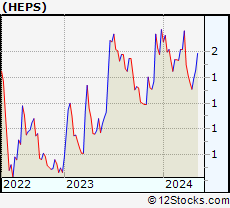 | HEPS D-MARKET Electronic Services & Trading ADR |
| Sector: Services & Goods | |
| SubSector: Internet Retail | |
| MarketCap: 903.08 Millions | |
| Recent Price: 2.71 Smart Investing & Trading Score: 20 | |
| Day Percent Change: 0.743494% Day Change: 0.05 | |
| Week Change: -2.86738% Year-to-date Change: -14.2% | |
| HEPS Links: Profile News Message Board | |
| Charts:- Daily , Weekly | |
| Add HEPS to Watchlist: View: Get Complete HEPS Trend Analysis ➞ | |
 | PSNY Polestar Automotive Holding UK PLC ADR |
| Sector: Services & Goods | |
| SubSector: Auto Manufacturers | |
| MarketCap: 2081.06 Millions | |
| Recent Price: 0.94 Smart Investing & Trading Score: 0 | |
| Day Percent Change: -2.74255% Day Change: 0.01 | |
| Week Change: -9.29808% Year-to-date Change: -14.2% | |
| PSNY Links: Profile News Message Board | |
| Charts:- Daily , Weekly | |
| Add PSNY to Watchlist: View: Get Complete PSNY Trend Analysis ➞ | |
| For tabular summary view of above stock list: Summary View ➞ 0 - 25 , 25 - 50 , 50 - 75 , 75 - 100 , 100 - 125 , 125 - 150 , 150 - 175 , 175 - 200 , 200 - 225 , 225 - 250 , 250 - 275 , 275 - 300 , 300 - 325 , 325 - 350 , 350 - 375 , 375 - 400 , 400 - 425 , 425 - 450 , 450 - 475 , 475 - 500 , 500 - 525 , 525 - 550 , 550 - 575 , 575 - 600 , 600 - 625 | ||
| Click To Change The Sort Order: By Market Cap or Company Size Performance: Year-to-date, Week and Day | |
| Select Chart Type: | ||
|
Best Stocks Today 12Stocks.com |
© 2025 12Stocks.com Terms & Conditions Privacy Contact Us
All Information Provided Only For Education And Not To Be Used For Investing or Trading. See Terms & Conditions


One More Thing ... Get Best Stocks Delivered Daily!
Never Ever Miss A Move With Our Top Ten Stocks Lists
Find Best Stocks In Any Market - Bull or Bear Market
Take A Peek At Our Top Ten Stocks Lists: Daily, Weekly, Year-to-Date & Top Trends
Find Best Stocks In Any Market - Bull or Bear Market
Take A Peek At Our Top Ten Stocks Lists: Daily, Weekly, Year-to-Date & Top Trends
Consumer Services Stocks With Best Up Trends [0-bearish to 100-bullish]: QuantumScape Corp[100], Whole Foods[100], Net 1[100], Tesla [100], Baozun [100], Resources Connection[100], KapStone Paper[100], China Yuchai[100], Marine Products[100], Express [100], Madison Square[100]
Best Consumer Services Stocks Year-to-Date:
WW [2086.01%], Nova Lifestyle[681.129%], ThredUp [637.943%], Lucid [536.139%], Vroom [455.146%], China Yuchai[295.103%], Luxottica [210.802%], Cooper-Standard [181.832%], Jumia Technologies[154.103%], Viomi Technology[138.127%], Niu Technologies[132.759%] Best Consumer Services Stocks This Week:
Party City[37593.9%], Companhia Brasileira[18587.4%], Conn s[16420.1%], Rite Aid[10214.6%], Arctic Cat[2387.5%], Chico s[2120.53%], Multi-Color [2063.68%], Reis [1734.59%], Quotient Technology[954.386%], Express [946.725%], Volt Information[705.085%] Best Consumer Services Stocks Daily:
Container Store[22.6852%], SUPERVALU [20.4138%], World Wrestling[14.734%], Global Sources[13.1016%], QuantumScape Corp[12.4294%], Whole Foods[11.8363%], iClick Interactive[10%], Net 1[9.46197%], Six Flags[7.76654%], SES AI[7.75862%], Tesla [7.37507%]