
 Login Sign Up


| |||||
 |  | ||||

| 12Stocks.com Market Intelligence |
Best Consumer Services Stocks
| In a hurry? Services & Goods Stocks: Performance Trends Table, Stock Charts
Sort Consumer Services: Daily, Weekly, Year-to-Date, Market Cap & Trends. Filter Services & Goods stocks list by size: All Large Mid-Range Small |
| 12Stocks.com Consumer Services Stocks Performances & Trends Daily | |||||||||
|
|  The overall Smart Investing & Trading Score is 100 (0-bearish to 100-bullish) which puts Consumer Services sector in short term bullish trend. The Smart Investing & Trading Score from previous trading session is 100 and an improvement of trend continues.
| ||||||||
Here are the Smart Investing & Trading Scores of the most requested Consumer Services stocks at 12Stocks.com (click stock name for detailed review):
|


| Consider signing up for our daily 12Stocks.com "Best Stocks Newsletter". You will never ever miss a big stock move again! |
| 12Stocks.com: Investing in Consumer Services sector with Stocks | |
|
The following table helps investors and traders sort through current performance and trends (as measured by Smart Investing & Trading Score) of various
stocks in the Consumer Services sector. Quick View: Move mouse or cursor over stock symbol (ticker) to view short-term Technical chart and over stock name to view long term chart. Click on  to add stock symbol to your watchlist and to add stock symbol to your watchlist and  to view watchlist. Click on any ticker or stock name for detailed market intelligence report for that stock. to view watchlist. Click on any ticker or stock name for detailed market intelligence report for that stock. |
12Stocks.com Performance of Stocks in Consumer Services Sector
| Ticker | Stock Name | Watchlist | Category | Recent Price | Smart Investing & Trading Score | Change % | YTD Change% |
| HSII | Heidrick & Struggles |   | Staffing | 47.67 | 60 | 32.48 | 12.67% |
| PLNT | Planet Fitness | | Sporting | 107.52 | 60 | 31.91 | 8.42% |
| GHC | Graham | | Education | 1065.09 | 100 | 30.97 | 22.49% |
| STRA | Strategic Education | | Education | 78.34 | 20 | 29.85 | -14.50% |
| MCK | McKesson | | Pharmacy | 673.05 | 40 | 29.09 | 16.61% |
| H | Hyatt Hotels | | Lodging | 141.13 | 40 | 28.81 | -7.27% |
| EDU | New Oriental | | Education | 48.40 | 80 | 28.05 | -27.10% |
| OSW | OneSpaWorld | | Casinos | 21.84 | 30 | 27.65 | 12.56% |
| BAH | Booz Allen | | Services | 109.32 | 50 | 27.03 | -12.38% |
| LOCO | El Pollo | | Restaurants | 10.42 | 50 | 26.70 | -7.37% |
| TRU | TransUnion | | Services | 88.89 | 20 | 25.02 | 0.33% |
| CIX | CompX | | Security | 31.60 | 80 | 24.36 | 23.60% |
| ROL | Rollins | | Services | 57.33 | 20 | 23.96 | 26.52% |
| LQDT | Liquidity Services | | Retail | 25.40 | 60 | 22.37 | -19.02% |
| ORLY | O Reilly | | Auto Parts | 101.54 | 50 | 20.16 | 29.84% |
| FAST | Fastenal | | Equipment | 48.88 | 100 | 20.11 | 39.05% |
| ASGN | ASGN | | Staffing | 51.77 | 50 | 19.88 | -37.49% |
| ADT | ADT | | Security | 8.68 | 90 | 18.70 | 28.86% |
| CAVA | CAVA | | Restaurants | 69.90 | 64 | 18.12 | -37.54% |
| GOLF | Acushnet | | Retail | 78.19 | 40 | 16.72 | 13.28% |
| ACM | AECOM | | Services | 119.57 | 60 | 14.94 | 15.09% |
| INSW | Seaways | | Services | 41.64 | 50 | 14.41 | 22.21% |
| CHDN | Churchill Downs | | Gaming | 102.58 | 50 | 13.76 | -22.44% |
| BATRK | Liberty Braves | | Broadcasting | 43.93 | 20 | 13.73 | 16.52% |
| CASS | Cass Information | | Services | 42.66 | 90 | 13.10 | 6.06% |
| For chart view version of above stock list: Chart View ➞ 0 - 25 , 25 - 50 , 50 - 75 , 75 - 100 , 100 - 125 , 125 - 150 , 150 - 175 , 175 - 200 , 200 - 225 , 225 - 250 , 250 - 275 , 275 - 300 , 300 - 325 , 325 - 350 , 350 - 375 , 375 - 400 , 400 - 425 | ||
 | Click To Change The Sort Order: By Market Cap or Company Size Performance: Year-to-date, Week and Day |  |
|
Get the most comprehensive stock market coverage daily at 12Stocks.com ➞ Best Stocks Today ➞ Best Stocks Weekly ➞ Best Stocks Year-to-Date ➞ Best Stocks Trends ➞  Best Stocks Today 12Stocks.com Best Nasdaq Stocks ➞ Best S&P 500 Stocks ➞ Best Tech Stocks ➞ Best Biotech Stocks ➞ |
| Detailed Overview of Consumer Services Stocks |
| Consumer Services Technical Overview, Leaders & Laggards, Top Consumer Services ETF Funds & Detailed Consumer Services Stocks List, Charts, Trends & More |
| Consumer Services Sector: Technical Analysis, Trends & YTD Performance | |
| Consumer Services sector is composed of stocks
from retail, entertainment, media/publishing, consumer goods
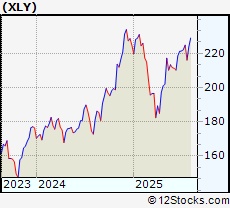
and services subsectors. Consumer Services sector, as represented by XLY, an exchange-traded fund [ETF] that holds basket of Consumer Services stocks (e.g, Walmart, Alibaba) is up by 2.95% and is currently underperforming the overall market by -7.38% year-to-date. Below is a quick view of Technical charts and trends: |
|
 XLY Weekly Chart |
|
| Long Term Trend: Very Good | |
| Medium Term Trend: Very Good | |
 XLY Daily Chart |
|
| Short Term Trend: Very Good | |
| Overall Trend Score: 100 | |
| YTD Performance: 2.95% | |
| **Trend Scores & Views Are Only For Educational Purposes And Not For Investing | |
| 12Stocks.com: Top Performing Consumer Services Sector Stocks | ||||||||||||||||||||||||||||||||||||||||||||||
 The top performing Consumer Services sector stocks year to date are
Now, more recently, over last week, the top performing Consumer Services sector stocks on the move are


|
||||||||||||||||||||||||||||||||||||||||||||||
| 12Stocks.com: Investing in Consumer Services Sector using Exchange Traded Funds | |
|
The following table shows list of key exchange traded funds (ETF) that
help investors track Consumer Services Index. For detailed view, check out our ETF Funds section of our website. Quick View: Move mouse or cursor over ETF symbol (ticker) to view short-term Technical chart and over ETF name to view long term chart. Click on ticker or stock name for detailed view. Click on to add stock symbol to your watchlist and to view watchlist. |
12Stocks.com List of ETFs that track Consumer Services Index
| Ticker | ETF Name | Watchlist | Recent Price | Smart Investing & Trading Score | Change % | Week % | Year-to-date % |
| XLY | Consumer Discret Sel | | 229.04 | 100 | 2.01 | 2.86 | 2.95% |
| RTH | Retail | | 247.72 | 100 | 0.63 | 0.8 | 10.46% |
| IYC | Consumer Services | | 102.72 | 100 | 1.68 | 2.04 | 7.35% |
| XRT | Retail | | 83.59 | 100 | 2.54 | 4.47 | 7.4% |
| IYK | Consumer Goods | | 70.21 | 40 | 0.37 | 1.49 | 8.38% |
| UCC | Consumer Services | | 49.53 | 100 | 2.96 | 5.78 | -2.73% |
| RETL | Retail Bull 3X | | 9.42 | 100 | 26.94 | 13.16 | 0.86% |
| RXI | Globl Consumer Discretionary | | 196.05 | 100 | 0.53 | 3.13 | 7.68% |
| SCC | Short Consumer Services | | 16.04 | 0 | -19.86 | -5.49 | -12.44% |
| UGE | Consumer Goods | | 18.79 | 20 | 1.05 | 2.4 | 7.27% |
| 12Stocks.com: Charts, Trends, Fundamental Data and Performances of Consumer Services Stocks | |
|
We now take in-depth look at all Consumer Services stocks including charts, multi-period performances and overall trends (as measured by Smart Investing & Trading Score). One can sort Consumer Services stocks (click link to choose) by Daily, Weekly and by Year-to-Date performances. Also, one can sort by size of the company or by market capitalization. |
| Select Your Default Chart Type: | |||||
| |||||
| Click on stock symbol or name for detailed view. Click on to add stock symbol to your watchlist and to view watchlist. Quick View: Move mouse or cursor over "Daily" to quickly view daily Technical stock chart and over "Weekly" to view weekly Technical stock chart. | |||||

 | HSII Heidrick & Struggles International, Inc. |
| Sector: Services & Goods | |
| SubSector: Staffing & Outsourcing Services | |
| MarketCap: 431.428 Millions | |
| Recent Price: 47.67 Smart Investing & Trading Score: 60 | |
| Day Percent Change: 32.48% Day Change: 9.15 | |
| Week Change: 8.47% Year-to-date Change: 12.7% | |
| HSII Links: Profile News Message Board | |
| Charts:- Daily , Weekly | |
| Add HSII to Watchlist: View: Get Complete HSII Trend Analysis ➞ | |
 | PLNT Planet Fitness, Inc. |
| Sector: Services & Goods | |
| SubSector: Sporting Activities | |
| MarketCap: 3485.94 Millions | |
| Recent Price: 107.52 Smart Investing & Trading Score: 60 | |
| Day Percent Change: 31.91% Day Change: 19.61 | |
| Week Change: 1.01% Year-to-date Change: 8.4% | |
| PLNT Links: Profile News Message Board | |
| Charts:- Daily , Weekly | |
| Add PLNT to Watchlist: View: Get Complete PLNT Trend Analysis ➞ | |
 | GHC Graham Holdings Company |
| Sector: Services & Goods | |
| SubSector: Education & Training Services | |
| MarketCap: 1871.06 Millions | |
| Recent Price: 1065.09 Smart Investing & Trading Score: 100 | |
| Day Percent Change: 30.97% Day Change: 186.78 | |
| Week Change: 9.92% Year-to-date Change: 22.5% | |
| GHC Links: Profile News Message Board | |
| Charts:- Daily , Weekly | |
| Add GHC to Watchlist: View: Get Complete GHC Trend Analysis ➞ | |
 | STRA Strategic Education, Inc. |
| Sector: Services & Goods | |
| SubSector: Education & Training Services | |
| MarketCap: 2621.56 Millions | |
| Recent Price: 78.34 Smart Investing & Trading Score: 20 | |
| Day Percent Change: 29.85% Day Change: 22.39 | |
| Week Change: 0.85% Year-to-date Change: -14.5% | |
| STRA Links: Profile News Message Board | |
| Charts:- Daily , Weekly | |
| Add STRA to Watchlist: View: Get Complete STRA Trend Analysis ➞ | |
 | MCK McKesson Corporation |
| Sector: Services & Goods | |
| SubSector: Drugs Wholesale | |
| MarketCap: 24096.7 Millions | |
| Recent Price: 673.05 Smart Investing & Trading Score: 40 | |
| Day Percent Change: 29.09% Day Change: 124.42 | |
| Week Change: -5.77% Year-to-date Change: 16.6% | |
| MCK Links: Profile News Message Board | |
| Charts:- Daily , Weekly | |
| Add MCK to Watchlist: View: Get Complete MCK Trend Analysis ➞ | |
 | H Hyatt Hotels Corporation |
| Sector: Services & Goods | |
| SubSector: Lodging | |
| MarketCap: 5525.56 Millions | |
| Recent Price: 141.13 Smart Investing & Trading Score: 40 | |
| Day Percent Change: 28.81% Day Change: 33.27 | |
| Week Change: 6.75% Year-to-date Change: -7.3% | |
| H Links: Profile News Message Board | |
| Charts:- Daily , Weekly | |
| Add H to Watchlist: View: Get Complete H Trend Analysis ➞ | |
 | EDU New Oriental Education & Technology Group Inc. |
| Sector: Services & Goods | |
| SubSector: Education & Training Services | |
| MarketCap: 18673.7 Millions | |
| Recent Price: 48.40 Smart Investing & Trading Score: 80 | |
| Day Percent Change: 28.05% Day Change: 14.74 | |
| Week Change: 1.28% Year-to-date Change: -27.1% | |
| EDU Links: Profile News Message Board | |
| Charts:- Daily , Weekly | |
| Add EDU to Watchlist: View: Get Complete EDU Trend Analysis ➞ | |
 | OSW OneSpaWorld Holdings Limited |
| Sector: Services & Goods | |
| SubSector: Resorts & Casinos | |
| MarketCap: 228.394 Millions | |
| Recent Price: 21.84 Smart Investing & Trading Score: 30 | |
| Day Percent Change: 27.65% Day Change: 3.34 | |
| Week Change: -0.89% Year-to-date Change: 12.6% | |
| OSW Links: Profile News Message Board | |
| Charts:- Daily , Weekly | |
| Add OSW to Watchlist: View: Get Complete OSW Trend Analysis ➞ | |
 | BAH Booz Allen Hamilton Holding Corporation |
| Sector: Services & Goods | |
| SubSector: Management Services | |
| MarketCap: 9037.35 Millions | |
| Recent Price: 109.32 Smart Investing & Trading Score: 50 | |
| Day Percent Change: 27.03% Day Change: 32.97 | |
| Week Change: -0.21% Year-to-date Change: -12.4% | |
| BAH Links: Profile News Message Board | |
| Charts:- Daily , Weekly | |
| Add BAH to Watchlist: View: Get Complete BAH Trend Analysis ➞ | |
 | LOCO El Pollo Loco Holdings, Inc. |
| Sector: Services & Goods | |
| SubSector: Restaurants | |
| MarketCap: 296.97 Millions | |
| Recent Price: 10.42 Smart Investing & Trading Score: 50 | |
| Day Percent Change: 26.7% Day Change: 2.87 | |
| Week Change: 4.39% Year-to-date Change: -7.4% | |
| LOCO Links: Profile News Message Board | |
| Charts:- Daily , Weekly | |
| Add LOCO to Watchlist: View: Get Complete LOCO Trend Analysis ➞ | |
 | TRU TransUnion |
| Sector: Services & Goods | |
| SubSector: Business Services | |
| MarketCap: 11457.2 Millions | |
| Recent Price: 88.89 Smart Investing & Trading Score: 20 | |
| Day Percent Change: 25.02% Day Change: 19.47 | |
| Week Change: 2.06% Year-to-date Change: 0.3% | |
| TRU Links: Profile News Message Board | |
| Charts:- Daily , Weekly | |
| Add TRU to Watchlist: View: Get Complete TRU Trend Analysis ➞ | |
 | CIX CompX International Inc. |
| Sector: Services & Goods | |
| SubSector: Security & Protection Services | |
| MarketCap: 189.603 Millions | |
| Recent Price: 31.60 Smart Investing & Trading Score: 80 | |
| Day Percent Change: 24.36% Day Change: 5.37 | |
| Week Change: 18.12% Year-to-date Change: 23.6% | |
| CIX Links: Profile News Message Board | |
| Charts:- Daily , Weekly | |
| Add CIX to Watchlist: View: Get Complete CIX Trend Analysis ➞ | |
 | ROL Rollins, Inc. |
| Sector: Services & Goods | |
| SubSector: Business Services | |
| MarketCap: 12827.4 Millions | |
| Recent Price: 57.33 Smart Investing & Trading Score: 20 | |
| Day Percent Change: 23.96% Day Change: 9.69 | |
| Week Change: -0.08% Year-to-date Change: 26.5% | |
| ROL Links: Profile News Message Board | |
| Charts:- Daily , Weekly | |
| Add ROL to Watchlist: View: Get Complete ROL Trend Analysis ➞ | |
 | LQDT Liquidity Services, Inc. |
| Sector: Services & Goods | |
| SubSector: Catalog & Mail Order Houses | |
| MarketCap: 144.492 Millions | |
| Recent Price: 25.40 Smart Investing & Trading Score: 60 | |
| Day Percent Change: 22.37% Day Change: 4.1 | |
| Week Change: 5.23% Year-to-date Change: -19.0% | |
| LQDT Links: Profile News Message Board | |
| Charts:- Daily , Weekly | |
| Add LQDT to Watchlist: View: Get Complete LQDT Trend Analysis ➞ | |
 | ORLY O Reilly Automotive, Inc. |
| Sector: Services & Goods | |
| SubSector: Auto Parts Stores | |
| MarketCap: 22391.5 Millions | |
| Recent Price: 101.54 Smart Investing & Trading Score: 50 | |
| Day Percent Change: 20.16% Day Change: 187.37 | |
| Week Change: -1.72% Year-to-date Change: 29.8% | |
| ORLY Links: Profile News Message Board | |
| Charts:- Daily , Weekly | |
| Add ORLY to Watchlist: View: Get Complete ORLY Trend Analysis ➞ | |
 | FAST Fastenal Company |
| Sector: Services & Goods | |
| SubSector: Industrial Equipment Wholesale | |
| MarketCap: 17609.9 Millions | |
| Recent Price: 48.88 Smart Investing & Trading Score: 100 | |
| Day Percent Change: 20.11% Day Change: 11.4 | |
| Week Change: 5.19% Year-to-date Change: 39.1% | |
| FAST Links: Profile News Message Board | |
| Charts:- Daily , Weekly | |
| Add FAST to Watchlist: View: Get Complete FAST Trend Analysis ➞ | |
 | ASGN ASGN Incorporated |
| Sector: Services & Goods | |
| SubSector: Staffing & Outsourcing Services | |
| MarketCap: 2035.88 Millions | |
| Recent Price: 51.77 Smart Investing & Trading Score: 50 | |
| Day Percent Change: 19.88% Day Change: 15.94 | |
| Week Change: 3.11% Year-to-date Change: -37.5% | |
| ASGN Links: Profile News Message Board | |
| Charts:- Daily , Weekly | |
| Add ASGN to Watchlist: View: Get Complete ASGN Trend Analysis ➞ | |
 | ADT ADT Inc. |
| Sector: Services & Goods | |
| SubSector: Security & Protection Services | |
| MarketCap: 2892.03 Millions | |
| Recent Price: 8.68 Smart Investing & Trading Score: 90 | |
| Day Percent Change: 18.7% Day Change: 1.18 | |
| Week Change: 2.33% Year-to-date Change: 28.9% | |
| ADT Links: Profile News Message Board | |
| Charts:- Daily , Weekly | |
| Add ADT to Watchlist: View: Get Complete ADT Trend Analysis ➞ | |
 | CAVA CAVA Group, Inc. |
| Sector: Services & Goods | |
| SubSector: Restaurants | |
| MarketCap: 4510 Millions | |
| Recent Price: 69.90 Smart Investing & Trading Score: 64 | |
| Day Percent Change: 18.12% Day Change: 18.72 | |
| Week Change: -18.23% Year-to-date Change: -37.5% | |
| CAVA Links: Profile News Message Board | |
| Charts:- Daily , Weekly | |
| Add CAVA to Watchlist: View: Get Complete CAVA Trend Analysis ➞ | |
 | GOLF Acushnet Holdings Corp. |
| Sector: Services & Goods | |
| SubSector: Sporting Goods Stores | |
| MarketCap: 1717.74 Millions | |
| Recent Price: 78.19 Smart Investing & Trading Score: 40 | |
| Day Percent Change: 16.72% Day Change: 9.6 | |
| Week Change: 0.35% Year-to-date Change: 13.3% | |
| GOLF Links: Profile News Message Board | |
| Charts:- Daily , Weekly | |
| Add GOLF to Watchlist: View: Get Complete GOLF Trend Analysis ➞ | |
 | ACM AECOM |
| Sector: Services & Goods | |
| SubSector: Technical Services | |
| MarketCap: 4781.9 Millions | |
| Recent Price: 119.57 Smart Investing & Trading Score: 60 | |
| Day Percent Change: 14.94% Day Change: 12.76 | |
| Week Change: 2.68% Year-to-date Change: 15.1% | |
| ACM Links: Profile News Message Board | |
| Charts:- Daily , Weekly | |
| Add ACM to Watchlist: View: Get Complete ACM Trend Analysis ➞ | |
 | INSW International Seaways, Inc. |
| Sector: Services & Goods | |
| SubSector: Business Services | |
| MarketCap: 521.582 Millions | |
| Recent Price: 41.64 Smart Investing & Trading Score: 50 | |
| Day Percent Change: 14.41% Day Change: 6.41 | |
| Week Change: -3.18% Year-to-date Change: 22.2% | |
| INSW Links: Profile News Message Board | |
| Charts:- Daily , Weekly | |
| Add INSW to Watchlist: View: Get Complete INSW Trend Analysis ➞ | |
 | CHDN Churchill Downs Incorporated |
| Sector: Services & Goods | |
| SubSector: Gaming Activities | |
| MarketCap: 3693.29 Millions | |
| Recent Price: 102.58 Smart Investing & Trading Score: 50 | |
| Day Percent Change: 13.76% Day Change: 16.72 | |
| Week Change: 1.23% Year-to-date Change: -22.4% | |
| CHDN Links: Profile News Message Board | |
| Charts:- Daily , Weekly | |
| Add CHDN to Watchlist: View: Get Complete CHDN Trend Analysis ➞ | |
 | BATRK The Liberty Braves Group |
| Sector: Services & Goods | |
| SubSector: Broadcasting - TV | |
| MarketCap: 638.363 Millions | |
| Recent Price: 43.93 Smart Investing & Trading Score: 20 | |
| Day Percent Change: 13.73% Day Change: 5.28 | |
| Week Change: -0.69% Year-to-date Change: 16.5% | |
| BATRK Links: Profile News Message Board | |
| Charts:- Daily , Weekly | |
| Add BATRK to Watchlist: View: Get Complete BATRK Trend Analysis ➞ | |
 | CASS Cass Information Systems, Inc. |
| Sector: Services & Goods | |
| SubSector: Business Services | |
| MarketCap: 477.382 Millions | |
| Recent Price: 42.66 Smart Investing & Trading Score: 90 | |
| Day Percent Change: 13.1% Day Change: 5.01 | |
| Week Change: 2.25% Year-to-date Change: 6.1% | |
| CASS Links: Profile News Message Board | |
| Charts:- Daily , Weekly | |
| Add CASS to Watchlist: View: Get Complete CASS Trend Analysis ➞ | |
| For tabular summary view of above stock list: Summary View ➞ 0 - 25 , 25 - 50 , 50 - 75 , 75 - 100 , 100 - 125 , 125 - 150 , 150 - 175 , 175 - 200 , 200 - 225 , 225 - 250 , 250 - 275 , 275 - 300 , 300 - 325 , 325 - 350 , 350 - 375 , 375 - 400 , 400 - 425 | ||
| Click To Change The Sort Order: By Market Cap or Company Size Performance: Year-to-date, Week and Day | |
| Select Chart Type: | ||
|
Best Stocks Today 12Stocks.com |
© 2025 12Stocks.com Terms & Conditions Privacy Contact Us
All Information Provided Only For Education And Not To Be Used For Investing or Trading. See Terms & Conditions


One More Thing ... Get Best Stocks Delivered Daily!
Never Ever Miss A Move With Our Top Ten Stocks Lists
Find Best Stocks In Any Market - Bull or Bear Market
Take A Peek At Our Top Ten Stocks Lists: Daily, Weekly, Year-to-Date & Top Trends
Find Best Stocks In Any Market - Bull or Bear Market
Take A Peek At Our Top Ten Stocks Lists: Daily, Weekly, Year-to-Date & Top Trends
Consumer Services Stocks With Best Up Trends [0-bearish to 100-bullish]: Louisiana-Pacific [100], eBay [100], Graham [100], Fastenal [100], Wayfair [100], Gaia [100], Gray Television[100], Haverty Furniture[100], RealReal [100], Resideo Technologies[100], Holley [100]
Best Consumer Services Stocks Year-to-Date:
MedEquities Realty[294856%], WW [2516.54%], ThredUp [656.12%], Willdan [210.66%], Kratos Defense[160.61%], IHS Holding[134.93%], Yatsen Holding[133.67%], National Vision[122.84%], Roblox [119.12%], Altisource Portfolio[97.94%], Jumia Technologies[95.29%] Best Consumer Services Stocks This Week:
MedEquities Realty[411381%], Jumia Technologies[62.88%], Money[56.67%], Brilliant Earth[44.93%], Holley [35.82%], RealReal [35.65%], Willdan [34.44%], ATRenew [33.14%], Gray Television[33.03%], Arhaus [28.98%], Park-Ohio [27.27%] Best Consumer Services Stocks Daily:
CareDx [185.69%], Wingstop [150.46%], Spotify Technology[147.52%], National CineMedia[112.46%], VSE [69.41%], Burlington Stores[66.03%], Myriad Genetics[64.88%], Costco Wholesale[58.1%], Daily Journal[57.5%], Texas Roadhouse[55.27%], Royal Caribbean[53.63%]