
 Login Sign Up


| |||||
 |  | ||||

| 12Stocks.com Market Intelligence |
Best Consumer Services Stocks
| In a hurry? Services & Goods Stocks: Performance Trends Table, Stock Charts
Sort Consumer Services: Daily, Weekly, Year-to-Date, Market Cap & Trends. Filter Services & Goods stocks list by size: All Large Mid-Range Small |
| 12Stocks.com Consumer Services Stocks Performances & Trends Daily | |||||||||
|
|  The overall Smart Investing & Trading Score is 90 (0-bearish to 100-bullish) which puts Consumer Services sector in short term bullish trend. The Smart Investing & Trading Score from previous trading session is 50 and hence an improvement of trend.
| ||||||||
Here are the Smart Investing & Trading Scores of the most requested Consumer Services stocks at 12Stocks.com (click stock name for detailed review):
|


| Consider signing up for our daily 12Stocks.com "Best Stocks Newsletter". You will never ever miss a big stock move again! |
| 12Stocks.com: Investing in Consumer Services sector with Stocks | |
|
The following table helps investors and traders sort through current performance and trends (as measured by Smart Investing & Trading Score) of various
stocks in the Consumer Services sector. Quick View: Move mouse or cursor over stock symbol (ticker) to view short-term Technical chart and over stock name to view long term chart. Click on  to add stock symbol to your watchlist and to add stock symbol to your watchlist and  to view watchlist. Click on any ticker or stock name for detailed market intelligence report for that stock. to view watchlist. Click on any ticker or stock name for detailed market intelligence report for that stock. |
12Stocks.com Performance of Stocks in Consumer Services Sector
| Ticker | Stock Name | Watchlist | Category | Recent Price | Smart Investing & Trading Score | Change % | YTD Change% |
| DLTH | Duluth |   | Apparel | 2.27 | 40 | 9.19% | -26.54% |
| DFH | Dream Finders | | Residential Construction | 25.97 | 40 | 8.21% | 11.60% |
| SSTK | Shutterstock | | Services | 20.23 | 40 | 5.24% | -31.02% |
| LE | Lands | | Retail | 13.11 | 40 | 4.88% | -0.23% |
| KMX | CarMax | | Automobile | 56.66 | 40 | 4.72% | -30.70% |
| TNET | TriNet | | Services | 64.47 | 40 | 4.08% | -28.26% |
| EAT | Brinker | | Restaurants | 154.88 | 40 | 3.60% | 17.08% |
| BJRI | BJ s | | Restaurants | 34.33 | 40 | 3.08% | -2.29% |
| LBRDK | Liberty Broadband | | Broadcasting | 59.92 | 40 | 3.02% | -14.38% |
| RHI | Robert Half | | Staffing | 34.82 | 40 | 2.92% | -49.45% |
| ANF | Abercrombie & Fitch Co | | Apparel | 101.64 | 40 | 2.60% | -32.00% |
| ACEL | Accel Entertainment | | Gaming | 11.28 | 40 | 2.59% | 5.62% |
| WMK | Weis Markets | | Grocery | 72.56 | 40 | 2.37% | 8.60% |
| EEFT | Euronet Worldwide | | Services | 94.96 | 40 | 2.30% | -7.66% |
| MCS | Marcus | | Entertainment | 15.30 | 40 | 1.81% | -28.33% |
| BKNG | Booking | | Services | 5461.54 | 40 | 1.80% | 10.34% |
| HSIC | Henry Schein | | Medical | 67.50 | 40 | 1.35% | -2.46% |
| OMC | Omnicom | | Advertising | 73.68 | 40 | 1.33% | -12.81% |
| GPN | Global Payments | | Services | 82.39 | 40 | 1.09% | -26.04% |
| KBR | KBR | | Services | 49.79 | 40 | 1.08% | -13.50% |
| CMCSA | Comcast | | Entertainment | 32.10 | 40 | 1.01% | -12.17% |
| RBLX | Roblox | | Electronic Gaming & Multimedia | 129.53 | 40 | 0.96% | 123.87% |
| CMG | Chipotle Mexican | | Restaurants | 42.83 | 40 | 0.48% | -28.97% |
| DRI | Darden Restaurants | | Restaurants | 205.13 | 40 | 0.24% | 12.31% |
| GME | GameStop | | Retail | 22.93 | 40 | 0.23% | -26.83% |
| For chart view version of above stock list: Chart View ➞ 0 - 25 , 25 - 50 , 50 - 75 , 75 - 100 , 100 - 125 , 125 - 150 , 150 - 175 , 175 - 200 , 200 - 225 , 225 - 250 , 250 - 275 , 275 - 300 , 300 - 325 , 325 - 350 , 350 - 375 | ||
 | Click To Change The Sort Order: By Market Cap or Company Size Performance: Year-to-date, Week and Day |  |
|
Get the most comprehensive stock market coverage daily at 12Stocks.com ➞ Best Stocks Today ➞ Best Stocks Weekly ➞ Best Stocks Year-to-Date ➞ Best Stocks Trends ➞  Best Stocks Today 12Stocks.com Best Nasdaq Stocks ➞ Best S&P 500 Stocks ➞ Best Tech Stocks ➞ Best Biotech Stocks ➞ |
| Detailed Overview of Consumer Services Stocks |
| Consumer Services Technical Overview, Leaders & Laggards, Top Consumer Services ETF Funds & Detailed Consumer Services Stocks List, Charts, Trends & More |
| Consumer Services Sector: Technical Analysis, Trends & YTD Performance | |
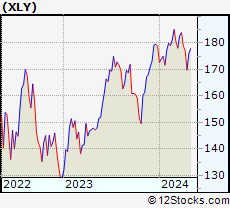
| Consumer Services sector is composed of stocks
from retail, entertainment, media/publishing, consumer goods
and services subsectors. Consumer Services sector, as represented by XLY, an exchange-traded fund [ETF] that holds basket of Consumer Services stocks (e.g, Walmart, Alibaba) is up by 1.56% and is currently underperforming the overall market by -8.24% year-to-date. Below is a quick view of Technical charts and trends: |
|
 XLY Weekly Chart |
|
| Long Term Trend: Very Good | |
| Medium Term Trend: Very Good | |
 XLY Daily Chart |
|
| Short Term Trend: Very Good | |
| Overall Trend Score: 90 | |
| YTD Performance: 1.56% | |
| **Trend Scores & Views Are Only For Educational Purposes And Not For Investing | |
| 12Stocks.com: Top Performing Consumer Services Sector Stocks | ||||||||||||||||||||||||||||||||||||||||||||||||
 The top performing Consumer Services sector stocks year to date are
Now, more recently, over last week, the top performing Consumer Services sector stocks on the move are


|
||||||||||||||||||||||||||||||||||||||||||||||||
| 12Stocks.com: Investing in Consumer Services Sector using Exchange Traded Funds | |
|
The following table shows list of key exchange traded funds (ETF) that
help investors track Consumer Services Index. For detailed view, check out our ETF Funds section of our website. Quick View: Move mouse or cursor over ETF symbol (ticker) to view short-term Technical chart and over ETF name to view long term chart. Click on ticker or stock name for detailed view. Click on to add stock symbol to your watchlist and to view watchlist. |
12Stocks.com List of ETFs that track Consumer Services Index
| Ticker | ETF Name | Watchlist | Recent Price | Smart Investing & Trading Score | Change % | Week % | Year-to-date % |
| XLY | Consumer Discret Sel | | 226.74 | 90 | 2.01 | 3.58 | 1.56% |
| RTH | Retail | | 245.88 | 90 | 0.63 | 2.04 | 9.67% |
| IYC | Consumer Services | | 101.87 | 90 | 1.68 | 2.71 | 6.29% |
| XRT | Retail | | 83.23 | 90 | 2.54 | 4.59 | 5.13% |
| IYK | Consumer Goods | | 70.15 | 40 | 0.37 | 1.9 | 8.01% |
| UCC | Consumer Services | | 48.63 | 90 | 2.96 | 7 | -5.38% |
| RETL | Retail Bull 3X | | 9.28 | 90 | 26.94 | 13.31 | -5.36% |
| SCC | Short Consumer Services | | 16.35 | 0 | -19.86 | -6.67 | -9.94% |
| UGE | Consumer Goods | | 19.12 | 50 | 1.05 | 5.18 | 6.94% |
| 12Stocks.com: Charts, Trends, Fundamental Data and Performances of Consumer Services Stocks | |
|
We now take in-depth look at all Consumer Services stocks including charts, multi-period performances and overall trends (as measured by Smart Investing & Trading Score). One can sort Consumer Services stocks (click link to choose) by Daily, Weekly and by Year-to-Date performances. Also, one can sort by size of the company or by market capitalization. |
| Select Your Default Chart Type: | |||||
| |||||
| Click on stock symbol or name for detailed view. Click on to add stock symbol to your watchlist and to view watchlist. Quick View: Move mouse or cursor over "Daily" to quickly view daily Technical stock chart and over "Weekly" to view weekly Technical stock chart. | |||||

 | DLTH Duluth Holdings Inc. |
| Sector: Services & Goods | |
| SubSector: Apparel Stores | |
| MarketCap: 180.008 Millions | |
| Recent Price: 2.27 Smart Investing & Trading Score: 40 | |
| Day Percent Change: 9.19% Day Change: 0.28 | |
| Week Change: 0.44% Year-to-date Change: -26.5% | |
| DLTH Links: Profile News Message Board | |
| Charts:- Daily , Weekly | |
| Add DLTH to Watchlist: View: Get Complete DLTH Trend Analysis ➞ | |
 | DFH Dream Finders Homes, Inc. |
| Sector: Services & Goods | |
| SubSector: Residential Construction | |
| MarketCap: 2270 Millions | |
| Recent Price: 25.97 Smart Investing & Trading Score: 40 | |
| Day Percent Change: 8.21% Day Change: 2.55 | |
| Week Change: -1.1% Year-to-date Change: 11.6% | |
| DFH Links: Profile News Message Board | |
| Charts:- Daily , Weekly | |
| Add DFH to Watchlist: View: Get Complete DFH Trend Analysis ➞ | |
 | SSTK Shutterstock, Inc. |
| Sector: Services & Goods | |
| SubSector: Business Services | |
| MarketCap: 1409.62 Millions | |
| Recent Price: 20.23 Smart Investing & Trading Score: 40 | |
| Day Percent Change: 5.24% Day Change: 1.72 | |
| Week Change: 0.45% Year-to-date Change: -31.0% | |
| SSTK Links: Profile News Message Board | |
| Charts:- Daily , Weekly | |
| Add SSTK to Watchlist: View: Get Complete SSTK Trend Analysis ➞ | |
 | LE Lands End, Inc. |
| Sector: Services & Goods | |
| SubSector: Catalog & Mail Order Houses | |
| MarketCap: 268.692 Millions | |
| Recent Price: 13.11 Smart Investing & Trading Score: 40 | |
| Day Percent Change: 4.88% Day Change: 0.72 | |
| Week Change: -0.15% Year-to-date Change: -0.2% | |
| LE Links: Profile News Message Board | |
| Charts:- Daily , Weekly | |
| Add LE to Watchlist: View: Get Complete LE Trend Analysis ➞ | |
 | KMX CarMax, Inc. |
| Sector: Services & Goods | |
| SubSector: Auto Dealerships | |
| MarketCap: 8121.71 Millions | |
| Recent Price: 56.66 Smart Investing & Trading Score: 40 | |
| Day Percent Change: 4.72% Day Change: 3.86 | |
| Week Change: 1% Year-to-date Change: -30.7% | |
| KMX Links: Profile News Message Board | |
| Charts:- Daily , Weekly | |
| Add KMX to Watchlist: View: Get Complete KMX Trend Analysis ➞ | |
 | TNET TriNet Group, Inc. |
| Sector: Services & Goods | |
| SubSector: Business Services | |
| MarketCap: 2648.72 Millions | |
| Recent Price: 64.47 Smart Investing & Trading Score: 40 | |
| Day Percent Change: 4.08% Day Change: 4.02 | |
| Week Change: 2.28% Year-to-date Change: -28.3% | |
| TNET Links: Profile News Message Board | |
| Charts:- Daily , Weekly | |
| Add TNET to Watchlist: View: Get Complete TNET Trend Analysis ➞ | |
 | EAT Brinker International, Inc. |
| Sector: Services & Goods | |
| SubSector: Restaurants | |
| MarketCap: 435.97 Millions | |
| Recent Price: 154.88 Smart Investing & Trading Score: 40 | |
| Day Percent Change: 3.6% Day Change: 2.47 | |
| Week Change: -2.39% Year-to-date Change: 17.1% | |
| EAT Links: Profile News Message Board | |
| Charts:- Daily , Weekly | |
| Add EAT to Watchlist: View: Get Complete EAT Trend Analysis ➞ | |
 | BJRI BJ s Restaurants, Inc. |
| Sector: Services & Goods | |
| SubSector: Restaurants | |
| MarketCap: 183.67 Millions | |
| Recent Price: 34.33 Smart Investing & Trading Score: 40 | |
| Day Percent Change: 3.08% Day Change: 0.98 | |
| Week Change: -0.32% Year-to-date Change: -2.3% | |
| BJRI Links: Profile News Message Board | |
| Charts:- Daily , Weekly | |
| Add BJRI to Watchlist: View: Get Complete BJRI Trend Analysis ➞ | |
 | LBRDK Liberty Broadband Corporation |
| Sector: Services & Goods | |
| SubSector: Broadcasting - TV | |
| MarketCap: 13847.3 Millions | |
| Recent Price: 59.92 Smart Investing & Trading Score: 40 | |
| Day Percent Change: 3.02% Day Change: 1.82 | |
| Week Change: -0.56% Year-to-date Change: -14.4% | |
| LBRDK Links: Profile News Message Board | |
| Charts:- Daily , Weekly | |
| Add LBRDK to Watchlist: View: Get Complete LBRDK Trend Analysis ➞ | |
 | RHI Robert Half International Inc. |
| Sector: Services & Goods | |
| SubSector: Staffing & Outsourcing Services | |
| MarketCap: 4302 Millions | |
| Recent Price: 34.82 Smart Investing & Trading Score: 40 | |
| Day Percent Change: 2.92% Day Change: 1.81 | |
| Week Change: -1.14% Year-to-date Change: -49.5% | |
| RHI Links: Profile News Message Board | |
| Charts:- Daily , Weekly | |
| Add RHI to Watchlist: View: Get Complete RHI Trend Analysis ➞ | |
 | ANF Abercrombie & Fitch Co. |
| Sector: Services & Goods | |
| SubSector: Apparel Stores | |
| MarketCap: 589.108 Millions | |
| Recent Price: 101.64 Smart Investing & Trading Score: 40 | |
| Day Percent Change: 2.6% Day Change: 4.3 | |
| Week Change: 2.27% Year-to-date Change: -32.0% | |
| ANF Links: Profile News Message Board | |
| Charts:- Daily , Weekly | |
| Add ANF to Watchlist: View: Get Complete ANF Trend Analysis ➞ | |
 | ACEL Accel Entertainment, Inc. |
| Sector: Services & Goods | |
| SubSector: Gaming Activities | |
| MarketCap: 486.589 Millions | |
| Recent Price: 11.28 Smart Investing & Trading Score: 40 | |
| Day Percent Change: 2.59% Day Change: 0.29 | |
| Week Change: -8.96% Year-to-date Change: 5.6% | |
| ACEL Links: Profile News Message Board | |
| Charts:- Daily , Weekly | |
| Add ACEL to Watchlist: View: Get Complete ACEL Trend Analysis ➞ | |
 | WMK Weis Markets, Inc. |
| Sector: Services & Goods | |
| SubSector: Grocery Stores | |
| MarketCap: 1148.75 Millions | |
| Recent Price: 72.56 Smart Investing & Trading Score: 40 | |
| Day Percent Change: 2.37% Day Change: 1.53 | |
| Week Change: 4.64% Year-to-date Change: 8.6% | |
| WMK Links: Profile News Message Board | |
| Charts:- Daily , Weekly | |
| Add WMK to Watchlist: View: Get Complete WMK Trend Analysis ➞ | |
 | EEFT Euronet Worldwide, Inc. |
| Sector: Services & Goods | |
| SubSector: Business Services | |
| MarketCap: 4809.62 Millions | |
| Recent Price: 94.96 Smart Investing & Trading Score: 40 | |
| Day Percent Change: 2.3% Day Change: 2.38 | |
| Week Change: 3.12% Year-to-date Change: -7.7% | |
| EEFT Links: Profile News Message Board | |
| Charts:- Daily , Weekly | |
| Add EEFT to Watchlist: View: Get Complete EEFT Trend Analysis ➞ | |
 | MCS The Marcus Corporation |
| Sector: Services & Goods | |
| SubSector: Entertainment - Diversified | |
| MarketCap: 441.437 Millions | |
| Recent Price: 15.30 Smart Investing & Trading Score: 40 | |
| Day Percent Change: 1.81% Day Change: 0.25 | |
| Week Change: 2.62% Year-to-date Change: -28.3% | |
| MCS Links: Profile News Message Board | |
| Charts:- Daily , Weekly | |
| Add MCS to Watchlist: View: Get Complete MCS Trend Analysis ➞ | |
 | BKNG Booking Holdings Inc. |
| Sector: Services & Goods | |
| SubSector: Business Services | |
| MarketCap: 54467.9 Millions | |
| Recent Price: 5461.54 Smart Investing & Trading Score: 40 | |
| Day Percent Change: 1.8% Day Change: 67.91 | |
| Week Change: 0.07% Year-to-date Change: 10.3% | |
| BKNG Links: Profile News Message Board | |
| Charts:- Daily , Weekly | |
| Add BKNG to Watchlist: View: Get Complete BKNG Trend Analysis ➞ | |
 | HSIC Henry Schein, Inc. |
| Sector: Services & Goods | |
| SubSector: Medical Equipment Wholesale | |
| MarketCap: 6760.9 Millions | |
| Recent Price: 67.50 Smart Investing & Trading Score: 40 | |
| Day Percent Change: 1.35% Day Change: 0.94 | |
| Week Change: 4.12% Year-to-date Change: -2.5% | |
| HSIC Links: Profile News Message Board | |
| Charts:- Daily , Weekly | |
| Add HSIC to Watchlist: View: Get Complete HSIC Trend Analysis ➞ | |
 | OMC Omnicom Group Inc. |
| Sector: Services & Goods | |
| SubSector: Advertising Agencies | |
| MarketCap: 11813.5 Millions | |
| Recent Price: 73.68 Smart Investing & Trading Score: 40 | |
| Day Percent Change: 1.33% Day Change: 1.29 | |
| Week Change: 1.47% Year-to-date Change: -12.8% | |
| OMC Links: Profile News Message Board | |
| Charts:- Daily , Weekly | |
| Add OMC to Watchlist: View: Get Complete OMC Trend Analysis ➞ | |
 | GPN Global Payments Inc. |
| Sector: Services & Goods | |
| SubSector: Business Services | |
| MarketCap: 39068.8 Millions | |
| Recent Price: 82.39 Smart Investing & Trading Score: 40 | |
| Day Percent Change: 1.09% Day Change: 1.19 | |
| Week Change: 5.08% Year-to-date Change: -26.0% | |
| GPN Links: Profile News Message Board | |
| Charts:- Daily , Weekly | |
| Add GPN to Watchlist: View: Get Complete GPN Trend Analysis ➞ | |
 | KBR KBR, Inc. |
| Sector: Services & Goods | |
| SubSector: Technical Services | |
| MarketCap: 2526.1 Millions | |
| Recent Price: 49.79 Smart Investing & Trading Score: 40 | |
| Day Percent Change: 1.08% Day Change: 0.72 | |
| Week Change: 0.28% Year-to-date Change: -13.5% | |
| KBR Links: Profile News Message Board | |
| Charts:- Daily , Weekly | |
| Add KBR to Watchlist: View: Get Complete KBR Trend Analysis ➞ | |
 | CMCSA Comcast Corporation |
| Sector: Services & Goods | |
| SubSector: Entertainment - Diversified | |
| MarketCap: 164849 Millions | |
| Recent Price: 32.10 Smart Investing & Trading Score: 40 | |
| Day Percent Change: 1.01% Day Change: 0.4 | |
| Week Change: -1.26% Year-to-date Change: -12.2% | |
| CMCSA Links: Profile News Message Board | |
| Charts:- Daily , Weekly | |
| Add CMCSA to Watchlist: View: Get Complete CMCSA Trend Analysis ➞ | |
 | RBLX Roblox Corporation |
| Sector: Services & Goods | |
| SubSector: Electronic Gaming & Multimedia | |
| MarketCap: 25420 Millions | |
| Recent Price: 129.53 Smart Investing & Trading Score: 40 | |
| Day Percent Change: 0.96% Day Change: 0.42 | |
| Week Change: 1.9% Year-to-date Change: 123.9% | |
| RBLX Links: Profile News Message Board | |
| Charts:- Daily , Weekly | |
| Add RBLX to Watchlist: View: Get Complete RBLX Trend Analysis ➞ | |
 | CMG Chipotle Mexican Grill, Inc. |
| Sector: Services & Goods | |
| SubSector: Restaurants | |
| MarketCap: 16849.9 Millions | |
| Recent Price: 42.83 Smart Investing & Trading Score: 40 | |
| Day Percent Change: 0.48% Day Change: 0.26 | |
| Week Change: 0.47% Year-to-date Change: -29.0% | |
| CMG Links: Profile News Message Board | |
| Charts:- Daily , Weekly | |
| Add CMG to Watchlist: View: Get Complete CMG Trend Analysis ➞ | |
 | DRI Darden Restaurants, Inc. |
| Sector: Services & Goods | |
| SubSector: Restaurants | |
| MarketCap: 5623.1 Millions | |
| Recent Price: 205.13 Smart Investing & Trading Score: 40 | |
| Day Percent Change: 0.24% Day Change: 0.37 | |
| Week Change: 0.44% Year-to-date Change: 12.3% | |
| DRI Links: Profile News Message Board | |
| Charts:- Daily , Weekly | |
| Add DRI to Watchlist: View: Get Complete DRI Trend Analysis ➞ | |
 | GME GameStop Corp. |
| Sector: Services & Goods | |
| SubSector: Electronics Stores | |
| MarketCap: 257.8 Millions | |
| Recent Price: 22.93 Smart Investing & Trading Score: 40 | |
| Day Percent Change: 0.23% Day Change: 0.05 | |
| Week Change: 0.53% Year-to-date Change: -26.8% | |
| GME Links: Profile News Message Board | |
| Charts:- Daily , Weekly | |
| Add GME to Watchlist: View: Get Complete GME Trend Analysis ➞ | |
| For tabular summary view of above stock list: Summary View ➞ 0 - 25 , 25 - 50 , 50 - 75 , 75 - 100 , 100 - 125 , 125 - 150 , 150 - 175 , 175 - 200 , 200 - 225 , 225 - 250 , 250 - 275 , 275 - 300 , 300 - 325 , 325 - 350 , 350 - 375 | ||
| Click To Change The Sort Order: By Market Cap or Company Size Performance: Year-to-date, Week and Day | |
| Select Chart Type: | ||
|
Best Stocks Today 12Stocks.com |
© 2025 12Stocks.com Terms & Conditions Privacy Contact Us
All Information Provided Only For Education And Not To Be Used For Investing or Trading. See Terms & Conditions


One More Thing ... Get Best Stocks Delivered Daily!
Never Ever Miss A Move With Our Top Ten Stocks Lists
Find Best Stocks In Any Market - Bull or Bear Market
Take A Peek At Our Top Ten Stocks Lists: Daily, Weekly, Year-to-Date & Top Trends
Find Best Stocks In Any Market - Bull or Bear Market
Take A Peek At Our Top Ten Stocks Lists: Daily, Weekly, Year-to-Date & Top Trends
Consumer Services Stocks With Best Up Trends [0-bearish to 100-bullish]: VSE [100], eBay [100], Kratos Defense[100], Graham [100], CompX [100], Fastenal [100], Jacobs Engineering[100], Willdan [100], Gray Television[100], Williams-Sonoma [100], Rush Enterprises[100]
Best Consumer Services Stocks Year-to-Date:
ThredUp [640.29%], Vivid Seats[278.19%], Willdan [211.45%], Kratos Defense[162.09%], Roblox [123.87%], National Vision[120.92%], Altisource Portfolio[99.84%], Noodles & [90.05%], Gray Television[89.96%], QuantumScape [80.15%], PaySign [80.13%] Best Consumer Services Stocks This Week:
Vivid Seats[1616.67%], Holley [66.18%], Money[64.55%], Myriad Genetics[55.81%], Grocery Outlet[42.09%], RealReal [33.98%], CompX [30.87%], Willdan [30.08%], comScore [29.36%], Arhaus [27.48%], Gray Television[26.37%] Best Consumer Services Stocks Daily:
CareDx [185.69%], Wingstop [150.46%], National CineMedia[112.46%], VSE [69.41%], Burlington Stores[66.03%], Myriad Genetics[64.88%], Costco Wholesale[58.1%], Daily Journal[57.5%], Texas Roadhouse[55.27%], Royal Caribbean[53.63%], CRA [53.26%]