
 Login Sign Up


| |||||
 |  | ||||

| 12Stocks.com Market Intelligence |
Best Consumer Services Stocks
| In a hurry? Services & Goods Stocks: Performance Trends Table, Stock Charts
Sort Consumer Services: Daily, Weekly, Year-to-Date, Market Cap & Trends. Filter Services & Goods stocks list by size: All Large Mid-Range Small |
| 12Stocks.com Consumer Services Stocks Performances & Trends Daily | |||||||||
|
|  The overall Smart Investing & Trading Score is 90 (0-bearish to 100-bullish) which puts Consumer Services sector in short term bullish trend. The Smart Investing & Trading Score from previous trading session is 50 and hence an improvement of trend.
| ||||||||
Here are the Smart Investing & Trading Scores of the most requested Consumer Services stocks at 12Stocks.com (click stock name for detailed review):
|


| Consider signing up for our daily 12Stocks.com "Best Stocks Newsletter". You will never ever miss a big stock move again! |
| 12Stocks.com: Investing in Consumer Services sector with Stocks | |
|
The following table helps investors and traders sort through current performance and trends (as measured by Smart Investing & Trading Score) of various
stocks in the Consumer Services sector. Quick View: Move mouse or cursor over stock symbol (ticker) to view short-term Technical chart and over stock name to view long term chart. Click on  to add stock symbol to your watchlist and to add stock symbol to your watchlist and  to view watchlist. Click on any ticker or stock name for detailed market intelligence report for that stock. to view watchlist. Click on any ticker or stock name for detailed market intelligence report for that stock. |
12Stocks.com Performance of Stocks in Consumer Services Sector
| Ticker | Stock Name | Watchlist | Category | Recent Price | Smart Investing & Trading Score | Change % | YTD Change% |
| ODP | Office Depot |   | Retail | 19.42 | 50 | 1.94% | -14.60% |
| GAMB | Gambling.com | | Gambling | 10.62 | 50 | 1.91% | -24.57% |
| IPG | Interpublic | | Advertising | 25.27 | 50 | 1.80% | -7.44% |
| SCI | Service | | Services | 80.78 | 50 | 1.54% | 2.02% |
| MTN | Vail Resorts | | Casinos | 150.81 | 50 | 1.45% | -17.28% |
| MUSA | Murphy USA | | Retail | 390.59 | 50 | 1.21% | -21.98% |
| MAR | Marriott | | Lodging | 265.01 | 50 | 0.74% | -4.54% |
| FOX | Twenty-First Century | | Entertainment | 51.15 | 50 | 0.66% | 12.40% |
| SPGI | S&P Global | | Services | 559.06 | 50 | 0.46% | 12.67% |
| TAL | TAL Education | | Education | 11.38 | 50 | 0.35% | 13.57% |
| DG | Dollar General | | Retail | 115.19 | 50 | 0.24% | 54.89% |
| SHLD | Sears | | Department | 62.14 | 50 | 0.00% | 66.43% |
| CATO | Cato | | Apparel | 2.89 | 50 | 0.00% | -25.90% |
| CPNG | Coupang | | Internet Retail | 28.14 | 50 | -0.33% | 28.03% |
| LAD | Lithia Motors | | Automobile | 300.81 | 50 | -0.55% | -15.39% |
| QGEN | QIAGEN N.V | | Research | 48.97 | 50 | -1.17% | 13.72% |
| AZO | AutoZone | | Auto Parts | 4000.67 | 50 | -1.42% | 24.94% |
| HGV | Hilton Grand | | Casinos | 44.97 | 50 | -17.38% | 15.46% |
| SGHC | Super | | Gambling | 10.97 | 41 | 4.29% | 77.10% |
| CDNA | CareDx | | Research | 12.46 | 40 | 185.69% | -41.80% |
| GWW | W.W. Grainger | | Equipment | 960.70 | 40 | 37.67% | -8.26% |
| STRA | Strategic Education | | Education | 78.11 | 40 | 29.85% | -15.20% |
| LOCO | El Pollo | | Restaurants | 10.38 | 40 | 26.70% | -10.05% |
| GOLF | Acushnet | | Retail | 76.28 | 40 | 16.72% | 8.04% |
| CHDN | Churchill Downs | | Gaming | 102.15 | 40 | 13.76% | -23.51% |
| For chart view version of above stock list: Chart View ➞ 0 - 25 , 25 - 50 , 50 - 75 , 75 - 100 , 100 - 125 , 125 - 150 , 150 - 175 , 175 - 200 , 200 - 225 , 225 - 250 , 250 - 275 , 275 - 300 , 300 - 325 , 325 - 350 , 350 - 375 | ||
 | Click To Change The Sort Order: By Market Cap or Company Size Performance: Year-to-date, Week and Day |  |
|
Get the most comprehensive stock market coverage daily at 12Stocks.com ➞ Best Stocks Today ➞ Best Stocks Weekly ➞ Best Stocks Year-to-Date ➞ Best Stocks Trends ➞  Best Stocks Today 12Stocks.com Best Nasdaq Stocks ➞ Best S&P 500 Stocks ➞ Best Tech Stocks ➞ Best Biotech Stocks ➞ |
| Detailed Overview of Consumer Services Stocks |
| Consumer Services Technical Overview, Leaders & Laggards, Top Consumer Services ETF Funds & Detailed Consumer Services Stocks List, Charts, Trends & More |
| Consumer Services Sector: Technical Analysis, Trends & YTD Performance | |
| Consumer Services sector is composed of stocks
from retail, entertainment, media/publishing, consumer goods
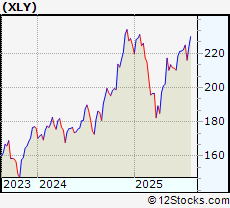
and services subsectors. Consumer Services sector, as represented by XLY, an exchange-traded fund [ETF] that holds basket of Consumer Services stocks (e.g, Walmart, Alibaba) is up by 1.56% and is currently underperforming the overall market by -8.24% year-to-date. Below is a quick view of Technical charts and trends: |
|
 XLY Weekly Chart |
|
| Long Term Trend: Very Good | |
| Medium Term Trend: Very Good | |
 XLY Daily Chart |
|
| Short Term Trend: Very Good | |
| Overall Trend Score: 90 | |
| YTD Performance: 1.56% | |
| **Trend Scores & Views Are Only For Educational Purposes And Not For Investing | |
| 12Stocks.com: Top Performing Consumer Services Sector Stocks | ||||||||||||||||||||||||||||||||||||||||||||||||
 The top performing Consumer Services sector stocks year to date are
Now, more recently, over last week, the top performing Consumer Services sector stocks on the move are


|
||||||||||||||||||||||||||||||||||||||||||||||||
| 12Stocks.com: Investing in Consumer Services Sector using Exchange Traded Funds | |
|
The following table shows list of key exchange traded funds (ETF) that
help investors track Consumer Services Index. For detailed view, check out our ETF Funds section of our website. Quick View: Move mouse or cursor over ETF symbol (ticker) to view short-term Technical chart and over ETF name to view long term chart. Click on ticker or stock name for detailed view. Click on to add stock symbol to your watchlist and to view watchlist. |
12Stocks.com List of ETFs that track Consumer Services Index
| Ticker | ETF Name | Watchlist | Recent Price | Smart Investing & Trading Score | Change % | Week % | Year-to-date % |
| XLY | Consumer Discret Sel | | 226.74 | 90 | 2.01 | 3.58 | 1.56% |
| RTH | Retail | | 245.88 | 90 | 0.63 | 2.04 | 9.67% |
| IYC | Consumer Services | | 101.87 | 90 | 1.68 | 2.71 | 6.29% |
| XRT | Retail | | 83.23 | 90 | 2.54 | 4.59 | 5.13% |
| IYK | Consumer Goods | | 70.15 | 40 | 0.37 | 1.9 | 8.01% |
| UCC | Consumer Services | | 48.63 | 90 | 2.96 | 7 | -5.38% |
| RETL | Retail Bull 3X | | 9.28 | 90 | 26.94 | 13.31 | -5.36% |
| SCC | Short Consumer Services | | 16.35 | 0 | -19.86 | -6.67 | -9.94% |
| UGE | Consumer Goods | | 19.12 | 50 | 1.05 | 5.18 | 6.94% |
| 12Stocks.com: Charts, Trends, Fundamental Data and Performances of Consumer Services Stocks | |
|
We now take in-depth look at all Consumer Services stocks including charts, multi-period performances and overall trends (as measured by Smart Investing & Trading Score). One can sort Consumer Services stocks (click link to choose) by Daily, Weekly and by Year-to-Date performances. Also, one can sort by size of the company or by market capitalization. |
| Select Your Default Chart Type: | |||||
| |||||
| Click on stock symbol or name for detailed view. Click on to add stock symbol to your watchlist and to view watchlist. Quick View: Move mouse or cursor over "Daily" to quickly view daily Technical stock chart and over "Weekly" to view weekly Technical stock chart. | |||||

 | ODP Office Depot, Inc. |
| Sector: Services & Goods | |
| SubSector: Specialty Retail, Other | |
| MarketCap: 1024.44 Millions | |
| Recent Price: 19.42 Smart Investing & Trading Score: 50 | |
| Day Percent Change: 1.94% Day Change: 0.56 | |
| Week Change: 10.66% Year-to-date Change: -14.6% | |
| ODP Links: Profile News Message Board | |
| Charts:- Daily , Weekly | |
| Add ODP to Watchlist: View: Get Complete ODP Trend Analysis ➞ | |
 | GAMB Gambling.com Group Limited |
| Sector: Services & Goods | |
| SubSector: Gambling | |
| MarketCap: 376 Millions | |
| Recent Price: 10.62 Smart Investing & Trading Score: 50 | |
| Day Percent Change: 1.91% Day Change: 0.19 | |
| Week Change: 4.84% Year-to-date Change: -24.6% | |
| GAMB Links: Profile News Message Board | |
| Charts:- Daily , Weekly | |
| Add GAMB to Watchlist: View: Get Complete GAMB Trend Analysis ➞ | |
 | IPG The Interpublic Group of Companies, Inc. |
| Sector: Services & Goods | |
| SubSector: Advertising Agencies | |
| MarketCap: 5730.55 Millions | |
| Recent Price: 25.27 Smart Investing & Trading Score: 50 | |
| Day Percent Change: 1.8% Day Change: 0.57 | |
| Week Change: 2.14% Year-to-date Change: -7.4% | |
| IPG Links: Profile News Message Board | |
| Charts:- Daily , Weekly | |
| Add IPG to Watchlist: View: Get Complete IPG Trend Analysis ➞ | |
 | SCI Service Corporation International |
| Sector: Services & Goods | |
| SubSector: Personal Services | |
| MarketCap: 7216.05 Millions | |
| Recent Price: 80.78 Smart Investing & Trading Score: 50 | |
| Day Percent Change: 1.54% Day Change: 1.17 | |
| Week Change: 2.55% Year-to-date Change: 2.0% | |
| SCI Links: Profile News Message Board | |
| Charts:- Daily , Weekly | |
| Add SCI to Watchlist: View: Get Complete SCI Trend Analysis ➞ | |
 | MTN Vail Resorts, Inc. |
| Sector: Services & Goods | |
| SubSector: Resorts & Casinos | |
| MarketCap: 6259.64 Millions | |
| Recent Price: 150.81 Smart Investing & Trading Score: 50 | |
| Day Percent Change: 1.45% Day Change: 2.54 | |
| Week Change: 1.15% Year-to-date Change: -17.3% | |
| MTN Links: Profile News Message Board | |
| Charts:- Daily , Weekly | |
| Add MTN to Watchlist: View: Get Complete MTN Trend Analysis ➞ | |
 | MUSA Murphy USA Inc. |
| Sector: Services & Goods | |
| SubSector: Specialty Retail, Other | |
| MarketCap: 3133.14 Millions | |
| Recent Price: 390.59 Smart Investing & Trading Score: 50 | |
| Day Percent Change: 1.21% Day Change: 6.14 | |
| Week Change: 7.95% Year-to-date Change: -22.0% | |
| MUSA Links: Profile News Message Board | |
| Charts:- Daily , Weekly | |
| Add MUSA to Watchlist: View: Get Complete MUSA Trend Analysis ➞ | |
 | MAR Marriott International, Inc. |
| Sector: Services & Goods | |
| SubSector: Lodging | |
| MarketCap: 25831.6 Millions | |
| Recent Price: 265.01 Smart Investing & Trading Score: 50 | |
| Day Percent Change: 0.74% Day Change: 1.65 | |
| Week Change: 2.04% Year-to-date Change: -4.5% | |
| MAR Links: Profile News Message Board | |
| Charts:- Daily , Weekly | |
| Add MAR to Watchlist: View: Get Complete MAR Trend Analysis ➞ | |
 | FOX Twenty-First Century Fox, Inc. |
| Sector: Services & Goods | |
| SubSector: Entertainment - Diversified | |
| MarketCap: 24211.2 Millions | |
| Recent Price: 51.15 Smart Investing & Trading Score: 50 | |
| Day Percent Change: 0.66% Day Change: 0.25 | |
| Week Change: 2.16% Year-to-date Change: 12.4% | |
| FOX Links: Profile News Message Board | |
| Charts:- Daily , Weekly | |
| Add FOX to Watchlist: View: Get Complete FOX Trend Analysis ➞ | |
 | SPGI S&P Global Inc. |
| Sector: Services & Goods | |
| SubSector: Business Services | |
| MarketCap: 55247.9 Millions | |
| Recent Price: 559.06 Smart Investing & Trading Score: 50 | |
| Day Percent Change: 0.46% Day Change: 2.29 | |
| Week Change: -0.7% Year-to-date Change: 12.7% | |
| SPGI Links: Profile News Message Board | |
| Charts:- Daily , Weekly | |
| Add SPGI to Watchlist: View: Get Complete SPGI Trend Analysis ➞ | |
 | TAL TAL Education Group |
| Sector: Services & Goods | |
| SubSector: Education & Training Services | |
| MarketCap: 30103.1 Millions | |
| Recent Price: 11.38 Smart Investing & Trading Score: 50 | |
| Day Percent Change: 0.35% Day Change: 0.03 | |
| Week Change: 2.25% Year-to-date Change: 13.6% | |
| TAL Links: Profile News Message Board | |
| Charts:- Daily , Weekly | |
| Add TAL to Watchlist: View: Get Complete TAL Trend Analysis ➞ | |
 | DG Dollar General Corporation |
| Sector: Services & Goods | |
| SubSector: Discount, Variety Stores | |
| MarketCap: 39611.9 Millions | |
| Recent Price: 115.19 Smart Investing & Trading Score: 50 | |
| Day Percent Change: 0.24% Day Change: 0.3 | |
| Week Change: 3.91% Year-to-date Change: 54.9% | |
| DG Links: Profile News Message Board | |
| Charts:- Daily , Weekly | |
| Add DG to Watchlist: View: Get Complete DG Trend Analysis ➞ | |
 | SHLD Sears Holdings Corporation |
| Sector: Services & Goods | |
| SubSector: Department Stores | |
| MarketCap: 813.63 Millions | |
| Recent Price: 62.14 Smart Investing & Trading Score: 50 | |
| Day Percent Change: 0% Day Change: 0 | |
| Week Change: -1.55% Year-to-date Change: 66.4% | |
| SHLD Links: Profile News Message Board | |
| Charts:- Daily , Weekly | |
| Add SHLD to Watchlist: View: Get Complete SHLD Trend Analysis ➞ | |
 | CATO The Cato Corporation |
| Sector: Services & Goods | |
| SubSector: Apparel Stores | |
| MarketCap: 305.208 Millions | |
| Recent Price: 2.89 Smart Investing & Trading Score: 50 | |
| Day Percent Change: 0% Day Change: 0 | |
| Week Change: -0.69% Year-to-date Change: -25.9% | |
| CATO Links: Profile News Message Board | |
| Charts:- Daily , Weekly | |
| Add CATO to Watchlist: View: Get Complete CATO Trend Analysis ➞ | |
 | CPNG Coupang, Inc. |
| Sector: Services & Goods | |
| SubSector: Internet Retail | |
| MarketCap: 30840 Millions | |
| Recent Price: 28.14 Smart Investing & Trading Score: 50 | |
| Day Percent Change: -0.33% Day Change: -0.07 | |
| Week Change: -5.89% Year-to-date Change: 28.0% | |
| CPNG Links: Profile News Message Board | |
| Charts:- Daily , Weekly | |
| Add CPNG to Watchlist: View: Get Complete CPNG Trend Analysis ➞ | |
 | LAD Lithia Motors, Inc. |
| Sector: Services & Goods | |
| SubSector: Auto Dealerships | |
| MarketCap: 1727.21 Millions | |
| Recent Price: 300.81 Smart Investing & Trading Score: 50 | |
| Day Percent Change: -0.55% Day Change: -1.66 | |
| Week Change: 1.2% Year-to-date Change: -15.4% | |
| LAD Links: Profile News Message Board | |
| Charts:- Daily , Weekly | |
| Add LAD to Watchlist: View: Get Complete LAD Trend Analysis ➞ | |
 | QGEN QIAGEN N.V. |
| Sector: Services & Goods | |
| SubSector: Research Services | |
| MarketCap: 8698.94 Millions | |
| Recent Price: 48.97 Smart Investing & Trading Score: 50 | |
| Day Percent Change: -1.17% Day Change: -0.55 | |
| Week Change: -1.96% Year-to-date Change: 13.7% | |
| QGEN Links: Profile News Message Board | |
| Charts:- Daily , Weekly | |
| Add QGEN to Watchlist: View: Get Complete QGEN Trend Analysis ➞ | |
 | AZO AutoZone, Inc. |
| Sector: Services & Goods | |
| SubSector: Auto Parts Stores | |
| MarketCap: 19128 Millions | |
| Recent Price: 4000.67 Smart Investing & Trading Score: 50 | |
| Day Percent Change: -1.42% Day Change: -45.13 | |
| Week Change: -0.26% Year-to-date Change: 24.9% | |
| AZO Links: Profile News Message Board | |
| Charts:- Daily , Weekly | |
| Add AZO to Watchlist: View: Get Complete AZO Trend Analysis ➞ | |
 | HGV Hilton Grand Vacations Inc. |
| Sector: Services & Goods | |
| SubSector: Resorts & Casinos | |
| MarketCap: 1333.04 Millions | |
| Recent Price: 44.97 Smart Investing & Trading Score: 50 | |
| Day Percent Change: -17.38% Day Change: -8.06 | |
| Week Change: 2% Year-to-date Change: 15.5% | |
| HGV Links: Profile News Message Board | |
| Charts:- Daily , Weekly | |
| Add HGV to Watchlist: View: Get Complete HGV Trend Analysis ➞ | |
 | SGHC Super Group (SGHC) Limited |
| Sector: Services & Goods | |
| SubSector: Gambling | |
| MarketCap: 1390 Millions | |
| Recent Price: 10.97 Smart Investing & Trading Score: 41 | |
| Day Percent Change: 4.29% Day Change: 0.14 | |
| Week Change: 1.76% Year-to-date Change: 77.1% | |
| SGHC Links: Profile News Message Board | |
| Charts:- Daily , Weekly | |
| Add SGHC to Watchlist: View: Get Complete SGHC Trend Analysis ➞ | |
 | CDNA CareDx, Inc |
| Sector: Services & Goods | |
| SubSector: Research Services | |
| MarketCap: 828.194 Millions | |
| Recent Price: 12.46 Smart Investing & Trading Score: 40 | |
| Day Percent Change: 185.69% Day Change: 20.5 | |
| Week Change: -3.04% Year-to-date Change: -41.8% | |
| CDNA Links: Profile News Message Board | |
| Charts:- Daily , Weekly | |
| Add CDNA to Watchlist: View: Get Complete CDNA Trend Analysis ➞ | |
 | GWW W.W. Grainger, Inc. |
| Sector: Services & Goods | |
| SubSector: Industrial Equipment Wholesale | |
| MarketCap: 12794.8 Millions | |
| Recent Price: 960.70 Smart Investing & Trading Score: 40 | |
| Day Percent Change: 37.67% Day Change: 268.75 | |
| Week Change: 2.92% Year-to-date Change: -8.3% | |
| GWW Links: Profile News Message Board | |
| Charts:- Daily , Weekly | |
| Add GWW to Watchlist: View: Get Complete GWW Trend Analysis ➞ | |
 | STRA Strategic Education, Inc. |
| Sector: Services & Goods | |
| SubSector: Education & Training Services | |
| MarketCap: 2621.56 Millions | |
| Recent Price: 78.11 Smart Investing & Trading Score: 40 | |
| Day Percent Change: 29.85% Day Change: 22.39 | |
| Week Change: 4.37% Year-to-date Change: -15.2% | |
| STRA Links: Profile News Message Board | |
| Charts:- Daily , Weekly | |
| Add STRA to Watchlist: View: Get Complete STRA Trend Analysis ➞ | |
 | LOCO El Pollo Loco Holdings, Inc. |
| Sector: Services & Goods | |
| SubSector: Restaurants | |
| MarketCap: 296.97 Millions | |
| Recent Price: 10.38 Smart Investing & Trading Score: 40 | |
| Day Percent Change: 26.7% Day Change: 2.87 | |
| Week Change: 0.97% Year-to-date Change: -10.1% | |
| LOCO Links: Profile News Message Board | |
| Charts:- Daily , Weekly | |
| Add LOCO to Watchlist: View: Get Complete LOCO Trend Analysis ➞ | |
 | GOLF Acushnet Holdings Corp. |
| Sector: Services & Goods | |
| SubSector: Sporting Goods Stores | |
| MarketCap: 1717.74 Millions | |
| Recent Price: 76.28 Smart Investing & Trading Score: 40 | |
| Day Percent Change: 16.72% Day Change: 9.6 | |
| Week Change: -5.12% Year-to-date Change: 8.0% | |
| GOLF Links: Profile News Message Board | |
| Charts:- Daily , Weekly | |
| Add GOLF to Watchlist: View: Get Complete GOLF Trend Analysis ➞ | |
 | CHDN Churchill Downs Incorporated |
| Sector: Services & Goods | |
| SubSector: Gaming Activities | |
| MarketCap: 3693.29 Millions | |
| Recent Price: 102.15 Smart Investing & Trading Score: 40 | |
| Day Percent Change: 13.76% Day Change: 16.72 | |
| Week Change: -1.25% Year-to-date Change: -23.5% | |
| CHDN Links: Profile News Message Board | |
| Charts:- Daily , Weekly | |
| Add CHDN to Watchlist: View: Get Complete CHDN Trend Analysis ➞ | |
| For tabular summary view of above stock list: Summary View ➞ 0 - 25 , 25 - 50 , 50 - 75 , 75 - 100 , 100 - 125 , 125 - 150 , 150 - 175 , 175 - 200 , 200 - 225 , 225 - 250 , 250 - 275 , 275 - 300 , 300 - 325 , 325 - 350 , 350 - 375 | ||
| Click To Change The Sort Order: By Market Cap or Company Size Performance: Year-to-date, Week and Day | |
| Select Chart Type: | ||
|
Best Stocks Today 12Stocks.com |
© 2025 12Stocks.com Terms & Conditions Privacy Contact Us
All Information Provided Only For Education And Not To Be Used For Investing or Trading. See Terms & Conditions


One More Thing ... Get Best Stocks Delivered Daily!
Never Ever Miss A Move With Our Top Ten Stocks Lists
Find Best Stocks In Any Market - Bull or Bear Market
Take A Peek At Our Top Ten Stocks Lists: Daily, Weekly, Year-to-Date & Top Trends
Find Best Stocks In Any Market - Bull or Bear Market
Take A Peek At Our Top Ten Stocks Lists: Daily, Weekly, Year-to-Date & Top Trends
Consumer Services Stocks With Best Up Trends [0-bearish to 100-bullish]: VSE [100], eBay [100], Kratos Defense[100], Graham [100], CompX [100], Fastenal [100], Jacobs Engineering[100], Willdan [100], Gray Television[100], Williams-Sonoma [100], Rush Enterprises[100]
Best Consumer Services Stocks Year-to-Date:
ThredUp [640.29%], Vivid Seats[278.19%], Willdan [211.45%], Kratos Defense[162.09%], Roblox [123.87%], National Vision[120.92%], Altisource Portfolio[99.84%], Noodles & [90.05%], Gray Television[89.96%], QuantumScape [80.15%], PaySign [80.13%] Best Consumer Services Stocks This Week:
Vivid Seats[1616.67%], Holley [66.18%], Money[64.55%], Myriad Genetics[55.81%], Grocery Outlet[42.09%], RealReal [33.98%], CompX [30.87%], Willdan [30.08%], comScore [29.36%], Arhaus [27.48%], Gray Television[26.37%] Best Consumer Services Stocks Daily:
CareDx [185.69%], Wingstop [150.46%], National CineMedia[112.46%], VSE [69.41%], Burlington Stores[66.03%], Myriad Genetics[64.88%], Costco Wholesale[58.1%], Daily Journal[57.5%], Texas Roadhouse[55.27%], Royal Caribbean[53.63%], CRA [53.26%]