
 Login Sign Up


| |||||
 |  | ||||

| 12Stocks.com Market Intelligence |
Best Biotech Stocks
|
|
| Quick Read: Best Biotech Stocks List By Performances & Trends: Daily, Weekly, Year-to-Date, Market Cap (Size) & Technical Trends | |||
| Best Biotech Stocks Views: Quick Browse View, Summary & Slide Show View | |||
| 12Stocks.com Biotech Stocks Performances & Trends Daily | |||||||||
|
|  The overall market intelligence score is 49 (0-bearish to 100-bullish) which puts Biotech sector in short term neutral trend. The market intelligence score from previous trading session is 17 and hence an improvement of trend.
| ||||||||
Here are the market intelligence trend scores of the most requested Biotech stocks at 12Stocks.com (click stock name for detailed review):
|


| 12Stocks.com: Investing in Biotech sector with Stocks | |
|
The following table helps investors and traders sort through current performance and trends (as measured by market intelligence score) of various
stocks in the Biotech sector. Quick View: Move mouse or cursor over stock symbol (ticker) to view short-term Technical chart and over stock name to view long term chart. Click on  to add stock symbol to your watchlist and to add stock symbol to your watchlist and  to view watchlist. Click on any ticker or stock name for detailed market intelligence report for that stock. to view watchlist. Click on any ticker or stock name for detailed market intelligence report for that stock. |
12Stocks.com Performance of Stocks in Biotech Sector
| Ticker | Stock Name | Watchlist | Category | Recent Price | Market Intelligence Score | Change % | Weekly Change% |
| GRTX | Galera |   | Biotechnology | 0.18 | 40 | -1.88% | -1.88% |
| BTAI | BioXcel | | Biotechnology | 2.58 | 24 | -1.90% | -1.90% |
| DERM | Dermira | | Biotechnology | 3.33 | 20 | -2.06% | -2.06% |
| CVM | CEL-SCI | | Biotechnology | 1.41 | 20 | -2.08% | -2.08% |
| PEPG | PepGen | | Biotechnology | 11.68 | 75 | -2.10% | -2.10% |
| APLM | Apollomics | | Biotechnology | 0.44 | 10 | -2.22% | -2.22% |
| VTYX | Ventyx | | Biotechnology | 3.84 | 51 | -2.66% | -2.66% |
| RAPT | RAPT | | Biotechnology | 7.88 | 49 | -2.72% | -2.72% |
| RIGL | Rigel | | Biotechnology | 1.07 | 18 | -2.73% | -2.73% |
| QURE | uniQure N.V | | Biotechnology | 4.39 | 35 | -3.09% | -3.09% |
| MOR | MorphoSys AG | | Biotechnology | 17.36 | 31 | -3.77% | -3.77% |
| GLSI | Greenwich Life | | Biotechnology | 12.60 | 58 | -3.96% | -3.96% |
| APLS | Apellis | | Biotechnology | 47.84 | 20 | -4.05% | -4.05% |
| VIGL | Vigil Neuroscience | | Biotechnology | 2.60 | 20 | -4.06% | -4.06% |
| CYTK | Cytokinetics | | Biotechnology | 62.53 | 10 | -4.30% | -4.30% |
| STOK | Stoke | | Biotechnology | 11.86 | 68 | -4.43% | -4.43% |
| MOLN | Molecular Partners | | Biotechnology | 3.70 | 25 | -4.64% | -4.64% |
| CABA | Cabaletta Bio | | Biotechnology | 10.48 | 0 | -4.81% | -4.81% |
| AUTL | Autolus | | Biotechnology | 3.80 | 10 | -5.00% | -5.00% |
| PHAR | Pharming | | Biotechnology | 9.91 | 20 | -5.17% | -5.17% |
| AVTE | Aerovate | | Biotechnology | 20.55 | 54 | -5.52% | -5.52% |
| PRLD | Prelude | | Biotechnology | 3.84 | 56 | -5.65% | -5.65% |
| IBIO | iBio | | Biotechnology | 1.66 | 46 | -5.68% | -5.68% |
| GLYC | GlycoMimetics | | Biotechnology | 1.54 | 10 | -5.79% | -5.79% |
| ALGS | Aligos | | Biotechnology | 0.73 | 41 | -6.16% | -6.16% |
| To view more stocks, click on Next / Previous arrows or select different range: 0 - 25 , 25 - 50 , 50 - 75 , 75 - 100 , 100 - 125 , 125 - 150 , 150 - 175 , 175 - 200 , 200 - 225 , 225 - 250 , 250 - 275 , 275 - 300 , 300 - 325 , 325 - 350 , 350 - 375 , 375 - 400 | ||
 | Click To Change The Sort Order: By Market Cap or Company Size Performance: Year-to-date, Week and Day |  |
|
Get the most comprehensive stock market coverage daily at 12Stocks.com ➞ Best Stocks Today ➞ Best Stocks Weekly ➞ Best Stocks Year-to-Date ➞ Best Stocks Trends ➞  Best Stocks Today 12Stocks.com Best Nasdaq Stocks ➞ Best S&P 500 Stocks ➞ Best Tech Stocks ➞ Best Biotech Stocks ➞ |
| Detailed Overview of Biotech Stocks |
| Biotech Technical Overview, Leaders & Laggards, Top Biotech ETF Funds & Detailed Biotech Stocks List, Charts, Trends & More |
| Biotech Sector: Technical Analysis, Trends & YTD Performance | |
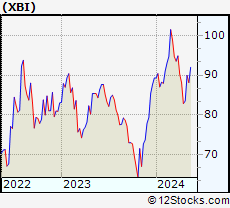
| Biotech sector, as represented by XBI, an exchange-traded fund [ETF] that holds basket of Biotech stocks (e.g, Amgen, Celgene) is down by -4.22% and is currently underperforming the overall market by -10.78% year-to-date. Below is a quick view of Technical charts and trends: | |
 XBI Weekly Chart |
|
| Long Term Trend: Not Good | |
| Medium Term Trend: Not Good | |
 XBI Daily Chart |
|
| Short Term Trend: Very Good | |
| Overall Trend Score: 49 | |
| YTD Performance: -4.22% | |
| **Trend Scores & Views Are Only For Educational Purposes And Not For Investing | |
| 12Stocks.com: Top Performing Biotech Sector Stocks | ||||||||||||||||||||||||||||||||||||||||||||||||
 The top performing Biotech sector stocks year to date are
Now, more recently, over last week, the top performing Biotech sector stocks on the move are


|
||||||||||||||||||||||||||||||||||||||||||||||||
| 12Stocks.com: Investing in Biotech Sector using Exchange Traded Funds | |
|
The following table shows list of key exchange traded funds (ETF) that
help investors track Biotech Index. For detailed view, check out our ETF Funds section of our website. Quick View: Move mouse or cursor over ETF symbol (ticker) to view short-term Technical chart and over ETF name to view long term chart. Click on ticker or stock name for detailed view. Click on to add stock symbol to your watchlist and to view watchlist. |
12Stocks.com List of ETFs that track Biotech Index
| Ticker | ETF Name | Watchlist | Recent Price | Market Intelligence Score | Change % | Week % | Year-to-date % |
| LABD | Biotech Bear 3X | | 9.69 | 35 | -7.89 | -7.89 | 0% |
| XBI | Biotech | | 85.52 | 49 | 2.43 | 2.43 | -4.22% |
| LABU | Biotech Bull 3X | | 94.11 | 42 | 7.54 | 7.54 | -22.84% |
| IBB | Biotechnology | | 128.37 | 35 | 1.49 | 1.49 | -5.51% |
| IYH | Healthcare | | 58.86 | 70 | 0.43 | 0.43 | 2.82% |
| IXJ | Global Healthcare | | 89.47 | 70 | 0.39 | 0.39 | 3.17% |
| BIB | Biotechnology | | 51.77 | 57 | 4.25 | 4.25 | -9.26% |
| IHF | Healthcare Providers | | 52.06 | 65 | 0.27 | 0.27 | -0.86% |
| CURE | Healthcare Bull 3X | | 106.25 | 49 | 0.90 | 0.9 | 4.43% |
| FBT | First NYSE | | 145.65 | 42 | 1.39 | 1.39 | -7.85% |
| BIS | Short Biotech | | 19.55 | 56 | -3.31 | -3.31 | 8.19% |
| PTH | DWA Healthcare Momentum | | 39.88 | 48 | -0.03 | -0.03 | 1.89% |
| PBE | Biotech & Genome | | 61.47 | 57 | 1.81 | 1.81 | -6.64% |
| BTEC | Principal Healthcare Innovators | | 34.84 | 42 | 1.72 | 1.72 | -4.1% |
| BBH | Biotech | | 157.37 | 27 | 1.10 | 1.1 | -4.81% |
| BBP | Bio Biotechnology Products | | 53.55 | 64 | 4.01 | 4.01 | -7.82% |
| BBC | Bio Biotechnology Clinical | | 26.25 | 75 | 2.82 | 2.82 | 7.35% |
| 12Stocks.com: Charts, Trends, Fundamental Data and Performances of Biotech Stocks | |
|
We now take in-depth look at all Biotech stocks including charts, multi-period performances and overall trends (as measured by market intelligence score). One can sort Biotech stocks (click link to choose) by Daily, Weekly and by Year-to-Date performances. Also, one can sort by size of the company or by market capitalization. |
| Select Your Default Chart Type: | |||||
| |||||
| Click on stock symbol or name for detailed view. Click on to add stock symbol to your watchlist and to view watchlist. Quick View: Move mouse or cursor over "Daily" to quickly view daily Technical stock chart and over "Weekly" to view weekly Technical stock chart. | |||||

 | GRTX Galera Therapeutics, Inc. |
| Sector: Health Care | |
| SubSector: Biotechnology | |
| MarketCap: 277.585 Millions | |
| Recent Price: 0.18 Market Intelligence Score: 40 | |
| Day Percent Change: -1.88% Day Change: 0.00 | |
| Week Change: -1.88% Year-to-date Change: 25.6% | |
| GRTX Links: Profile News Message Board | |
| Charts:- Daily , Weekly | |
| Add GRTX to Watchlist: View: Get Complete GRTX Trend Analysis ➞ | |
 | BTAI BioXcel Therapeutics, Inc. |
| Sector: Health Care | |
| SubSector: Biotechnology | |
| MarketCap: 487.485 Millions | |
| Recent Price: 2.58 Market Intelligence Score: 24 | |
| Day Percent Change: -1.90% Day Change: -0.05 | |
| Week Change: -1.9% Year-to-date Change: -12.5% | |
| BTAI Links: Profile News Message Board | |
| Charts:- Daily , Weekly | |
| Add BTAI to Watchlist: View: Get Complete BTAI Trend Analysis ➞ | |
 | DERM Dermira, Inc. |
| Sector: Health Care | |
| SubSector: Biotechnology | |
| MarketCap: 1312.25 Millions | |
| Recent Price: 3.33 Market Intelligence Score: 20 | |
| Day Percent Change: -2.06% Day Change: -0.07 | |
| Week Change: -2.06% Year-to-date Change: -42.2% | |
| DERM Links: Profile News Message Board | |
| Charts:- Daily , Weekly | |
| Add DERM to Watchlist: View: Get Complete DERM Trend Analysis ➞ | |
 | CVM CEL-SCI Corporation |
| Sector: Health Care | |
| SubSector: Biotechnology | |
| MarketCap: 483.885 Millions | |
| Recent Price: 1.41 Market Intelligence Score: 20 | |
| Day Percent Change: -2.08% Day Change: -0.03 | |
| Week Change: -2.08% Year-to-date Change: -48.2% | |
| CVM Links: Profile News Message Board | |
| Charts:- Daily , Weekly | |
| Add CVM to Watchlist: View: Get Complete CVM Trend Analysis ➞ | |
 | PEPG PepGen Inc. |
| Sector: Health Care | |
| SubSector: Biotechnology | |
| MarketCap: 216 Millions | |
| Recent Price: 11.68 Market Intelligence Score: 75 | |
| Day Percent Change: -2.10% Day Change: -0.25 | |
| Week Change: -2.1% Year-to-date Change: 70.8% | |
| PEPG Links: Profile News Message Board | |
| Charts:- Daily , Weekly | |
| Add PEPG to Watchlist: View: Get Complete PEPG Trend Analysis ➞ | |
 | APLM Apollomics, Inc. |
| Sector: Health Care | |
| SubSector: Biotechnology | |
| MarketCap: 481 Millions | |
| Recent Price: 0.44 Market Intelligence Score: 10 | |
| Day Percent Change: -2.22% Day Change: -0.01 | |
| Week Change: -2.22% Year-to-date Change: -52.6% | |
| APLM Links: Profile News Message Board | |
| Charts:- Daily , Weekly | |
| Add APLM to Watchlist: View: Get Complete APLM Trend Analysis ➞ | |
 | VTYX Ventyx Biosciences, Inc. |
| Sector: Health Care | |
| SubSector: Biotechnology | |
| MarketCap: 1950 Millions | |
| Recent Price: 3.84 Market Intelligence Score: 51 | |
| Day Percent Change: -2.66% Day Change: -0.10 | |
| Week Change: -2.66% Year-to-date Change: 55.0% | |
| VTYX Links: Profile News Message Board | |
| Charts:- Daily , Weekly | |
| Add VTYX to Watchlist: View: Get Complete VTYX Trend Analysis ➞ | |
 | RAPT RAPT Therapeutics, Inc. |
| Sector: Health Care | |
| SubSector: Biotechnology | |
| MarketCap: 368.785 Millions | |
| Recent Price: 7.88 Market Intelligence Score: 49 | |
| Day Percent Change: -2.72% Day Change: -0.22 | |
| Week Change: -2.72% Year-to-date Change: -68.3% | |
| RAPT Links: Profile News Message Board | |
| Charts:- Daily , Weekly | |
| Add RAPT to Watchlist: View: Get Complete RAPT Trend Analysis ➞ | |
 | RIGL Rigel Pharmaceuticals, Inc. |
| Sector: Health Care | |
| SubSector: Biotechnology | |
| MarketCap: 256.585 Millions | |
| Recent Price: 1.07 Market Intelligence Score: 18 | |
| Day Percent Change: -2.73% Day Change: -0.03 | |
| Week Change: -2.73% Year-to-date Change: -26.2% | |
| RIGL Links: Profile News Message Board | |
| Charts:- Daily , Weekly | |
| Add RIGL to Watchlist: View: Get Complete RIGL Trend Analysis ➞ | |
 | QURE uniQure N.V. |
| Sector: Health Care | |
| SubSector: Biotechnology | |
| MarketCap: 2267.25 Millions | |
| Recent Price: 4.39 Market Intelligence Score: 35 | |
| Day Percent Change: -3.09% Day Change: -0.14 | |
| Week Change: -3.09% Year-to-date Change: -35.2% | |
| QURE Links: Profile News Message Board | |
| Charts:- Daily , Weekly | |
| Add QURE to Watchlist: View: Get Complete QURE Trend Analysis ➞ | |
 | MOR MorphoSys AG |
| Sector: Health Care | |
| SubSector: Biotechnology | |
| MarketCap: 2636.85 Millions | |
| Recent Price: 17.36 Market Intelligence Score: 31 | |
| Day Percent Change: -3.77% Day Change: -0.68 | |
| Week Change: -3.77% Year-to-date Change: 75.4% | |
| MOR Links: Profile News Message Board | |
| Charts:- Daily , Weekly | |
| Add MOR to Watchlist: View: Get Complete MOR Trend Analysis ➞ | |
 | GLSI Greenwich LifeSciences, Inc. |
| Sector: Health Care | |
| SubSector: Biotechnology | |
| MarketCap: 86487 Millions | |
| Recent Price: 12.60 Market Intelligence Score: 58 | |
| Day Percent Change: -3.96% Day Change: -0.52 | |
| Week Change: -3.96% Year-to-date Change: 18.9% | |
| GLSI Links: Profile News Message Board | |
| Charts:- Daily , Weekly | |
| Add GLSI to Watchlist: View: Get Complete GLSI Trend Analysis ➞ | |
 | APLS Apellis Pharmaceuticals, Inc. |
| Sector: Health Care | |
| SubSector: Biotechnology | |
| MarketCap: 2030.95 Millions | |
| Recent Price: 47.84 Market Intelligence Score: 20 | |
| Day Percent Change: -4.05% Day Change: -2.02 | |
| Week Change: -4.05% Year-to-date Change: -20.1% | |
| APLS Links: Profile News Message Board | |
| Charts:- Daily , Weekly | |
| Add APLS to Watchlist: View: Get Complete APLS Trend Analysis ➞ | |
 | VIGL Vigil Neuroscience, Inc. |
| Sector: Health Care | |
| SubSector: Biotechnology | |
| MarketCap: 339 Millions | |
| Recent Price: 2.60 Market Intelligence Score: 20 | |
| Day Percent Change: -4.06% Day Change: -0.11 | |
| Week Change: -4.06% Year-to-date Change: -24.2% | |
| VIGL Links: Profile News Message Board | |
| Charts:- Daily , Weekly | |
| Add VIGL to Watchlist: View: Get Complete VIGL Trend Analysis ➞ | |
 | CYTK Cytokinetics, Incorporated |
| Sector: Health Care | |
| SubSector: Biotechnology | |
| MarketCap: 654.285 Millions | |
| Recent Price: 62.53 Market Intelligence Score: 10 | |
| Day Percent Change: -4.30% Day Change: -2.81 | |
| Week Change: -4.3% Year-to-date Change: -25.1% | |
| CYTK Links: Profile News Message Board | |
| Charts:- Daily , Weekly | |
| Add CYTK to Watchlist: View: Get Complete CYTK Trend Analysis ➞ | |
 | STOK Stoke Therapeutics, Inc. |
| Sector: Health Care | |
| SubSector: Biotechnology | |
| MarketCap: 772.485 Millions | |
| Recent Price: 11.86 Market Intelligence Score: 68 | |
| Day Percent Change: -4.43% Day Change: -0.55 | |
| Week Change: -4.43% Year-to-date Change: 125.5% | |
| STOK Links: Profile News Message Board | |
| Charts:- Daily , Weekly | |
| Add STOK to Watchlist: View: Get Complete STOK Trend Analysis ➞ | |
 | MOLN Molecular Partners AG |
| Sector: Health Care | |
| SubSector: Biotechnology | |
| MarketCap: 216 Millions | |
| Recent Price: 3.70 Market Intelligence Score: 25 | |
| Day Percent Change: -4.64% Day Change: -0.18 | |
| Week Change: -4.64% Year-to-date Change: -7.9% | |
| MOLN Links: Profile News Message Board | |
| Charts:- Daily , Weekly | |
| Add MOLN to Watchlist: View: Get Complete MOLN Trend Analysis ➞ | |
 | CABA Cabaletta Bio, Inc. |
| Sector: Health Care | |
| SubSector: Biotechnology | |
| MarketCap: 222.085 Millions | |
| Recent Price: 10.48 Market Intelligence Score: 0 | |
| Day Percent Change: -4.81% Day Change: -0.53 | |
| Week Change: -4.81% Year-to-date Change: -53.8% | |
| CABA Links: Profile News Message Board | |
| Charts:- Daily , Weekly | |
| Add CABA to Watchlist: View: Get Complete CABA Trend Analysis ➞ | |
 | AUTL Autolus Therapeutics plc |
| Sector: Health Care | |
| SubSector: Biotechnology | |
| MarketCap: 296.285 Millions | |
| Recent Price: 3.80 Market Intelligence Score: 10 | |
| Day Percent Change: -5.00% Day Change: -0.20 | |
| Week Change: -5% Year-to-date Change: -41.0% | |
| AUTL Links: Profile News Message Board | |
| Charts:- Daily , Weekly | |
| Add AUTL to Watchlist: View: Get Complete AUTL Trend Analysis ➞ | |
 | PHAR Pharming Group N.V. |
| Sector: Health Care | |
| SubSector: Biotechnology | |
| MarketCap: 808 Millions | |
| Recent Price: 9.91 Market Intelligence Score: 20 | |
| Day Percent Change: -5.17% Day Change: -0.54 | |
| Week Change: -5.17% Year-to-date Change: -13.3% | |
| PHAR Links: Profile News Message Board | |
| Charts:- Daily , Weekly | |
| Add PHAR to Watchlist: View: Get Complete PHAR Trend Analysis ➞ | |
 | AVTE Aerovate Therapeutics, Inc. |
| Sector: Health Care | |
| SubSector: Biotechnology | |
| MarketCap: 478 Millions | |
| Recent Price: 20.55 Market Intelligence Score: 54 | |
| Day Percent Change: -5.52% Day Change: -1.20 | |
| Week Change: -5.52% Year-to-date Change: -9.0% | |
| AVTE Links: Profile News Message Board | |
| Charts:- Daily , Weekly | |
| Add AVTE to Watchlist: View: Get Complete AVTE Trend Analysis ➞ | |
 | PRLD Prelude Therapeutics Incorporated |
| Sector: Health Care | |
| SubSector: Biotechnology | |
| MarketCap: 26087 Millions | |
| Recent Price: 3.84 Market Intelligence Score: 56 | |
| Day Percent Change: -5.65% Day Change: -0.23 | |
| Week Change: -5.65% Year-to-date Change: -11.7% | |
| PRLD Links: Profile News Message Board | |
| Charts:- Daily , Weekly | |
| Add PRLD to Watchlist: View: Get Complete PRLD Trend Analysis ➞ | |
 | IBIO iBio, Inc. |
| Sector: Health Care | |
| SubSector: Biotechnology | |
| MarketCap: 110.885 Millions | |
| Recent Price: 1.66 Market Intelligence Score: 46 | |
| Day Percent Change: -5.68% Day Change: -0.10 | |
| Week Change: -5.68% Year-to-date Change: 21.2% | |
| IBIO Links: Profile News Message Board | |
| Charts:- Daily , Weekly | |
| Add IBIO to Watchlist: View: Get Complete IBIO Trend Analysis ➞ | |
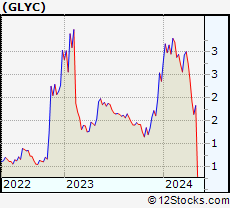 | GLYC GlycoMimetics, Inc. |
| Sector: Health Care | |
| SubSector: Biotechnology | |
| MarketCap: 100.785 Millions | |
| Recent Price: 1.54 Market Intelligence Score: 10 | |
| Day Percent Change: -5.79% Day Change: -0.09 | |
| Week Change: -5.79% Year-to-date Change: -34.5% | |
| GLYC Links: Profile News Message Board | |
| Charts:- Daily , Weekly | |
| Add GLYC to Watchlist: View: Get Complete GLYC Trend Analysis ➞ | |
 | ALGS Aligos Therapeutics, Inc. |
| Sector: Health Care | |
| SubSector: Biotechnology | |
| MarketCap: 76487 Millions | |
| Recent Price: 0.73 Market Intelligence Score: 41 | |
| Day Percent Change: -6.16% Day Change: -0.05 | |
| Week Change: -6.16% Year-to-date Change: 12.7% | |
| ALGS Links: Profile News Message Board | |
| Charts:- Daily , Weekly | |
| Add ALGS to Watchlist: View: Get Complete ALGS Trend Analysis ➞ | |
| To view more stocks, click on Next / Previous arrows or select different range: 0 - 25 , 25 - 50 , 50 - 75 , 75 - 100 , 100 - 125 , 125 - 150 , 150 - 175 , 175 - 200 , 200 - 225 , 225 - 250 , 250 - 275 , 275 - 300 , 300 - 325 , 325 - 350 , 350 - 375 , 375 - 400 | ||
| Click To Change The Sort Order: By Market Cap or Company Size Performance: Year-to-date, Week and Day | |
| Select Chart Type: | ||
|
Best Stocks Today 12Stocks.com |
© 2024 12Stocks.com Terms & Conditions Privacy Contact Us
All Information Provided Only For Education And Not To Be Used For Investing or Trading. See Terms & Conditions


One More Thing ... Get Best Stocks Delivered Daily!
Never Ever Miss A Move With Our Top Ten Stocks Lists
Find Best Stocks In Any Market - Bull or Bear Market
Take A Peek At Our Top Ten Stocks Lists: Daily, Weekly, Year-to-Date & Top Trends
Find Best Stocks In Any Market - Bull or Bear Market
Take A Peek At Our Top Ten Stocks Lists: Daily, Weekly, Year-to-Date & Top Trends
Biotech Stocks With Best Up Trends [0-bearish to 100-bullish]: Deciphera [100], Mesoblast [100], PTC [100], Agenus [100], Cullinan Oncology[100], Xencor [100], Zura Bio[100], Verrica [100], Agios [100], Shattuck Labs[100], Moderna [100]
Best Biotech Stocks Year-to-Date:
Pieris [6328.57%], Avenue [2707.45%], Precision [2595.89%], Inovio [2154.9%], Assembly [1472.98%], Agenus [1441.25%], NuCana [1252.27%], Adverum nologies[1167.27%], Affimed N.V[776.8%], Mesoblast [545.45%], Corbus [490.07%] Best Biotech Stocks This Week:
Deciphera [72.56%], Vaxxinity [31.65%], Acrivon [18.2%], Janux [18.18%], Ocean Biomedical[17.16%], Ginkgo Bioworks[15.08%], Codexis [14.66%], Exscientia [14.5%], Mesoblast [13.78%], PTC [12.5%], Nektar [10.61%] Best Biotech Stocks Daily:
Deciphera [72.56%], Vaxxinity [31.65%], Acrivon [18.20%], Janux [18.18%], Ocean Biomedical[17.16%], Ginkgo Bioworks[15.08%], Codexis [14.66%], Exscientia [14.50%], Mesoblast [13.78%], PTC [12.50%], Nektar [10.61%]