
 Login Sign Up


| |||||
 |  | ||||

| 12Stocks.com Market Intelligence |
Best Biotech Stocks
|
|
| Quick Read: Best Biotech Stocks List By Performances & Trends: Daily, Weekly, Year-to-Date, Market Cap (Size) & Technical Trends | |||
| Best Biotech Stocks Views: Quick Browse View, Summary & Slide Show View | |||
| 12Stocks.com Biotech Stocks Performances & Trends Daily | |||||||||
|
|  The overall market intelligence score is 49 (0-bearish to 100-bullish) which puts Biotech sector in short term neutral trend. The market intelligence score from previous trading session is 17 and hence an improvement of trend.
| ||||||||
Here are the market intelligence trend scores of the most requested Biotech stocks at 12Stocks.com (click stock name for detailed review):
|


| 12Stocks.com: Investing in Biotech sector with Stocks | |
|
The following table helps investors and traders sort through current performance and trends (as measured by market intelligence score) of various
stocks in the Biotech sector. Quick View: Move mouse or cursor over stock symbol (ticker) to view short-term Technical chart and over stock name to view long term chart. Click on  to add stock symbol to your watchlist and to add stock symbol to your watchlist and  to view watchlist. Click on any ticker or stock name for detailed market intelligence report for that stock. to view watchlist. Click on any ticker or stock name for detailed market intelligence report for that stock. |
12Stocks.com Performance of Stocks in Biotech Sector
| Ticker | Stock Name | Watchlist | Category | Recent Price | Market Intelligence Score | Change % | Weekly Change% |
| FOLD | Amicus |   | Biotechnology | 10.25 | 27 | -0.29% | -0.29% |
| IVA | Inventiva S.A | | Biotechnology | 3.24 | 10 | -0.31% | -0.31% |
| VRTX | Vertex | | Biotechnology | 396.20 | 25 | -0.32% | -0.32% |
| XOMAO | XOMA | | Biotechnology | 24.89 | 48 | -0.32% | -0.32% |
| LEGN | Legend | | Biotechnology | 45.14 | 25 | -0.35% | -0.35% |
| MRNS | Marinus | | Biotechnology | 1.40 | 24 | -0.36% | -0.36% |
| MORF | Morphic Holding | | Biotechnology | 27.97 | 32 | -0.36% | -0.36% |
| GLPG | Galapagos NV | | Biotechnology | 28.65 | 35 | -0.38% | -0.38% |
| BDTX | Black Diamond | | Biotechnology | 5.87 | 85 | -0.42% | -0.42% |
| GLTO | Galecto | | Biotechnology | 0.70 | 85 | -0.44% | -0.44% |
| INZY | Inozyme Pharma | | Biotechnology | 4.42 | 32 | -0.45% | -0.45% |
| RARE | Ultragenyx | | Biotechnology | 44.02 | 80 | -0.50% | -0.50% |
| RCKT | Rocket | | Biotechnology | 21.85 | 10 | -0.59% | -0.59% |
| AKRO | Akero | | Biotechnology | 19.62 | 27 | -0.61% | -0.61% |
| OMER | Omeros | | Biotechnology | 3.13 | 49 | -0.63% | -0.63% |
| IMCR | Immunocore | | Biotechnology | 58.10 | 57 | -0.70% | -0.70% |
| PGEN | Precigen | | Biotechnology | 1.40 | 80 | -0.71% | -0.71% |
| FENC | Fennec | | Biotechnology | 9.14 | 32 | -0.76% | -0.76% |
| URGN | UroGen Pharma | | Biotechnology | 14.04 | 30 | -0.78% | -0.78% |
| FULC | Fulcrum | | Biotechnology | 7.08 | 23 | -0.84% | -0.84% |
| RGNX | REGENXBIO | | Biotechnology | 16.05 | 65 | -0.86% | -0.86% |
| TRDA | Entrada | | Biotechnology | 12.34 | 10 | -0.88% | -0.88% |
| GRTS | Gritstone Oncology | | Biotechnology | 0.81 | 42 | -0.90% | -0.90% |
| TGTX | TG | | Biotechnology | 13.32 | 0 | -1.11% | -1.11% |
| NERV | Minerva Neuro | | Biotechnology | 2.41 | 10 | -1.11% | -1.11% |
| To view more stocks, click on Next / Previous arrows or select different range: 0 - 25 , 25 - 50 , 50 - 75 , 75 - 100 , 100 - 125 , 125 - 150 , 150 - 175 , 175 - 200 , 200 - 225 , 225 - 250 , 250 - 275 , 275 - 300 , 300 - 325 , 325 - 350 , 350 - 375 , 375 - 400 | ||
 | Click To Change The Sort Order: By Market Cap or Company Size Performance: Year-to-date, Week and Day |  |
|
Get the most comprehensive stock market coverage daily at 12Stocks.com ➞ Best Stocks Today ➞ Best Stocks Weekly ➞ Best Stocks Year-to-Date ➞ Best Stocks Trends ➞  Best Stocks Today 12Stocks.com Best Nasdaq Stocks ➞ Best S&P 500 Stocks ➞ Best Tech Stocks ➞ Best Biotech Stocks ➞ |
| Detailed Overview of Biotech Stocks |
| Biotech Technical Overview, Leaders & Laggards, Top Biotech ETF Funds & Detailed Biotech Stocks List, Charts, Trends & More |
| Biotech Sector: Technical Analysis, Trends & YTD Performance | |
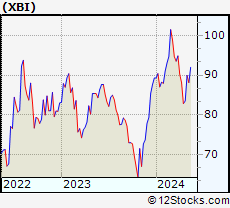
| Biotech sector, as represented by XBI, an exchange-traded fund [ETF] that holds basket of Biotech stocks (e.g, Amgen, Celgene) is down by -4.22% and is currently underperforming the overall market by -10.78% year-to-date. Below is a quick view of Technical charts and trends: | |
 XBI Weekly Chart |
|
| Long Term Trend: Not Good | |
| Medium Term Trend: Not Good | |
 XBI Daily Chart |
|
| Short Term Trend: Very Good | |
| Overall Trend Score: 49 | |
| YTD Performance: -4.22% | |
| **Trend Scores & Views Are Only For Educational Purposes And Not For Investing | |
| 12Stocks.com: Top Performing Biotech Sector Stocks | ||||||||||||||||||||||||||||||||||||||||||||||||
 The top performing Biotech sector stocks year to date are
Now, more recently, over last week, the top performing Biotech sector stocks on the move are


|
||||||||||||||||||||||||||||||||||||||||||||||||
| 12Stocks.com: Investing in Biotech Sector using Exchange Traded Funds | |
|
The following table shows list of key exchange traded funds (ETF) that
help investors track Biotech Index. For detailed view, check out our ETF Funds section of our website. Quick View: Move mouse or cursor over ETF symbol (ticker) to view short-term Technical chart and over ETF name to view long term chart. Click on ticker or stock name for detailed view. Click on to add stock symbol to your watchlist and to view watchlist. |
12Stocks.com List of ETFs that track Biotech Index
| Ticker | ETF Name | Watchlist | Recent Price | Market Intelligence Score | Change % | Week % | Year-to-date % |
| LABD | Biotech Bear 3X | | 9.69 | 35 | -7.89 | -7.89 | 0% |
| XBI | Biotech | | 85.52 | 49 | 2.43 | 2.43 | -4.22% |
| LABU | Biotech Bull 3X | | 94.11 | 42 | 7.54 | 7.54 | -22.84% |
| IBB | Biotechnology | | 128.37 | 42 | 1.49 | 1.49 | -5.51% |
| IYH | Healthcare | | 58.86 | 70 | 0.43 | 0.43 | 2.82% |
| IXJ | Global Healthcare | | 89.47 | 70 | 0.39 | 0.39 | 3.17% |
| BIB | Biotechnology | | 51.77 | 64 | 4.25 | 4.25 | -9.26% |
| IHF | Healthcare Providers | | 52.06 | 65 | 0.27 | 0.27 | -0.86% |
| CURE | Healthcare Bull 3X | | 106.25 | 39 | 0.90 | 0.9 | 4.43% |
| FBT | First NYSE | | 145.65 | 42 | 1.39 | 1.39 | -7.85% |
| BIS | Short Biotech | | 19.55 | 44 | -3.31 | -3.31 | 8.19% |
| PTH | DWA Healthcare Momentum | | 39.88 | 48 | -0.03 | -0.03 | 1.89% |
| PBE | Biotech & Genome | | 61.47 | 57 | 1.81 | 1.81 | -6.64% |
| BTEC | Principal Healthcare Innovators | | 34.84 | 42 | 1.72 | 1.72 | -4.1% |
| BBH | Biotech | | 157.37 | 49 | 1.10 | 1.1 | -4.81% |
| BBP | Bio Biotechnology Products | | 53.55 | 64 | 4.01 | 4.01 | -7.82% |
| BBC | Bio Biotechnology Clinical | | 26.25 | 75 | 2.82 | 2.82 | 7.35% |
| 12Stocks.com: Charts, Trends, Fundamental Data and Performances of Biotech Stocks | |
|
We now take in-depth look at all Biotech stocks including charts, multi-period performances and overall trends (as measured by market intelligence score). One can sort Biotech stocks (click link to choose) by Daily, Weekly and by Year-to-Date performances. Also, one can sort by size of the company or by market capitalization. |
| Select Your Default Chart Type: | |||||
| |||||
| Click on stock symbol or name for detailed view. Click on to add stock symbol to your watchlist and to view watchlist. Quick View: Move mouse or cursor over "Daily" to quickly view daily Technical stock chart and over "Weekly" to view weekly Technical stock chart. | |||||

 | FOLD Amicus Therapeutics, Inc. |
| Sector: Health Care | |
| SubSector: Biotechnology | |
| MarketCap: 2676.75 Millions | |
| Recent Price: 10.25 Market Intelligence Score: 27 | |
| Day Percent Change: -0.29% Day Change: -0.03 | |
| Week Change: -0.29% Year-to-date Change: -27.8% | |
| FOLD Links: Profile News Message Board | |
| Charts:- Daily , Weekly | |
| Add FOLD to Watchlist: View: Get Complete FOLD Trend Analysis ➞ | |
 | IVA Inventiva S.A. |
| Sector: Health Care | |
| SubSector: Biotechnology | |
| MarketCap: 46487 Millions | |
| Recent Price: 3.24 Market Intelligence Score: 10 | |
| Day Percent Change: -0.31% Day Change: -0.01 | |
| Week Change: -0.31% Year-to-date Change: -28.2% | |
| IVA Links: Profile News Message Board | |
| Charts:- Daily , Weekly | |
| Add IVA to Watchlist: View: Get Complete IVA Trend Analysis ➞ | |
 | VRTX Vertex Pharmaceuticals Incorporated |
| Sector: Health Care | |
| SubSector: Biotechnology | |
| MarketCap: 57669.6 Millions | |
| Recent Price: 396.20 Market Intelligence Score: 25 | |
| Day Percent Change: -0.32% Day Change: -1.28 | |
| Week Change: -0.32% Year-to-date Change: -2.6% | |
| VRTX Links: Profile News Message Board | |
| Charts:- Daily , Weekly | |
| Add VRTX to Watchlist: View: Get Complete VRTX Trend Analysis ➞ | |
 | XOMAO XOMA Corporation |
| Sector: Health Care | |
| SubSector: Biotechnology | |
| MarketCap: 217 Millions | |
| Recent Price: 24.89 Market Intelligence Score: 48 | |
| Day Percent Change: -0.32% Day Change: -0.08 | |
| Week Change: -0.32% Year-to-date Change: -0.4% | |
| XOMAO Links: Profile News Message Board | |
| Charts:- Daily , Weekly | |
| Add XOMAO to Watchlist: View: Get Complete XOMAO Trend Analysis ➞ | |
 | LEGN Legend Biotech Corporation |
| Sector: Health Care | |
| SubSector: Biotechnology | |
| MarketCap: 37387 Millions | |
| Recent Price: 45.14 Market Intelligence Score: 25 | |
| Day Percent Change: -0.35% Day Change: -0.16 | |
| Week Change: -0.35% Year-to-date Change: -25.2% | |
| LEGN Links: Profile News Message Board | |
| Charts:- Daily , Weekly | |
| Add LEGN to Watchlist: View: Get Complete LEGN Trend Analysis ➞ | |
 | MRNS Marinus Pharmaceuticals, Inc. |
| Sector: Health Care | |
| SubSector: Biotechnology | |
| MarketCap: 222.885 Millions | |
| Recent Price: 1.40 Market Intelligence Score: 24 | |
| Day Percent Change: -0.36% Day Change: -0.01 | |
| Week Change: -0.36% Year-to-date Change: -87.1% | |
| MRNS Links: Profile News Message Board | |
| Charts:- Daily , Weekly | |
| Add MRNS to Watchlist: View: Get Complete MRNS Trend Analysis ➞ | |
 | MORF Morphic Holding, Inc. |
| Sector: Health Care | |
| SubSector: Biotechnology | |
| MarketCap: 484.885 Millions | |
| Recent Price: 27.97 Market Intelligence Score: 32 | |
| Day Percent Change: -0.36% Day Change: -0.10 | |
| Week Change: -0.36% Year-to-date Change: -3.2% | |
| MORF Links: Profile News Message Board | |
| Charts:- Daily , Weekly | |
| Add MORF to Watchlist: View: Get Complete MORF Trend Analysis ➞ | |
 | GLPG Galapagos NV |
| Sector: Health Care | |
| SubSector: Biotechnology | |
| MarketCap: 9541.55 Millions | |
| Recent Price: 28.65 Market Intelligence Score: 35 | |
| Day Percent Change: -0.38% Day Change: -0.11 | |
| Week Change: -0.38% Year-to-date Change: -29.5% | |
| GLPG Links: Profile News Message Board | |
| Charts:- Daily , Weekly | |
| Add GLPG to Watchlist: View: Get Complete GLPG Trend Analysis ➞ | |
 | BDTX Black Diamond Therapeutics, Inc. |
| Sector: Health Care | |
| SubSector: Biotechnology | |
| MarketCap: 12587 Millions | |
| Recent Price: 5.87 Market Intelligence Score: 85 | |
| Day Percent Change: -0.42% Day Change: -0.02 | |
| Week Change: -0.42% Year-to-date Change: 108.7% | |
| BDTX Links: Profile News Message Board | |
| Charts:- Daily , Weekly | |
| Add BDTX to Watchlist: View: Get Complete BDTX Trend Analysis ➞ | |
 | GLTO Galecto, Inc. |
| Sector: Health Care | |
| SubSector: Biotechnology | |
| MarketCap: 34487 Millions | |
| Recent Price: 0.70 Market Intelligence Score: 85 | |
| Day Percent Change: -0.44% Day Change: 0.00 | |
| Week Change: -0.44% Year-to-date Change: -2.5% | |
| GLTO Links: Profile News Message Board | |
| Charts:- Daily , Weekly | |
| Add GLTO to Watchlist: View: Get Complete GLTO Trend Analysis ➞ | |
 | INZY Inozyme Pharma, Inc. |
| Sector: Health Care | |
| SubSector: Biotechnology | |
| MarketCap: 53487 Millions | |
| Recent Price: 4.42 Market Intelligence Score: 32 | |
| Day Percent Change: -0.45% Day Change: -0.02 | |
| Week Change: -0.45% Year-to-date Change: 3.9% | |
| INZY Links: Profile News Message Board | |
| Charts:- Daily , Weekly | |
| Add INZY to Watchlist: View: Get Complete INZY Trend Analysis ➞ | |
 | RARE Ultragenyx Pharmaceutical Inc. |
| Sector: Health Care | |
| SubSector: Biotechnology | |
| MarketCap: 2373.35 Millions | |
| Recent Price: 44.02 Market Intelligence Score: 80 | |
| Day Percent Change: -0.50% Day Change: -0.22 | |
| Week Change: -0.5% Year-to-date Change: -8.0% | |
| RARE Links: Profile News Message Board | |
| Charts:- Daily , Weekly | |
| Add RARE to Watchlist: View: Get Complete RARE Trend Analysis ➞ | |
 | RCKT Rocket Pharmaceuticals, Inc. |
| Sector: Health Care | |
| SubSector: Biotechnology | |
| MarketCap: 899.585 Millions | |
| Recent Price: 21.85 Market Intelligence Score: 10 | |
| Day Percent Change: -0.59% Day Change: -0.13 | |
| Week Change: -0.59% Year-to-date Change: -27.1% | |
| RCKT Links: Profile News Message Board | |
| Charts:- Daily , Weekly | |
| Add RCKT to Watchlist: View: Get Complete RCKT Trend Analysis ➞ | |
 | AKRO Akero Therapeutics, Inc. |
| Sector: Health Care | |
| SubSector: Biotechnology | |
| MarketCap: 675.085 Millions | |
| Recent Price: 19.62 Market Intelligence Score: 27 | |
| Day Percent Change: -0.61% Day Change: -0.12 | |
| Week Change: -0.61% Year-to-date Change: -16.0% | |
| AKRO Links: Profile News Message Board | |
| Charts:- Daily , Weekly | |
| Add AKRO to Watchlist: View: Get Complete AKRO Trend Analysis ➞ | |
 | OMER Omeros Corporation |
| Sector: Health Care | |
| SubSector: Biotechnology | |
| MarketCap: 759.585 Millions | |
| Recent Price: 3.13 Market Intelligence Score: 49 | |
| Day Percent Change: -0.63% Day Change: -0.02 | |
| Week Change: -0.63% Year-to-date Change: -4.3% | |
| OMER Links: Profile News Message Board | |
| Charts:- Daily , Weekly | |
| Add OMER to Watchlist: View: Get Complete OMER Trend Analysis ➞ | |
 | IMCR Immunocore Holdings plc |
| Sector: Health Care | |
| SubSector: Biotechnology | |
| MarketCap: 2830 Millions | |
| Recent Price: 58.10 Market Intelligence Score: 57 | |
| Day Percent Change: -0.70% Day Change: -0.41 | |
| Week Change: -0.7% Year-to-date Change: -14.4% | |
| IMCR Links: Profile News Message Board | |
| Charts:- Daily , Weekly | |
| Add IMCR to Watchlist: View: Get Complete IMCR Trend Analysis ➞ | |
 | PGEN Precigen, Inc. |
| Sector: Health Care | |
| SubSector: Biotechnology | |
| MarketCap: 564.785 Millions | |
| Recent Price: 1.40 Market Intelligence Score: 80 | |
| Day Percent Change: -0.71% Day Change: -0.01 | |
| Week Change: -0.71% Year-to-date Change: 4.5% | |
| PGEN Links: Profile News Message Board | |
| Charts:- Daily , Weekly | |
| Add PGEN to Watchlist: View: Get Complete PGEN Trend Analysis ➞ | |
 | FENC Fennec Pharmaceuticals Inc. |
| Sector: Health Care | |
| SubSector: Biotechnology | |
| MarketCap: 126.785 Millions | |
| Recent Price: 9.14 Market Intelligence Score: 32 | |
| Day Percent Change: -0.76% Day Change: -0.07 | |
| Week Change: -0.76% Year-to-date Change: -18.5% | |
| FENC Links: Profile News Message Board | |
| Charts:- Daily , Weekly | |
| Add FENC to Watchlist: View: Get Complete FENC Trend Analysis ➞ | |
 | URGN UroGen Pharma Ltd. |
| Sector: Health Care | |
| SubSector: Biotechnology | |
| MarketCap: 373.485 Millions | |
| Recent Price: 14.04 Market Intelligence Score: 30 | |
| Day Percent Change: -0.78% Day Change: -0.11 | |
| Week Change: -0.78% Year-to-date Change: -6.4% | |
| URGN Links: Profile News Message Board | |
| Charts:- Daily , Weekly | |
| Add URGN to Watchlist: View: Get Complete URGN Trend Analysis ➞ | |
 | FULC Fulcrum Therapeutics, Inc. |
| Sector: Health Care | |
| SubSector: Biotechnology | |
| MarketCap: 274.785 Millions | |
| Recent Price: 7.08 Market Intelligence Score: 23 | |
| Day Percent Change: -0.84% Day Change: -0.06 | |
| Week Change: -0.84% Year-to-date Change: 4.9% | |
| FULC Links: Profile News Message Board | |
| Charts:- Daily , Weekly | |
| Add FULC to Watchlist: View: Get Complete FULC Trend Analysis ➞ | |
 | RGNX REGENXBIO Inc. |
| Sector: Health Care | |
| SubSector: Biotechnology | |
| MarketCap: 1232.85 Millions | |
| Recent Price: 16.05 Market Intelligence Score: 65 | |
| Day Percent Change: -0.86% Day Change: -0.14 | |
| Week Change: -0.86% Year-to-date Change: -10.6% | |
| RGNX Links: Profile News Message Board | |
| Charts:- Daily , Weekly | |
| Add RGNX to Watchlist: View: Get Complete RGNX Trend Analysis ➞ | |
 | TRDA Entrada Therapeutics, Inc. |
| Sector: Health Care | |
| SubSector: Biotechnology | |
| MarketCap: 481 Millions | |
| Recent Price: 12.34 Market Intelligence Score: 10 | |
| Day Percent Change: -0.88% Day Change: -0.11 | |
| Week Change: -0.88% Year-to-date Change: -24.8% | |
| TRDA Links: Profile News Message Board | |
| Charts:- Daily , Weekly | |
| Add TRDA to Watchlist: View: Get Complete TRDA Trend Analysis ➞ | |
 | GRTS Gritstone Oncology, Inc. |
| Sector: Health Care | |
| SubSector: Biotechnology | |
| MarketCap: 240.085 Millions | |
| Recent Price: 0.81 Market Intelligence Score: 42 | |
| Day Percent Change: -0.90% Day Change: -0.01 | |
| Week Change: -0.9% Year-to-date Change: -60.5% | |
| GRTS Links: Profile News Message Board | |
| Charts:- Daily , Weekly | |
| Add GRTS to Watchlist: View: Get Complete GRTS Trend Analysis ➞ | |
 | TGTX TG Therapeutics, Inc. |
| Sector: Health Care | |
| SubSector: Biotechnology | |
| MarketCap: 1022.85 Millions | |
| Recent Price: 13.32 Market Intelligence Score: 0 | |
| Day Percent Change: -1.11% Day Change: -0.15 | |
| Week Change: -1.11% Year-to-date Change: -22.0% | |
| TGTX Links: Profile News Message Board | |
| Charts:- Daily , Weekly | |
| Add TGTX to Watchlist: View: Get Complete TGTX Trend Analysis ➞ | |
 | NERV Minerva Neurosciences, Inc. |
| Sector: Health Care | |
| SubSector: Biotechnology | |
| MarketCap: 223.385 Millions | |
| Recent Price: 2.41 Market Intelligence Score: 10 | |
| Day Percent Change: -1.11% Day Change: -0.03 | |
| Week Change: -1.11% Year-to-date Change: -60.8% | |
| NERV Links: Profile News Message Board | |
| Charts:- Daily , Weekly | |
| Add NERV to Watchlist: View: Get Complete NERV Trend Analysis ➞ | |
| To view more stocks, click on Next / Previous arrows or select different range: 0 - 25 , 25 - 50 , 50 - 75 , 75 - 100 , 100 - 125 , 125 - 150 , 150 - 175 , 175 - 200 , 200 - 225 , 225 - 250 , 250 - 275 , 275 - 300 , 300 - 325 , 325 - 350 , 350 - 375 , 375 - 400 | ||
| Click To Change The Sort Order: By Market Cap or Company Size Performance: Year-to-date, Week and Day | |
| Select Chart Type: | ||
|
Best Stocks Today 12Stocks.com |
© 2024 12Stocks.com Terms & Conditions Privacy Contact Us
All Information Provided Only For Education And Not To Be Used For Investing or Trading. See Terms & Conditions


One More Thing ... Get Best Stocks Delivered Daily!
Never Ever Miss A Move With Our Top Ten Stocks Lists
Find Best Stocks In Any Market - Bull or Bear Market
Take A Peek At Our Top Ten Stocks Lists: Daily, Weekly, Year-to-Date & Top Trends
Find Best Stocks In Any Market - Bull or Bear Market
Take A Peek At Our Top Ten Stocks Lists: Daily, Weekly, Year-to-Date & Top Trends
Biotech Stocks With Best Up Trends [0-bearish to 100-bullish]: Deciphera [100], Mesoblast [100], PTC [100], Agenus [100], Cullinan Oncology[100], Xencor [100], Zura Bio[100], Verrica [100], Agios [100], Shattuck Labs[100], Moderna [100]
Best Biotech Stocks Year-to-Date:
Pieris [6334.07%], Avenue [2707.45%], Precision [2595.89%], Inovio [2154.9%], Assembly [1472.98%], Agenus [1441.25%], NuCana [1252.27%], Adverum nologies[1165.94%], Affimed N.V[778.4%], Mesoblast [545.45%], Corbus [490.07%] Best Biotech Stocks This Week:
Deciphera [72.56%], Vaxxinity [31.65%], Acrivon [18.2%], Janux [18.18%], Ocean Biomedical[17.16%], Ginkgo Bioworks[15.08%], Codexis [14.66%], Exscientia [14.5%], Mesoblast [13.78%], PTC [12.5%], Nektar [10.61%] Best Biotech Stocks Daily:
Deciphera [72.56%], Vaxxinity [31.65%], Acrivon [18.20%], Janux [18.18%], Ocean Biomedical[17.16%], Ginkgo Bioworks[15.08%], Codexis [14.66%], Exscientia [14.50%], Mesoblast [13.78%], PTC [12.50%], Nektar [10.61%]