
 Login Sign Up


| |||||
 |  | ||||

| 12Stocks.com Market Intelligence |
Best Biotech Stocks
|
|
| Quick Read: Best Biotech Stocks List By Performances & Trends: Daily, Weekly, Year-to-Date, Market Cap (Size) & Technical Trends | |||
| Best Biotech Stocks Views: Quick Browse View, Summary & Slide Show View | |||
| 12Stocks.com Biotech Stocks Performances & Trends Daily | |||||||||
|
|  The overall market intelligence score is 25 (0-bearish to 100-bullish) which puts Biotech sector in short term bearish to neutral trend. The market intelligence score from previous trading session is 32 and hence a deterioration of trend.
| ||||||||
Here are the market intelligence trend scores of the most requested Biotech stocks at 12Stocks.com (click stock name for detailed review):
|


| 12Stocks.com: Investing in Biotech sector with Stocks | |
|
The following table helps investors and traders sort through current performance and trends (as measured by market intelligence score) of various
stocks in the Biotech sector. Quick View: Move mouse or cursor over stock symbol (ticker) to view short-term Technical chart and over stock name to view long term chart. Click on  to add stock symbol to your watchlist and to add stock symbol to your watchlist and  to view watchlist. Click on any ticker or stock name for detailed market intelligence report for that stock. to view watchlist. Click on any ticker or stock name for detailed market intelligence report for that stock. |
12Stocks.com Performance of Stocks in Biotech Sector
| Ticker | Stock Name | Watchlist | Category | Recent Price | Market Intelligence Score | Change % | Weekly Change% |
| ITOS | iTeos |   | Biotechnology | 10.58 | 61 | -3.73% | 3.27% |
| HUMA | Humacyte | | Biotechnology | 3.82 | 81 | -2.68% | 3.24% |
| TRDA | Entrada | | Biotechnology | 12.54 | 35 | -2.34% | 3.21% |
| AMLX | Amylyx | | Biotechnology | 1.93 | 15 | -0.77% | 3.21% |
| CERT | Certara | | Biotechnology | 16.43 | 61 | -1.59% | 3.17% |
| ACLX | Arcellx | | Biotechnology | 53.27 | 18 | -2.13% | 3.14% |
| URGN | UroGen Pharma | | Biotechnology | 14.21 | 50 | -2.20% | 3.12% |
| RLAY | Relay | | Biotechnology | 6.34 | 7 | 7.46% | 3.09% |
| ADMA | ADMA Biologics | | Biotechnology | 6.46 | 90 | -1.22% | 3.03% |
| AXON | Axovant | | Biotechnology | 302.41 | 58 | 0.28% | 3.00% |
| ALEC | Alector | | Biotechnology | 5.25 | 10 | -1.69% | 2.94% |
| OLMA | Olema | | Biotechnology | 10.15 | 42 | 1.50% | 2.94% |
| BMRN | BioMarin | | Biotechnology | 91.20 | 90 | -0.93% | 2.90% |
| WVE | Wave Life | | Biotechnology | 5.01 | 58 | -1.38% | 2.87% |
| NVO | Novo Nordisk | | Biotechnology | 126.16 | 71 | -1.93% | 2.81% |
| XFOR | X4 | | Biotechnology | 1.29 | 56 | 4.88% | 2.79% |
| VKTX | Viking | | Biotechnology | 65.07 | 56 | 0.22% | 2.60% |
| SMMT | Summit | | Biotechnology | 3.59 | 44 | -3.75% | 2.57% |
| KMDA | Kamada | | Biotechnology | 5.18 | 42 | 1.77% | 2.57% |
| BCLI | Brainstorm Cell | | Biotechnology | 0.55 | 61 | 3.81% | 2.44% |
| VCYT | Veracyte | | Biotechnology | 19.90 | 42 | 0.35% | 2.31% |
| FBIO | Fortress | | Biotechnology | 1.79 | 20 | -0.56% | 2.29% |
| TECH | Bio-Techne | | Biotechnology | 63.52 | 35 | -0.27% | 2.25% |
| AMRN | Amarin | | Biotechnology | 0.88 | 47 | -0.53% | 2.25% |
| RGNX | REGENXBIO | | Biotechnology | 16.04 | 43 | 0.88% | 2.23% |
| To view more stocks, click on Next / Previous arrows or select different range: 0 - 25 , 25 - 50 , 50 - 75 , 75 - 100 , 100 - 125 , 125 - 150 , 150 - 175 , 175 - 200 , 200 - 225 , 225 - 250 , 250 - 275 , 275 - 300 , 300 - 325 , 325 - 350 , 350 - 375 , 375 - 400 | ||
 | Click To Change The Sort Order: By Market Cap or Company Size Performance: Year-to-date, Week and Day |  |
|
Get the most comprehensive stock market coverage daily at 12Stocks.com ➞ Best Stocks Today ➞ Best Stocks Weekly ➞ Best Stocks Year-to-Date ➞ Best Stocks Trends ➞  Best Stocks Today 12Stocks.com Best Nasdaq Stocks ➞ Best S&P 500 Stocks ➞ Best Tech Stocks ➞ Best Biotech Stocks ➞ |
| Detailed Overview of Biotech Stocks |
| Biotech Technical Overview, Leaders & Laggards, Top Biotech ETF Funds & Detailed Biotech Stocks List, Charts, Trends & More |
| Biotech Sector: Technical Analysis, Trends & YTD Performance | |
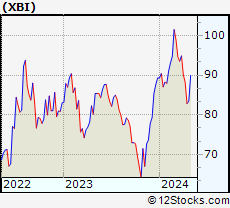
| Biotech sector, as represented by XBI, an exchange-traded fund [ETF] that holds basket of Biotech stocks (e.g, Amgen, Celgene) is down by -5.99% and is currently underperforming the overall market by -11.65% year-to-date. Below is a quick view of Technical charts and trends: | |
 XBI Weekly Chart |
|
| Long Term Trend: Not Good | |
| Medium Term Trend: Not Good | |
 XBI Daily Chart |
|
| Short Term Trend: Very Good | |
| Overall Trend Score: 25 | |
| YTD Performance: -5.99% | |
| **Trend Scores & Views Are Only For Educational Purposes And Not For Investing | |
| 12Stocks.com: Top Performing Biotech Sector Stocks | ||||||||||||||||||||||||||||||||||||||||||||||||
 The top performing Biotech sector stocks year to date are
Now, more recently, over last week, the top performing Biotech sector stocks on the move are


|
||||||||||||||||||||||||||||||||||||||||||||||||
| 12Stocks.com: Investing in Biotech Sector using Exchange Traded Funds | |
|
The following table shows list of key exchange traded funds (ETF) that
help investors track Biotech Index. For detailed view, check out our ETF Funds section of our website. Quick View: Move mouse or cursor over ETF symbol (ticker) to view short-term Technical chart and over ETF name to view long term chart. Click on ticker or stock name for detailed view. Click on to add stock symbol to your watchlist and to view watchlist. |
12Stocks.com List of ETFs that track Biotech Index
| Ticker | ETF Name | Watchlist | Recent Price | Market Intelligence Score | Change % | Week % | Year-to-date % |
| LABD | Biotech Bear 3X | | 10.37 | 75 | 2.98 | -3.98 | 7.02% |
| XBI | Biotech | | 83.94 | 25 | -0.89 | 1.34 | -5.99% |
| LABU | Biotech Bull 3X | | 89.40 | 25 | -2.80 | 3.89 | -26.7% |
| IBB | Biotechnology | | 127.76 | 32 | -0.20 | 2.44 | -5.96% |
| IYH | Healthcare | | 59.09 | 45 | -0.20 | 1.6 | 3.22% |
| IXJ | Global Healthcare | | 89.31 | 45 | -0.35 | 1.78 | 2.99% |
| IHF | Healthcare Providers | | 52.26 | 55 | -0.11 | 0.1 | -0.48% |
| CURE | Healthcare Bull 3X | | 107.85 | 32 | -0.25 | 4.37 | 6.01% |
| FBT | First NYSE | | 145.40 | 25 | 0.05 | 2.62 | -8.01% |
| BIB | Biotechnology | | 50.18 | 32 | -0.30 | 4.11 | -12.04% |
| BIS | Short Biotech | | 20.09 | 61 | 0.75 | -3.85 | 11.18% |
| BBH | Biotech | | 157.33 | 49 | 0.03 | 3.26 | -4.83% |
| PBE | Biotech & Genome | | 60.88 | 32 | -0.43 | 1.72 | -7.53% |
| PTH | DWA Healthcare Momentum | | 39.63 | 46 | -1.34 | 0.25 | 1.25% |
| BTEC | Principal Healthcare Innovators | | 34.20 | 18 | -1.73 | 1.02 | -5.85% |
| BBP | Bio Biotechnology Products | | 52.40 | 20 | 0.02 | 3.91 | -9.8% |
| BBC | Bio Biotechnology Clinical | | 25.63 | 36 | -0.17 | 3.71 | 4.81% |
| 12Stocks.com: Charts, Trends, Fundamental Data and Performances of Biotech Stocks | |
|
We now take in-depth look at all Biotech stocks including charts, multi-period performances and overall trends (as measured by market intelligence score). One can sort Biotech stocks (click link to choose) by Daily, Weekly and by Year-to-Date performances. Also, one can sort by size of the company or by market capitalization. |
| Select Your Default Chart Type: | |||||
| |||||
| Click on stock symbol or name for detailed view. Click on to add stock symbol to your watchlist and to view watchlist. Quick View: Move mouse or cursor over "Daily" to quickly view daily Technical stock chart and over "Weekly" to view weekly Technical stock chart. | |||||

 | ITOS iTeos Therapeutics, Inc. |
| Sector: Health Care | |
| SubSector: Biotechnology | |
| MarketCap: 10487 Millions | |
| Recent Price: 10.58 Market Intelligence Score: 61 | |
| Day Percent Change: -3.73% Day Change: -0.41 | |
| Week Change: 3.27% Year-to-date Change: -3.3% | |
| ITOS Links: Profile News Message Board | |
| Charts:- Daily , Weekly | |
| Add ITOS to Watchlist: View: Get Complete ITOS Trend Analysis ➞ | |
 | HUMA Humacyte, Inc. |
| Sector: Health Care | |
| SubSector: Biotechnology | |
| MarketCap: 297 Millions | |
| Recent Price: 3.82 Market Intelligence Score: 81 | |
| Day Percent Change: -2.68% Day Change: -0.10 | |
| Week Change: 3.24% Year-to-date Change: 34.5% | |
| HUMA Links: Profile News Message Board | |
| Charts:- Daily , Weekly | |
| Add HUMA to Watchlist: View: Get Complete HUMA Trend Analysis ➞ | |
 | TRDA Entrada Therapeutics, Inc. |
| Sector: Health Care | |
| SubSector: Biotechnology | |
| MarketCap: 481 Millions | |
| Recent Price: 12.54 Market Intelligence Score: 35 | |
| Day Percent Change: -2.34% Day Change: -0.30 | |
| Week Change: 3.21% Year-to-date Change: -23.6% | |
| TRDA Links: Profile News Message Board | |
| Charts:- Daily , Weekly | |
| Add TRDA to Watchlist: View: Get Complete TRDA Trend Analysis ➞ | |
 | AMLX Amylyx Pharmaceuticals, Inc. |
| Sector: Health Care | |
| SubSector: Biotechnology | |
| MarketCap: 1500 Millions | |
| Recent Price: 1.93 Market Intelligence Score: 15 | |
| Day Percent Change: -0.77% Day Change: -0.02 | |
| Week Change: 3.21% Year-to-date Change: -86.7% | |
| AMLX Links: Profile News Message Board | |
| Charts:- Daily , Weekly | |
| Add AMLX to Watchlist: View: Get Complete AMLX Trend Analysis ➞ | |
 | CERT Certara, Inc. |
| Sector: Health Care | |
| SubSector: Biotechnology | |
| MarketCap: 21487 Millions | |
| Recent Price: 16.43 Market Intelligence Score: 61 | |
| Day Percent Change: -1.59% Day Change: -0.27 | |
| Week Change: 3.17% Year-to-date Change: -6.6% | |
| CERT Links: Profile News Message Board | |
| Charts:- Daily , Weekly | |
| Add CERT to Watchlist: View: Get Complete CERT Trend Analysis ➞ | |
 | ACLX Arcellx, Inc. |
| Sector: Health Care | |
| SubSector: Biotechnology | |
| MarketCap: 1530 Millions | |
| Recent Price: 53.27 Market Intelligence Score: 18 | |
| Day Percent Change: -2.13% Day Change: -1.16 | |
| Week Change: 3.14% Year-to-date Change: -4.5% | |
| ACLX Links: Profile News Message Board | |
| Charts:- Daily , Weekly | |
| Add ACLX to Watchlist: View: Get Complete ACLX Trend Analysis ➞ | |
 | URGN UroGen Pharma Ltd. |
| Sector: Health Care | |
| SubSector: Biotechnology | |
| MarketCap: 373.485 Millions | |
| Recent Price: 14.21 Market Intelligence Score: 50 | |
| Day Percent Change: -2.20% Day Change: -0.32 | |
| Week Change: 3.12% Year-to-date Change: -5.3% | |
| URGN Links: Profile News Message Board | |
| Charts:- Daily , Weekly | |
| Add URGN to Watchlist: View: Get Complete URGN Trend Analysis ➞ | |
 | RLAY Relay Therapeutics, Inc. |
| Sector: Health Care | |
| SubSector: Biotechnology | |
| MarketCap: 45887 Millions | |
| Recent Price: 6.34 Market Intelligence Score: 7 | |
| Day Percent Change: 7.46% Day Change: 0.44 | |
| Week Change: 3.09% Year-to-date Change: -42.4% | |
| RLAY Links: Profile News Message Board | |
| Charts:- Daily , Weekly | |
| Add RLAY to Watchlist: View: Get Complete RLAY Trend Analysis ➞ | |
 | ADMA ADMA Biologics, Inc. |
| Sector: Health Care | |
| SubSector: Biotechnology | |
| MarketCap: 204.985 Millions | |
| Recent Price: 6.46 Market Intelligence Score: 90 | |
| Day Percent Change: -1.22% Day Change: -0.08 | |
| Week Change: 3.03% Year-to-date Change: 42.9% | |
| ADMA Links: Profile News Message Board | |
| Charts:- Daily , Weekly | |
| Add ADMA to Watchlist: View: Get Complete ADMA Trend Analysis ➞ | |
 | AXON Axovant Sciences Ltd. |
| Sector: Health Care | |
| SubSector: Biotechnology | |
| MarketCap: 1492.04 Millions | |
| Recent Price: 302.41 Market Intelligence Score: 58 | |
| Day Percent Change: 0.28% Day Change: 0.85 | |
| Week Change: 3% Year-to-date Change: 17.1% | |
| AXON Links: Profile News Message Board | |
| Charts:- Daily , Weekly | |
| Add AXON to Watchlist: View: Get Complete AXON Trend Analysis ➞ | |
 | ALEC Alector, Inc. |
| Sector: Health Care | |
| SubSector: Biotechnology | |
| MarketCap: 2719.35 Millions | |
| Recent Price: 5.25 Market Intelligence Score: 10 | |
| Day Percent Change: -1.69% Day Change: -0.09 | |
| Week Change: 2.94% Year-to-date Change: -34.2% | |
| ALEC Links: Profile News Message Board | |
| Charts:- Daily , Weekly | |
| Add ALEC to Watchlist: View: Get Complete ALEC Trend Analysis ➞ | |
 | OLMA Olema Pharmaceuticals, Inc. |
| Sector: Health Care | |
| SubSector: Biotechnology | |
| MarketCap: 17687 Millions | |
| Recent Price: 10.15 Market Intelligence Score: 42 | |
| Day Percent Change: 1.50% Day Change: 0.15 | |
| Week Change: 2.94% Year-to-date Change: -27.8% | |
| OLMA Links: Profile News Message Board | |
| Charts:- Daily , Weekly | |
| Add OLMA to Watchlist: View: Get Complete OLMA Trend Analysis ➞ | |
 | BMRN BioMarin Pharmaceutical Inc. |
| Sector: Health Care | |
| SubSector: Biotechnology | |
| MarketCap: 14887.5 Millions | |
| Recent Price: 91.20 Market Intelligence Score: 90 | |
| Day Percent Change: -0.93% Day Change: -0.86 | |
| Week Change: 2.9% Year-to-date Change: -5.4% | |
| BMRN Links: Profile News Message Board | |
| Charts:- Daily , Weekly | |
| Add BMRN to Watchlist: View: Get Complete BMRN Trend Analysis ➞ | |
 | WVE Wave Life Sciences Ltd. |
| Sector: Health Care | |
| SubSector: Biotechnology | |
| MarketCap: 452.785 Millions | |
| Recent Price: 5.01 Market Intelligence Score: 58 | |
| Day Percent Change: -1.38% Day Change: -0.07 | |
| Week Change: 2.87% Year-to-date Change: -0.8% | |
| WVE Links: Profile News Message Board | |
| Charts:- Daily , Weekly | |
| Add WVE to Watchlist: View: Get Complete WVE Trend Analysis ➞ | |
 | NVO Novo Nordisk A/S |
| Sector: Health Care | |
| SubSector: Biotechnology | |
| MarketCap: 100744 Millions | |
| Recent Price: 126.16 Market Intelligence Score: 71 | |
| Day Percent Change: -1.93% Day Change: -2.48 | |
| Week Change: 2.81% Year-to-date Change: 22.0% | |
| NVO Links: Profile News Message Board | |
| Charts:- Daily , Weekly | |
| Add NVO to Watchlist: View: Get Complete NVO Trend Analysis ➞ | |
 | XFOR X4 Pharmaceuticals, Inc. |
| Sector: Health Care | |
| SubSector: Biotechnology | |
| MarketCap: 143.385 Millions | |
| Recent Price: 1.29 Market Intelligence Score: 56 | |
| Day Percent Change: 4.88% Day Change: 0.06 | |
| Week Change: 2.79% Year-to-date Change: 53.9% | |
| XFOR Links: Profile News Message Board | |
| Charts:- Daily , Weekly | |
| Add XFOR to Watchlist: View: Get Complete XFOR Trend Analysis ➞ | |
 | VKTX Viking Therapeutics, Inc. |
| Sector: Health Care | |
| SubSector: Biotechnology | |
| MarketCap: 388.585 Millions | |
| Recent Price: 65.07 Market Intelligence Score: 56 | |
| Day Percent Change: 0.22% Day Change: 0.14 | |
| Week Change: 2.6% Year-to-date Change: 249.7% | |
| VKTX Links: Profile News Message Board | |
| Charts:- Daily , Weekly | |
| Add VKTX to Watchlist: View: Get Complete VKTX Trend Analysis ➞ | |
 | SMMT Summit Therapeutics plc |
| Sector: Health Care | |
| SubSector: Biotechnology | |
| MarketCap: 156.985 Millions | |
| Recent Price: 3.59 Market Intelligence Score: 44 | |
| Day Percent Change: -3.75% Day Change: -0.14 | |
| Week Change: 2.57% Year-to-date Change: 37.6% | |
| SMMT Links: Profile News Message Board | |
| Charts:- Daily , Weekly | |
| Add SMMT to Watchlist: View: Get Complete SMMT Trend Analysis ➞ | |
 | KMDA Kamada Ltd. |
| Sector: Health Care | |
| SubSector: Biotechnology | |
| MarketCap: 238.685 Millions | |
| Recent Price: 5.18 Market Intelligence Score: 42 | |
| Day Percent Change: 1.77% Day Change: 0.09 | |
| Week Change: 2.57% Year-to-date Change: -15.4% | |
| KMDA Links: Profile News Message Board | |
| Charts:- Daily , Weekly | |
| Add KMDA to Watchlist: View: Get Complete KMDA Trend Analysis ➞ | |
 | BCLI Brainstorm Cell Therapeutics Inc. |
| Sector: Health Care | |
| SubSector: Biotechnology | |
| MarketCap: 141.285 Millions | |
| Recent Price: 0.55 Market Intelligence Score: 61 | |
| Day Percent Change: 3.81% Day Change: 0.02 | |
| Week Change: 2.44% Year-to-date Change: 99.6% | |
| BCLI Links: Profile News Message Board | |
| Charts:- Daily , Weekly | |
| Add BCLI to Watchlist: View: Get Complete BCLI Trend Analysis ➞ | |
 | VCYT Veracyte, Inc. |
| Sector: Health Care | |
| SubSector: Biotechnology | |
| MarketCap: 1089.05 Millions | |
| Recent Price: 19.90 Market Intelligence Score: 42 | |
| Day Percent Change: 0.35% Day Change: 0.07 | |
| Week Change: 2.31% Year-to-date Change: -27.7% | |
| VCYT Links: Profile News Message Board | |
| Charts:- Daily , Weekly | |
| Add VCYT to Watchlist: View: Get Complete VCYT Trend Analysis ➞ | |
 | FBIO Fortress Biotech, Inc. |
| Sector: Health Care | |
| SubSector: Biotechnology | |
| MarketCap: 116.885 Millions | |
| Recent Price: 1.79 Market Intelligence Score: 20 | |
| Day Percent Change: -0.56% Day Change: -0.01 | |
| Week Change: 2.29% Year-to-date Change: -40.5% | |
| FBIO Links: Profile News Message Board | |
| Charts:- Daily , Weekly | |
| Add FBIO to Watchlist: View: Get Complete FBIO Trend Analysis ➞ | |
 | TECH Bio-Techne Corporation |
| Sector: Health Care | |
| SubSector: Biotechnology | |
| MarketCap: 6958.05 Millions | |
| Recent Price: 63.52 Market Intelligence Score: 35 | |
| Day Percent Change: -0.27% Day Change: -0.17 | |
| Week Change: 2.25% Year-to-date Change: -17.7% | |
| TECH Links: Profile News Message Board | |
| Charts:- Daily , Weekly | |
| Add TECH to Watchlist: View: Get Complete TECH Trend Analysis ➞ | |
 | AMRN Amarin Corporation plc |
| Sector: Health Care | |
| SubSector: Biotechnology | |
| MarketCap: 4197.45 Millions | |
| Recent Price: 0.88 Market Intelligence Score: 47 | |
| Day Percent Change: -0.53% Day Change: 0.00 | |
| Week Change: 2.25% Year-to-date Change: 1.0% | |
| AMRN Links: Profile News Message Board | |
| Charts:- Daily , Weekly | |
| Add AMRN to Watchlist: View: Get Complete AMRN Trend Analysis ➞ | |
 | RGNX REGENXBIO Inc. |
| Sector: Health Care | |
| SubSector: Biotechnology | |
| MarketCap: 1232.85 Millions | |
| Recent Price: 16.04 Market Intelligence Score: 43 | |
| Day Percent Change: 0.88% Day Change: 0.14 | |
| Week Change: 2.23% Year-to-date Change: -10.6% | |
| RGNX Links: Profile News Message Board | |
| Charts:- Daily , Weekly | |
| Add RGNX to Watchlist: View: Get Complete RGNX Trend Analysis ➞ | |
| To view more stocks, click on Next / Previous arrows or select different range: 0 - 25 , 25 - 50 , 50 - 75 , 75 - 100 , 100 - 125 , 125 - 150 , 150 - 175 , 175 - 200 , 200 - 225 , 225 - 250 , 250 - 275 , 275 - 300 , 300 - 325 , 325 - 350 , 350 - 375 , 375 - 400 | ||
| Click To Change The Sort Order: By Market Cap or Company Size Performance: Year-to-date, Week and Day | |
| Select Chart Type: | ||
|
Best Stocks Today 12Stocks.com |
© 2024 12Stocks.com Terms & Conditions Privacy Contact Us
All Information Provided Only For Education And Not To Be Used For Investing or Trading. See Terms & Conditions


One More Thing ... Get Best Stocks Delivered Daily!
Never Ever Miss A Move With Our Top Ten Stocks Lists
Find Best Stocks In Any Market - Bull or Bear Market
Take A Peek At Our Top Ten Stocks Lists: Daily, Weekly, Year-to-Date & Top Trends
Find Best Stocks In Any Market - Bull or Bear Market
Take A Peek At Our Top Ten Stocks Lists: Daily, Weekly, Year-to-Date & Top Trends
Biotech Stocks With Best Up Trends [0-bearish to 100-bullish]: Annovis Bio[100], PureTech Health[100], Agios [100], Pieris [100], Avadel [100], Agenus [95], Mesoblast [95], AlloVir [95], Day One[93], Exelixis [90], Avidity [90]
Best Biotech Stocks Year-to-Date:
Pieris [6427.47%], Precision [2590.41%], Inovio [1892.16%], Assembly [1543.7%], Adverum nologies[1253.61%], NuCana [1198.17%], Agenus [796.24%], Affimed N.V[680.8%], Corbus [488.41%], Mesoblast [465.45%], Janux [352.07%] Best Biotech Stocks This Week:
Pieris [8093.1%], Agenus [39.74%], BeyondSpring [35%], Seres [30.29%], Annovis Bio[27.4%], ProKidney [23.28%], Cullinan Oncology[20.69%], Mesoblast [19.39%], Molecular Partners[16.87%], HOOKIPA Pharma[16.17%], Longboard [13.3%] Best Biotech Stocks Daily:
Agenus [14.86%], Cullinan Oncology[13.55%], HOOKIPA Pharma[11.11%], Gritstone Oncology[10.06%], Sage [8.11%], Relay [7.46%], Annovis Bio[7.24%], BeyondSpring [6.11%], Sarepta [6.09%], Molecular Templates[5.81%], Vigil Neuroscience[5.66%]