
 Login Sign Up


| |||||
 |  | ||||

| 12Stocks.com Market Intelligence |
Best Biotech Stocks
|
|
| Quick Read: Best Biotech Stocks List By Performances & Trends: Daily, Weekly, Year-to-Date, Market Cap (Size) & Technical Trends | |||
| Best Biotech Stocks Views: Quick Browse View, Summary & Slide Show View | |||
| 12Stocks.com Biotech Stocks Performances & Trends Daily | |||||||||
|
|  The overall market intelligence score is 10 (0-bearish to 100-bullish) which puts Biotech sector in short term bearish trend. The market intelligence score from previous trading session is 0 and an improvement of trend continues.
| ||||||||
Here are the market intelligence trend scores of the most requested Biotech stocks at 12Stocks.com (click stock name for detailed review):
|


| 12Stocks.com: Investing in Biotech sector with Stocks | |
|
The following table helps investors and traders sort through current performance and trends (as measured by market intelligence score) of various
stocks in the Biotech sector. Quick View: Move mouse or cursor over stock symbol (ticker) to view short-term Technical chart and over stock name to view long term chart. Click on  to add stock symbol to your watchlist and to add stock symbol to your watchlist and  to view watchlist. Click on any ticker or stock name for detailed market intelligence report for that stock. to view watchlist. Click on any ticker or stock name for detailed market intelligence report for that stock. |
12Stocks.com Performance of Stocks in Biotech Sector
| Ticker | Stock Name | Watchlist | Category | Recent Price | Market Intelligence Score | Change % | Weekly Change% |
| RCUS | Arcus |   | Biotechnology | 14.68 | 20 | 0.62% | 0.62% |
| PRTA | Prothena | | Biotechnology | 21.29 | 52 | 0.61% | 0.61% |
| CERS | Cerus | | Biotechnology | 1.69 | 42 | 0.60% | 0.60% |
| OCX | OncoCyte | | Biotechnology | 2.51 | 27 | 0.60% | 0.60% |
| FBIO | Fortress | | Biotechnology | 1.76 | 17 | 0.57% | 0.57% |
| RLYB | Rallybio | | Biotechnology | 1.77 | 78 | 0.57% | 0.57% |
| MDGL | Madrigal | | Biotechnology | 213.49 | 10 | 0.55% | 0.55% |
| GRTS | Gritstone Oncology | | Biotechnology | 0.75 | 32 | 0.55% | 0.55% |
| AVTE | Aerovate | | Biotechnology | 22.17 | 53 | 0.54% | 0.54% |
| LEGN | Legend | | Biotechnology | 47.06 | 17 | 0.53% | 0.53% |
| XOMA | XOMA | | Biotechnology | 25.61 | 83 | 0.51% | 0.51% |
| FUSN | Fusion | | Biotechnology | 21.32 | 68 | 0.47% | 0.47% |
| ARDX | Ardelyx | | Biotechnology | 6.51 | 25 | 0.46% | 0.46% |
| ATXI | Avenue | | Biotechnology | 0.13 | 42 | 0.46% | 0.46% |
| SCPH | sc | | Biotechnology | 4.57 | 32 | 0.44% | 0.44% |
| ANIK | Anika | | Biotechnology | 25.95 | 90 | 0.43% | 0.43% |
| JANX | Janux | | Biotechnology | 48.88 | 66 | 0.39% | 0.39% |
| REGN | Regeneron | | Biotechnology | 900.16 | 25 | 0.37% | 0.37% |
| ARVN | Arvinas | | Biotechnology | 34.90 | 32 | 0.35% | 0.35% |
| DVAX | Dynavax Technologies | | Biotechnology | 11.84 | 49 | 0.34% | 0.34% |
| PHAT | Phathom | | Biotechnology | 9.01 | 33 | 0.33% | 0.33% |
| XENE | Xenon | | Biotechnology | 40.00 | 0 | 0.30% | 0.30% |
| GILD | Gilead | | Biotechnology | 66.95 | 27 | 0.28% | 0.28% |
| IMCR | Immunocore | | Biotechnology | 55.82 | 32 | 0.25% | 0.25% |
| EXAI | Exscientia | | Biotechnology | 4.25 | 17 | 0.24% | 0.24% |
| To view more stocks, click on Next / Previous arrows or select different range: 0 - 25 , 25 - 50 , 50 - 75 , 75 - 100 , 100 - 125 , 125 - 150 , 150 - 175 , 175 - 200 , 200 - 225 , 225 - 250 , 250 - 275 , 275 - 300 , 300 - 325 , 325 - 350 , 350 - 375 , 375 - 400 | ||
 | Click To Change The Sort Order: By Market Cap or Company Size Performance: Year-to-date, Week and Day |  |
|
Get the most comprehensive stock market coverage daily at 12Stocks.com ➞ Best Stocks Today ➞ Best Stocks Weekly ➞ Best Stocks Year-to-Date ➞ Best Stocks Trends ➞  Best Stocks Today 12Stocks.com Best Nasdaq Stocks ➞ Best S&P 500 Stocks ➞ Best Tech Stocks ➞ Best Biotech Stocks ➞ |
| Detailed Overview of Biotech Stocks |
| Biotech Technical Overview, Leaders & Laggards, Top Biotech ETF Funds & Detailed Biotech Stocks List, Charts, Trends & More |
| Biotech Sector: Technical Analysis, Trends & YTD Performance | |
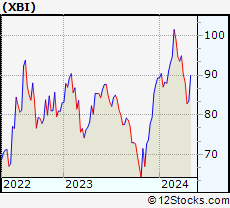
| Biotech sector, as represented by XBI, an exchange-traded fund [ETF] that holds basket of Biotech stocks (e.g, Amgen, Celgene) is down by -7.26% and is currently underperforming the overall market by -11.65% year-to-date. Below is a quick view of Technical charts and trends: | |
 XBI Weekly Chart |
|
| Long Term Trend: Not Good | |
| Medium Term Trend: Not Good | |
 XBI Daily Chart |
|
| Short Term Trend: Deteriorating | |
| Overall Trend Score: 10 | |
| YTD Performance: -7.26% | |
| **Trend Scores & Views Are Only For Educational Purposes And Not For Investing | |
| 12Stocks.com: Top Performing Biotech Sector Stocks | ||||||||||||||||||||||||||||||||||||||||||||||||
 The top performing Biotech sector stocks year to date are
Now, more recently, over last week, the top performing Biotech sector stocks on the move are


|
||||||||||||||||||||||||||||||||||||||||||||||||
| 12Stocks.com: Investing in Biotech Sector using Exchange Traded Funds | |
|
The following table shows list of key exchange traded funds (ETF) that
help investors track Biotech Index. For detailed view, check out our ETF Funds section of our website. Quick View: Move mouse or cursor over ETF symbol (ticker) to view short-term Technical chart and over ETF name to view long term chart. Click on ticker or stock name for detailed view. Click on to add stock symbol to your watchlist and to view watchlist. |
12Stocks.com List of ETFs that track Biotech Index
| Ticker | ETF Name | Watchlist | Recent Price | Market Intelligence Score | Change % | Week % | Year-to-date % |
| LABD | Biotech Bear 3X | | 10.75 | 95 | -0.46 | -0.46 | 10.94% |
| XBI | Biotech | | 82.81 | 10 | -0.03 | -0.03 | -7.26% |
| IBB | Biotechnology | | 126.11 | 25 | 1.11 | 1.11 | -7.17% |
| LABU | Biotech Bull 3X | | 86.43 | 10 | 0.44 | 0.44 | -29.14% |
| IHF | Healthcare Providers | | 52.08 | 70 | -0.26 | -0.26 | -0.83% |
| IYH | Healthcare | | 58.43 | 38 | 0.46 | 0.46 | 2.06% |
| IXJ | Global Healthcare | | 88.41 | 52 | 0.75 | 0.75 | 1.95% |
| CURE | Healthcare Bull 3X | | 104.45 | 32 | 1.08 | 1.08 | 2.66% |
| FBT | First NYSE | | 142.93 | 25 | 0.88 | 0.88 | -9.57% |
| BIB | Biotechnology | | 49.10 | 10 | 1.87 | 1.87 | -13.94% |
| PTH | DWA Healthcare Momentum | | 39.34 | 10 | -0.48 | -0.48 | 0.51% |
| PBE | Biotech & Genome | | 60.64 | 25 | 1.32 | 1.32 | -7.9% |
| BIS | Short Biotech | | 20.47 | 68 | -2.03 | -2.03 | 13.28% |
| BBH | Biotech | | 154.56 | 32 | 1.44 | 1.44 | -6.5% |
| BBC | Bio Biotechnology Clinical | | 24.86 | 10 | 0.61 | 0.61 | 1.67% |
| BTEC | Principal Healthcare Innovators | | 33.76 | 0 | -0.30 | -0.3 | -7.07% |
| BBP | Bio Biotechnology Products | | 51.43 | 17 | 1.98 | 1.98 | -11.47% |
| 12Stocks.com: Charts, Trends, Fundamental Data and Performances of Biotech Stocks | |
|
We now take in-depth look at all Biotech stocks including charts, multi-period performances and overall trends (as measured by market intelligence score). One can sort Biotech stocks (click link to choose) by Daily, Weekly and by Year-to-Date performances. Also, one can sort by size of the company or by market capitalization. |
| Select Your Default Chart Type: | |||||
| |||||
| Click on stock symbol or name for detailed view. Click on to add stock symbol to your watchlist and to view watchlist. Quick View: Move mouse or cursor over "Daily" to quickly view daily Technical stock chart and over "Weekly" to view weekly Technical stock chart. | |||||

 | RCUS Arcus Biosciences, Inc. |
| Sector: Health Care | |
| SubSector: Biotechnology | |
| MarketCap: 539.285 Millions | |
| Recent Price: 14.68 Market Intelligence Score: 20 | |
| Day Percent Change: 0.62% Day Change: 0.09 | |
| Week Change: 0.62% Year-to-date Change: -23.1% | |
| RCUS Links: Profile News Message Board | |
| Charts:- Daily , Weekly | |
| Add RCUS to Watchlist: View: Get Complete RCUS Trend Analysis ➞ | |
 | PRTA Prothena Corporation plc |
| Sector: Health Care | |
| SubSector: Biotechnology | |
| MarketCap: 357.985 Millions | |
| Recent Price: 21.29 Market Intelligence Score: 52 | |
| Day Percent Change: 0.61% Day Change: 0.13 | |
| Week Change: 0.61% Year-to-date Change: -41.4% | |
| PRTA Links: Profile News Message Board | |
| Charts:- Daily , Weekly | |
| Add PRTA to Watchlist: View: Get Complete PRTA Trend Analysis ➞ | |
 | CERS Cerus Corporation |
| Sector: Health Care | |
| SubSector: Biotechnology | |
| MarketCap: 607.185 Millions | |
| Recent Price: 1.69 Market Intelligence Score: 42 | |
| Day Percent Change: 0.60% Day Change: 0.01 | |
| Week Change: 0.6% Year-to-date Change: -21.8% | |
| CERS Links: Profile News Message Board | |
| Charts:- Daily , Weekly | |
| Add CERS to Watchlist: View: Get Complete CERS Trend Analysis ➞ | |
 | OCX OncoCyte Corporation |
| Sector: Health Care | |
| SubSector: Biotechnology | |
| MarketCap: 131.485 Millions | |
| Recent Price: 2.51 Market Intelligence Score: 27 | |
| Day Percent Change: 0.60% Day Change: 0.01 | |
| Week Change: 0.6% Year-to-date Change: 0.4% | |
| OCX Links: Profile News Message Board | |
| Charts:- Daily , Weekly | |
| Add OCX to Watchlist: View: Get Complete OCX Trend Analysis ➞ | |
 | FBIO Fortress Biotech, Inc. |
| Sector: Health Care | |
| SubSector: Biotechnology | |
| MarketCap: 116.885 Millions | |
| Recent Price: 1.76 Market Intelligence Score: 17 | |
| Day Percent Change: 0.57% Day Change: 0.01 | |
| Week Change: 0.57% Year-to-date Change: -41.5% | |
| FBIO Links: Profile News Message Board | |
| Charts:- Daily , Weekly | |
| Add FBIO to Watchlist: View: Get Complete FBIO Trend Analysis ➞ | |
 | RLYB Rallybio Corporation |
| Sector: Health Care | |
| SubSector: Biotechnology | |
| MarketCap: 226 Millions | |
| Recent Price: 1.77 Market Intelligence Score: 78 | |
| Day Percent Change: 0.57% Day Change: 0.01 | |
| Week Change: 0.57% Year-to-date Change: -25.0% | |
| RLYB Links: Profile News Message Board | |
| Charts:- Daily , Weekly | |
| Add RLYB to Watchlist: View: Get Complete RLYB Trend Analysis ➞ | |
 | MDGL Madrigal Pharmaceuticals, Inc. |
| Sector: Health Care | |
| SubSector: Biotechnology | |
| MarketCap: 1104.35 Millions | |
| Recent Price: 213.49 Market Intelligence Score: 10 | |
| Day Percent Change: 0.55% Day Change: 1.16 | |
| Week Change: 0.55% Year-to-date Change: -7.7% | |
| MDGL Links: Profile News Message Board | |
| Charts:- Daily , Weekly | |
| Add MDGL to Watchlist: View: Get Complete MDGL Trend Analysis ➞ | |
 | GRTS Gritstone Oncology, Inc. |
| Sector: Health Care | |
| SubSector: Biotechnology | |
| MarketCap: 240.085 Millions | |
| Recent Price: 0.75 Market Intelligence Score: 32 | |
| Day Percent Change: 0.55% Day Change: 0.00 | |
| Week Change: 0.55% Year-to-date Change: -63.5% | |
| GRTS Links: Profile News Message Board | |
| Charts:- Daily , Weekly | |
| Add GRTS to Watchlist: View: Get Complete GRTS Trend Analysis ➞ | |
 | AVTE Aerovate Therapeutics, Inc. |
| Sector: Health Care | |
| SubSector: Biotechnology | |
| MarketCap: 478 Millions | |
| Recent Price: 22.17 Market Intelligence Score: 53 | |
| Day Percent Change: 0.54% Day Change: 0.12 | |
| Week Change: 0.54% Year-to-date Change: -1.8% | |
| AVTE Links: Profile News Message Board | |
| Charts:- Daily , Weekly | |
| Add AVTE to Watchlist: View: Get Complete AVTE Trend Analysis ➞ | |
 | LEGN Legend Biotech Corporation |
| Sector: Health Care | |
| SubSector: Biotechnology | |
| MarketCap: 37387 Millions | |
| Recent Price: 47.06 Market Intelligence Score: 17 | |
| Day Percent Change: 0.53% Day Change: 0.25 | |
| Week Change: 0.53% Year-to-date Change: -22.0% | |
| LEGN Links: Profile News Message Board | |
| Charts:- Daily , Weekly | |
| Add LEGN to Watchlist: View: Get Complete LEGN Trend Analysis ➞ | |
 | XOMA XOMA Corporation |
| Sector: Health Care | |
| SubSector: Biotechnology | |
| MarketCap: 174.885 Millions | |
| Recent Price: 25.61 Market Intelligence Score: 83 | |
| Day Percent Change: 0.51% Day Change: 0.13 | |
| Week Change: 0.51% Year-to-date Change: 38.4% | |
| XOMA Links: Profile News Message Board | |
| Charts:- Daily , Weekly | |
| Add XOMA to Watchlist: View: Get Complete XOMA Trend Analysis ➞ | |
 | FUSN Fusion Pharmaceuticals Inc. |
| Sector: Health Care | |
| SubSector: Biotechnology | |
| MarketCap: 52487 Millions | |
| Recent Price: 21.32 Market Intelligence Score: 68 | |
| Day Percent Change: 0.47% Day Change: 0.10 | |
| Week Change: 0.47% Year-to-date Change: 122.1% | |
| FUSN Links: Profile News Message Board | |
| Charts:- Daily , Weekly | |
| Add FUSN to Watchlist: View: Get Complete FUSN Trend Analysis ➞ | |
 | ARDX Ardelyx, Inc. |
| Sector: Health Care | |
| SubSector: Biotechnology | |
| MarketCap: 541.985 Millions | |
| Recent Price: 6.51 Market Intelligence Score: 25 | |
| Day Percent Change: 0.46% Day Change: 0.03 | |
| Week Change: 0.46% Year-to-date Change: 5.0% | |
| ARDX Links: Profile News Message Board | |
| Charts:- Daily , Weekly | |
| Add ARDX to Watchlist: View: Get Complete ARDX Trend Analysis ➞ | |
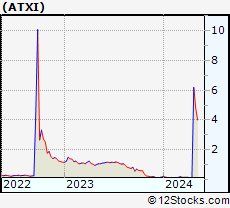 | ATXI Avenue Therapeutics, Inc. |
| Sector: Health Care | |
| SubSector: Biotechnology | |
| MarketCap: 118.185 Millions | |
| Recent Price: 0.13 Market Intelligence Score: 42 | |
| Day Percent Change: 0.46% Day Change: 0.00 | |
| Week Change: 0.46% Year-to-date Change: -19.2% | |
| ATXI Links: Profile News Message Board | |
| Charts:- Daily , Weekly | |
| Add ATXI to Watchlist: View: Get Complete ATXI Trend Analysis ➞ | |
 | SCPH scPharmaceuticals Inc. |
| Sector: Health Care | |
| SubSector: Biotechnology | |
| MarketCap: 136.185 Millions | |
| Recent Price: 4.57 Market Intelligence Score: 32 | |
| Day Percent Change: 0.44% Day Change: 0.02 | |
| Week Change: 0.44% Year-to-date Change: -27.1% | |
| SCPH Links: Profile News Message Board | |
| Charts:- Daily , Weekly | |
| Add SCPH to Watchlist: View: Get Complete SCPH Trend Analysis ➞ | |
 | ANIK Anika Therapeutics, Inc. |
| Sector: Health Care | |
| SubSector: Biotechnology | |
| MarketCap: 438.385 Millions | |
| Recent Price: 25.95 Market Intelligence Score: 90 | |
| Day Percent Change: 0.43% Day Change: 0.11 | |
| Week Change: 0.43% Year-to-date Change: 14.5% | |
| ANIK Links: Profile News Message Board | |
| Charts:- Daily , Weekly | |
| Add ANIK to Watchlist: View: Get Complete ANIK Trend Analysis ➞ | |
 | JANX Janux Therapeutics, Inc. |
| Sector: Health Care | |
| SubSector: Biotechnology | |
| MarketCap: 496 Millions | |
| Recent Price: 48.88 Market Intelligence Score: 66 | |
| Day Percent Change: 0.39% Day Change: 0.19 | |
| Week Change: 0.39% Year-to-date Change: 354.9% | |
| JANX Links: Profile News Message Board | |
| Charts:- Daily , Weekly | |
| Add JANX to Watchlist: View: Get Complete JANX Trend Analysis ➞ | |
 | REGN Regeneron Pharmaceuticals, Inc. |
| Sector: Health Care | |
| SubSector: Biotechnology | |
| MarketCap: 51903.7 Millions | |
| Recent Price: 900.16 Market Intelligence Score: 25 | |
| Day Percent Change: 0.37% Day Change: 3.34 | |
| Week Change: 0.37% Year-to-date Change: 2.5% | |
| REGN Links: Profile News Message Board | |
| Charts:- Daily , Weekly | |
| Add REGN to Watchlist: View: Get Complete REGN Trend Analysis ➞ | |
 | ARVN Arvinas, Inc. |
| Sector: Health Care | |
| SubSector: Biotechnology | |
| MarketCap: 3469.85 Millions | |
| Recent Price: 34.90 Market Intelligence Score: 32 | |
| Day Percent Change: 0.35% Day Change: 0.12 | |
| Week Change: 0.35% Year-to-date Change: -15.2% | |
| ARVN Links: Profile News Message Board | |
| Charts:- Daily , Weekly | |
| Add ARVN to Watchlist: View: Get Complete ARVN Trend Analysis ➞ | |
 | DVAX Dynavax Technologies Corporation |
| Sector: Health Care | |
| SubSector: Biotechnology | |
| MarketCap: 276.885 Millions | |
| Recent Price: 11.84 Market Intelligence Score: 49 | |
| Day Percent Change: 0.34% Day Change: 0.04 | |
| Week Change: 0.34% Year-to-date Change: -15.3% | |
| DVAX Links: Profile News Message Board | |
| Charts:- Daily , Weekly | |
| Add DVAX to Watchlist: View: Get Complete DVAX Trend Analysis ➞ | |
 | PHAT Phathom Pharmaceuticals, Inc. |
| Sector: Health Care | |
| SubSector: Biotechnology | |
| MarketCap: 728.785 Millions | |
| Recent Price: 9.01 Market Intelligence Score: 33 | |
| Day Percent Change: 0.33% Day Change: 0.03 | |
| Week Change: 0.33% Year-to-date Change: -1.3% | |
| PHAT Links: Profile News Message Board | |
| Charts:- Daily , Weekly | |
| Add PHAT to Watchlist: View: Get Complete PHAT Trend Analysis ➞ | |
 | XENE Xenon Pharmaceuticals Inc. |
| Sector: Health Care | |
| SubSector: Biotechnology | |
| MarketCap: 388.585 Millions | |
| Recent Price: 40.00 Market Intelligence Score: 0 | |
| Day Percent Change: 0.30% Day Change: 0.12 | |
| Week Change: 0.3% Year-to-date Change: -13.2% | |
| XENE Links: Profile News Message Board | |
| Charts:- Daily , Weekly | |
| Add XENE to Watchlist: View: Get Complete XENE Trend Analysis ➞ | |
 | GILD Gilead Sciences, Inc. |
| Sector: Health Care | |
| SubSector: Biotechnology | |
| MarketCap: 99485.6 Millions | |
| Recent Price: 66.95 Market Intelligence Score: 27 | |
| Day Percent Change: 0.28% Day Change: 0.19 | |
| Week Change: 0.28% Year-to-date Change: -17.4% | |
| GILD Links: Profile News Message Board | |
| Charts:- Daily , Weekly | |
| Add GILD to Watchlist: View: Get Complete GILD Trend Analysis ➞ | |
 | IMCR Immunocore Holdings plc |
| Sector: Health Care | |
| SubSector: Biotechnology | |
| MarketCap: 2830 Millions | |
| Recent Price: 55.82 Market Intelligence Score: 32 | |
| Day Percent Change: 0.25% Day Change: 0.14 | |
| Week Change: 0.25% Year-to-date Change: -17.8% | |
| IMCR Links: Profile News Message Board | |
| Charts:- Daily , Weekly | |
| Add IMCR to Watchlist: View: Get Complete IMCR Trend Analysis ➞ | |
 | EXAI Exscientia plc |
| Sector: Health Care | |
| SubSector: Biotechnology | |
| MarketCap: 796 Millions | |
| Recent Price: 4.25 Market Intelligence Score: 17 | |
| Day Percent Change: 0.24% Day Change: 0.01 | |
| Week Change: 0.24% Year-to-date Change: -34.3% | |
| EXAI Links: Profile News Message Board | |
| Charts:- Daily , Weekly | |
| Add EXAI to Watchlist: View: Get Complete EXAI Trend Analysis ➞ | |
| To view more stocks, click on Next / Previous arrows or select different range: 0 - 25 , 25 - 50 , 50 - 75 , 75 - 100 , 100 - 125 , 125 - 150 , 150 - 175 , 175 - 200 , 200 - 225 , 225 - 250 , 250 - 275 , 275 - 300 , 300 - 325 , 325 - 350 , 350 - 375 , 375 - 400 | ||
| Click To Change The Sort Order: By Market Cap or Company Size Performance: Year-to-date, Week and Day | |
| Select Chart Type: | ||
|
Best Stocks Today 12Stocks.com |
© 2024 12Stocks.com Terms & Conditions Privacy Contact Us
All Information Provided Only For Education And Not To Be Used For Investing or Trading. See Terms & Conditions


One More Thing ... Get Best Stocks Delivered Daily!
Never Ever Miss A Move With Our Top Ten Stocks Lists
Find Best Stocks In Any Market - Bull or Bear Market
Take A Peek At Our Top Ten Stocks Lists: Daily, Weekly, Year-to-Date & Top Trends
Find Best Stocks In Any Market - Bull or Bear Market
Take A Peek At Our Top Ten Stocks Lists: Daily, Weekly, Year-to-Date & Top Trends
Biotech Stocks With Best Up Trends [0-bearish to 100-bullish]: Annovis Bio[93], Agios [90], Anika [90], GH Research[88], NuCana [88], Day One[86], Nektar [85], Agenus [83], Lyell Immunopharma[83], Moderna [83], Geron [83]
Best Biotech Stocks Year-to-Date:
Precision [2552.05%], Inovio [1864.71%], Assembly [1512%], Adverum nologies[1406.38%], NuCana [1231.98%], Affimed N.V[700%], Agenus [596.94%], Corbus [524.17%], Mesoblast [402.73%], Janux [354.91%], Viking [237.13%] Best Biotech Stocks This Week:
ProKidney [33.33%], BeyondSpring [17.22%], Molecular Partners[16.87%], ArTara [16.41%], Annovis Bio[14.9%], Seres [11.56%], Cara [10.5%], Syros [9.91%], Nektar [9.68%], Pharvaris N.V[8.92%], Agenus [8.66%] Best Biotech Stocks Daily:
ProKidney [33.33%], BeyondSpring [17.22%], Molecular Partners[16.87%], ArTara [16.41%], Annovis Bio[14.90%], Seres [11.56%], Cara [10.50%], Syros [9.91%], Nektar [9.68%], Pharvaris N.V[8.92%], Agenus [8.66%]