
 Login Sign Up


| |||||
 |  | ||||

| 12Stocks.com Market Intelligence |
Best Biotech Stocks
|
|
| Quick Read: Best Biotech Stocks List By Performances & Trends: Daily, Weekly, Year-to-Date, Market Cap (Size) & Technical Trends | |||
| Best Biotech Stocks Views: Quick Browse View, Summary & Slide Show View | |||
| 12Stocks.com Biotech Stocks Performances & Trends Daily | |||||||||
|
|  The overall market intelligence score is 10 (0-bearish to 100-bullish) which puts Biotech sector in short term bearish trend. The market intelligence score from previous trading session is 0 and an improvement of trend continues.
| ||||||||
Here are the market intelligence trend scores of the most requested Biotech stocks at 12Stocks.com (click stock name for detailed review):
|


| 12Stocks.com: Investing in Biotech sector with Stocks | |
|
The following table helps investors and traders sort through current performance and trends (as measured by market intelligence score) of various
stocks in the Biotech sector. Quick View: Move mouse or cursor over stock symbol (ticker) to view short-term Technical chart and over stock name to view long term chart. Click on  to add stock symbol to your watchlist and to add stock symbol to your watchlist and  to view watchlist. Click on any ticker or stock name for detailed market intelligence report for that stock. to view watchlist. Click on any ticker or stock name for detailed market intelligence report for that stock. |
12Stocks.com Performance of Stocks in Biotech Sector
| Ticker | Stock Name | Watchlist | Category | Recent Price | Market Intelligence Score | Change % | Weekly Change% |
| RXRX | Recursion |   | Biotechnology | 7.60 | 32 | 3.40% | 3.40% |
| ERAS | Erasca | | Biotechnology | 1.85 | 53 | 3.35% | 3.35% |
| PLRX | Pliant | | Biotechnology | 12.60 | 17 | 3.28% | 3.28% |
| PBYI | Puma nology | | Biotechnology | 5.17 | 43 | 3.19% | 3.19% |
| QSI | Quantum-Si | | Biotechnology | 1.62 | 63 | 3.18% | 3.18% |
| BLTE | Belite Bio | | Biotechnology | 34.48 | 35 | 3.14% | 3.14% |
| RARE | Ultragenyx | | Biotechnology | 43.69 | 17 | 3.12% | 3.12% |
| MTEM | Molecular Templates | | Biotechnology | 1.50 | 27 | 3.09% | 3.09% |
| NUVB | Nuvation Bio | | Biotechnology | 2.68 | 46 | 3.08% | 3.08% |
| BCLI | Brainstorm Cell | | Biotechnology | 0.55 | 61 | 3.01% | 3.01% |
| ITCI | Intra-Cellular Therapies | | Biotechnology | 74.54 | 80 | 3.00% | 3.00% |
| MRNA | Moderna | | Biotechnology | 104.46 | 83 | 2.98% | 2.98% |
| VERA | Vera | | Biotechnology | 39.13 | 46 | 2.97% | 2.97% |
| PYPD | PolyPid | | Biotechnology | 4.42 | 35 | 2.91% | 2.91% |
| QTRX | Quanterix | | Biotechnology | 16.30 | 32 | 2.90% | 2.90% |
| BTAI | BioXcel | | Biotechnology | 2.85 | 62 | 2.89% | 2.89% |
| TSVT | 2seventy bio | | Biotechnology | 4.65 | 10 | 2.88% | 2.88% |
| NERV | Minerva Neuro | | Biotechnology | 2.55 | 32 | 2.82% | 2.82% |
| DAWN | Day One | | Biotechnology | 15.38 | 86 | 2.81% | 2.81% |
| NUVL | Nuvalent | | Biotechnology | 64.49 | 35 | 2.76% | 2.76% |
| RYTM | Rhythm | | Biotechnology | 39.01 | 42 | 2.73% | 2.73% |
| PTCT | PTC | | Biotechnology | 25.97 | 55 | 2.57% | 2.57% |
| TNYA | Tenaya | | Biotechnology | 4.43 | 63 | 2.55% | 2.55% |
| ACIU | AC Immune | | Biotechnology | 2.42 | 27 | 2.54% | 2.54% |
| ETNB | 89bio | | Biotechnology | 9.31 | 32 | 2.53% | 2.53% |
| To view more stocks, click on Next / Previous arrows or select different range: 0 - 25 , 25 - 50 , 50 - 75 , 75 - 100 , 100 - 125 , 125 - 150 , 150 - 175 , 175 - 200 , 200 - 225 , 225 - 250 , 250 - 275 , 275 - 300 , 300 - 325 , 325 - 350 , 350 - 375 , 375 - 400 | ||
 | Click To Change The Sort Order: By Market Cap or Company Size Performance: Year-to-date, Week and Day |  |
|
Get the most comprehensive stock market coverage daily at 12Stocks.com ➞ Best Stocks Today ➞ Best Stocks Weekly ➞ Best Stocks Year-to-Date ➞ Best Stocks Trends ➞  Best Stocks Today 12Stocks.com Best Nasdaq Stocks ➞ Best S&P 500 Stocks ➞ Best Tech Stocks ➞ Best Biotech Stocks ➞ |
| Detailed Overview of Biotech Stocks |
| Biotech Technical Overview, Leaders & Laggards, Top Biotech ETF Funds & Detailed Biotech Stocks List, Charts, Trends & More |
| Biotech Sector: Technical Analysis, Trends & YTD Performance | |
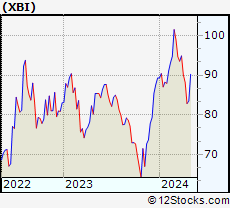
| Biotech sector, as represented by XBI, an exchange-traded fund [ETF] that holds basket of Biotech stocks (e.g, Amgen, Celgene) is down by -7.26% and is currently underperforming the overall market by -11.65% year-to-date. Below is a quick view of Technical charts and trends: | |
 XBI Weekly Chart |
|
| Long Term Trend: Not Good | |
| Medium Term Trend: Not Good | |
 XBI Daily Chart |
|
| Short Term Trend: Deteriorating | |
| Overall Trend Score: 10 | |
| YTD Performance: -7.26% | |
| **Trend Scores & Views Are Only For Educational Purposes And Not For Investing | |
| 12Stocks.com: Top Performing Biotech Sector Stocks | ||||||||||||||||||||||||||||||||||||||||||||||||
 The top performing Biotech sector stocks year to date are
Now, more recently, over last week, the top performing Biotech sector stocks on the move are


|
||||||||||||||||||||||||||||||||||||||||||||||||
| 12Stocks.com: Investing in Biotech Sector using Exchange Traded Funds | |
|
The following table shows list of key exchange traded funds (ETF) that
help investors track Biotech Index. For detailed view, check out our ETF Funds section of our website. Quick View: Move mouse or cursor over ETF symbol (ticker) to view short-term Technical chart and over ETF name to view long term chart. Click on ticker or stock name for detailed view. Click on to add stock symbol to your watchlist and to view watchlist. |
12Stocks.com List of ETFs that track Biotech Index
| Ticker | ETF Name | Watchlist | Recent Price | Market Intelligence Score | Change % | Week % | Year-to-date % |
| LABD | Biotech Bear 3X | | 10.75 | 95 | -0.46 | -0.46 | 10.94% |
| XBI | Biotech | | 82.81 | 10 | -0.03 | -0.03 | -7.26% |
| IBB | Biotechnology | | 126.11 | 25 | 1.11 | 1.11 | -7.17% |
| LABU | Biotech Bull 3X | | 86.43 | 10 | 0.44 | 0.44 | -29.14% |
| IHF | Healthcare Providers | | 52.08 | 70 | -0.26 | -0.26 | -0.83% |
| IYH | Healthcare | | 58.43 | 38 | 0.46 | 0.46 | 2.06% |
| IXJ | Global Healthcare | | 88.41 | 52 | 0.75 | 0.75 | 1.95% |
| CURE | Healthcare Bull 3X | | 104.45 | 32 | 1.08 | 1.08 | 2.66% |
| FBT | First NYSE | | 142.93 | 25 | 0.88 | 0.88 | -9.57% |
| BIB | Biotechnology | | 49.10 | 25 | 1.87 | 1.87 | -13.94% |
| PTH | DWA Healthcare Momentum | | 39.34 | 20 | -0.48 | -0.48 | 0.51% |
| PBE | Biotech & Genome | | 60.64 | 25 | 1.32 | 1.32 | -7.9% |
| BIS | Short Biotech | | 20.47 | 76 | -2.03 | -2.03 | 13.28% |
| BBH | Biotech | | 154.56 | 32 | 1.44 | 1.44 | -6.5% |
| BBC | Bio Biotechnology Clinical | | 24.86 | 10 | 0.61 | 0.61 | 1.67% |
| BTEC | Principal Healthcare Innovators | | 33.76 | 10 | -0.30 | -0.3 | -7.07% |
| BBP | Bio Biotechnology Products | | 51.43 | 17 | 1.98 | 1.98 | -11.47% |
| 12Stocks.com: Charts, Trends, Fundamental Data and Performances of Biotech Stocks | |
|
We now take in-depth look at all Biotech stocks including charts, multi-period performances and overall trends (as measured by market intelligence score). One can sort Biotech stocks (click link to choose) by Daily, Weekly and by Year-to-Date performances. Also, one can sort by size of the company or by market capitalization. |
| Select Your Default Chart Type: | |||||
| |||||
| Click on stock symbol or name for detailed view. Click on to add stock symbol to your watchlist and to view watchlist. Quick View: Move mouse or cursor over "Daily" to quickly view daily Technical stock chart and over "Weekly" to view weekly Technical stock chart. | |||||

 | RXRX Recursion Pharmaceuticals, Inc. |
| Sector: Health Care | |
| SubSector: Biotechnology | |
| MarketCap: 1470 Millions | |
| Recent Price: 7.60 Market Intelligence Score: 32 | |
| Day Percent Change: 3.40% Day Change: 0.25 | |
| Week Change: 3.4% Year-to-date Change: -22.4% | |
| RXRX Links: Profile News Message Board | |
| Charts:- Daily , Weekly | |
| Add RXRX to Watchlist: View: Get Complete RXRX Trend Analysis ➞ | |
 | ERAS Erasca, Inc. |
| Sector: Health Care | |
| SubSector: Biotechnology | |
| MarketCap: 419 Millions | |
| Recent Price: 1.85 Market Intelligence Score: 53 | |
| Day Percent Change: 3.35% Day Change: 0.06 | |
| Week Change: 3.35% Year-to-date Change: -13.2% | |
| ERAS Links: Profile News Message Board | |
| Charts:- Daily , Weekly | |
| Add ERAS to Watchlist: View: Get Complete ERAS Trend Analysis ➞ | |
 | PLRX Pliant Therapeutics, Inc. |
| Sector: Health Care | |
| SubSector: Biotechnology | |
| MarketCap: 96487 Millions | |
| Recent Price: 12.60 Market Intelligence Score: 17 | |
| Day Percent Change: 3.28% Day Change: 0.40 | |
| Week Change: 3.28% Year-to-date Change: -30.5% | |
| PLRX Links: Profile News Message Board | |
| Charts:- Daily , Weekly | |
| Add PLRX to Watchlist: View: Get Complete PLRX Trend Analysis ➞ | |
 | PBYI Puma Biotechnology, Inc. |
| Sector: Health Care | |
| SubSector: Biotechnology | |
| MarketCap: 385.585 Millions | |
| Recent Price: 5.17 Market Intelligence Score: 43 | |
| Day Percent Change: 3.19% Day Change: 0.16 | |
| Week Change: 3.19% Year-to-date Change: 19.4% | |
| PBYI Links: Profile News Message Board | |
| Charts:- Daily , Weekly | |
| Add PBYI to Watchlist: View: Get Complete PBYI Trend Analysis ➞ | |
 | QSI Quantum-Si incorporated |
| Sector: Health Care | |
| SubSector: Biotechnology | |
| MarketCap: 256 Millions | |
| Recent Price: 1.62 Market Intelligence Score: 63 | |
| Day Percent Change: 3.18% Day Change: 0.05 | |
| Week Change: 3.18% Year-to-date Change: -19.4% | |
| QSI Links: Profile News Message Board | |
| Charts:- Daily , Weekly | |
| Add QSI to Watchlist: View: Get Complete QSI Trend Analysis ➞ | |
 | BLTE Belite Bio, Inc |
| Sector: Health Care | |
| SubSector: Biotechnology | |
| MarketCap: 404 Millions | |
| Recent Price: 34.48 Market Intelligence Score: 35 | |
| Day Percent Change: 3.14% Day Change: 1.05 | |
| Week Change: 3.14% Year-to-date Change: -24.3% | |
| BLTE Links: Profile News Message Board | |
| Charts:- Daily , Weekly | |
| Add BLTE to Watchlist: View: Get Complete BLTE Trend Analysis ➞ | |
 | RARE Ultragenyx Pharmaceutical Inc. |
| Sector: Health Care | |
| SubSector: Biotechnology | |
| MarketCap: 2373.35 Millions | |
| Recent Price: 43.69 Market Intelligence Score: 17 | |
| Day Percent Change: 3.12% Day Change: 1.32 | |
| Week Change: 3.12% Year-to-date Change: -8.6% | |
| RARE Links: Profile News Message Board | |
| Charts:- Daily , Weekly | |
| Add RARE to Watchlist: View: Get Complete RARE Trend Analysis ➞ | |
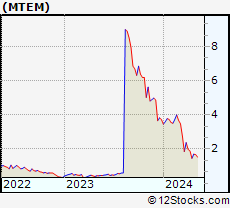 | MTEM Molecular Templates, Inc. |
| Sector: Health Care | |
| SubSector: Biotechnology | |
| MarketCap: 662.785 Millions | |
| Recent Price: 1.50 Market Intelligence Score: 27 | |
| Day Percent Change: 3.09% Day Change: 0.04 | |
| Week Change: 3.09% Year-to-date Change: -59.8% | |
| MTEM Links: Profile News Message Board | |
| Charts:- Daily , Weekly | |
| Add MTEM to Watchlist: View: Get Complete MTEM Trend Analysis ➞ | |
 | NUVB Nuvation Bio Inc. |
| Sector: Health Care | |
| SubSector: Biotechnology | |
| MarketCap: 381 Millions | |
| Recent Price: 2.68 Market Intelligence Score: 46 | |
| Day Percent Change: 3.08% Day Change: 0.08 | |
| Week Change: 3.08% Year-to-date Change: 76.9% | |
| NUVB Links: Profile News Message Board | |
| Charts:- Daily , Weekly | |
| Add NUVB to Watchlist: View: Get Complete NUVB Trend Analysis ➞ | |
 | BCLI Brainstorm Cell Therapeutics Inc. |
| Sector: Health Care | |
| SubSector: Biotechnology | |
| MarketCap: 141.285 Millions | |
| Recent Price: 0.55 Market Intelligence Score: 61 | |
| Day Percent Change: 3.01% Day Change: 0.02 | |
| Week Change: 3.01% Year-to-date Change: 100.7% | |
| BCLI Links: Profile News Message Board | |
| Charts:- Daily , Weekly | |
| Add BCLI to Watchlist: View: Get Complete BCLI Trend Analysis ➞ | |
 | ITCI Intra-Cellular Therapies, Inc. |
| Sector: Health Care | |
| SubSector: Biotechnology | |
| MarketCap: 991.885 Millions | |
| Recent Price: 74.54 Market Intelligence Score: 80 | |
| Day Percent Change: 3.00% Day Change: 2.17 | |
| Week Change: 3% Year-to-date Change: 4.1% | |
| ITCI Links: Profile News Message Board | |
| Charts:- Daily , Weekly | |
| Add ITCI to Watchlist: View: Get Complete ITCI Trend Analysis ➞ | |
 | MRNA Moderna, Inc. |
| Sector: Health Care | |
| SubSector: Biotechnology | |
| MarketCap: 11006.4 Millions | |
| Recent Price: 104.46 Market Intelligence Score: 83 | |
| Day Percent Change: 2.98% Day Change: 3.02 | |
| Week Change: 2.98% Year-to-date Change: 5.0% | |
| MRNA Links: Profile News Message Board | |
| Charts:- Daily , Weekly | |
| Add MRNA to Watchlist: View: Get Complete MRNA Trend Analysis ➞ | |
 | VERA Vera Therapeutics, Inc. |
| Sector: Health Care | |
| SubSector: Biotechnology | |
| MarketCap: 746 Millions | |
| Recent Price: 39.13 Market Intelligence Score: 46 | |
| Day Percent Change: 2.97% Day Change: 1.13 | |
| Week Change: 2.97% Year-to-date Change: 152.8% | |
| VERA Links: Profile News Message Board | |
| Charts:- Daily , Weekly | |
| Add VERA to Watchlist: View: Get Complete VERA Trend Analysis ➞ | |
 | PYPD PolyPid Ltd. |
| Sector: Health Care | |
| SubSector: Biotechnology | |
| MarketCap: 20487 Millions | |
| Recent Price: 4.42 Market Intelligence Score: 35 | |
| Day Percent Change: 2.91% Day Change: 0.13 | |
| Week Change: 2.91% Year-to-date Change: 20.6% | |
| PYPD Links: Profile News Message Board | |
| Charts:- Daily , Weekly | |
| Add PYPD to Watchlist: View: Get Complete PYPD Trend Analysis ➞ | |
 | QTRX Quanterix Corporation |
| Sector: Health Care | |
| SubSector: Biotechnology | |
| MarketCap: 448.685 Millions | |
| Recent Price: 16.30 Market Intelligence Score: 32 | |
| Day Percent Change: 2.90% Day Change: 0.46 | |
| Week Change: 2.9% Year-to-date Change: -40.4% | |
| QTRX Links: Profile News Message Board | |
| Charts:- Daily , Weekly | |
| Add QTRX to Watchlist: View: Get Complete QTRX Trend Analysis ➞ | |
 | BTAI BioXcel Therapeutics, Inc. |
| Sector: Health Care | |
| SubSector: Biotechnology | |
| MarketCap: 487.485 Millions | |
| Recent Price: 2.85 Market Intelligence Score: 62 | |
| Day Percent Change: 2.89% Day Change: 0.08 | |
| Week Change: 2.89% Year-to-date Change: -3.4% | |
| BTAI Links: Profile News Message Board | |
| Charts:- Daily , Weekly | |
| Add BTAI to Watchlist: View: Get Complete BTAI Trend Analysis ➞ | |
 | TSVT 2seventy bio, Inc. |
| Sector: Health Care | |
| SubSector: Biotechnology | |
| MarketCap: 504 Millions | |
| Recent Price: 4.65 Market Intelligence Score: 10 | |
| Day Percent Change: 2.88% Day Change: 0.13 | |
| Week Change: 2.88% Year-to-date Change: 7.5% | |
| TSVT Links: Profile News Message Board | |
| Charts:- Daily , Weekly | |
| Add TSVT to Watchlist: View: Get Complete TSVT Trend Analysis ➞ | |
 | NERV Minerva Neurosciences, Inc. |
| Sector: Health Care | |
| SubSector: Biotechnology | |
| MarketCap: 223.385 Millions | |
| Recent Price: 2.55 Market Intelligence Score: 32 | |
| Day Percent Change: 2.82% Day Change: 0.07 | |
| Week Change: 2.82% Year-to-date Change: -58.5% | |
| NERV Links: Profile News Message Board | |
| Charts:- Daily , Weekly | |
| Add NERV to Watchlist: View: Get Complete NERV Trend Analysis ➞ | |
 | DAWN Day One Biopharmaceuticals, Inc. |
| Sector: Health Care | |
| SubSector: Biotechnology | |
| MarketCap: 1040 Millions | |
| Recent Price: 15.38 Market Intelligence Score: 86 | |
| Day Percent Change: 2.81% Day Change: 0.42 | |
| Week Change: 2.81% Year-to-date Change: 4.7% | |
| DAWN Links: Profile News Message Board | |
| Charts:- Daily , Weekly | |
| Add DAWN to Watchlist: View: Get Complete DAWN Trend Analysis ➞ | |
 | NUVL Nuvalent, Inc. |
| Sector: Health Care | |
| SubSector: Biotechnology | |
| MarketCap: 2400 Millions | |
| Recent Price: 64.49 Market Intelligence Score: 35 | |
| Day Percent Change: 2.76% Day Change: 1.73 | |
| Week Change: 2.76% Year-to-date Change: -12.3% | |
| NUVL Links: Profile News Message Board | |
| Charts:- Daily , Weekly | |
| Add NUVL to Watchlist: View: Get Complete NUVL Trend Analysis ➞ | |
 | RYTM Rhythm Pharmaceuticals, Inc. |
| Sector: Health Care | |
| SubSector: Biotechnology | |
| MarketCap: 643.685 Millions | |
| Recent Price: 39.01 Market Intelligence Score: 42 | |
| Day Percent Change: 2.73% Day Change: 1.03 | |
| Week Change: 2.73% Year-to-date Change: -15.1% | |
| RYTM Links: Profile News Message Board | |
| Charts:- Daily , Weekly | |
| Add RYTM to Watchlist: View: Get Complete RYTM Trend Analysis ➞ | |
 | PTCT PTC Therapeutics, Inc. |
| Sector: Health Care | |
| SubSector: Biotechnology | |
| MarketCap: 2795.85 Millions | |
| Recent Price: 25.97 Market Intelligence Score: 55 | |
| Day Percent Change: 2.57% Day Change: 0.65 | |
| Week Change: 2.57% Year-to-date Change: -5.8% | |
| PTCT Links: Profile News Message Board | |
| Charts:- Daily , Weekly | |
| Add PTCT to Watchlist: View: Get Complete PTCT Trend Analysis ➞ | |
 | TNYA Tenaya Therapeutics, Inc. |
| Sector: Health Care | |
| SubSector: Biotechnology | |
| MarketCap: 395 Millions | |
| Recent Price: 4.43 Market Intelligence Score: 63 | |
| Day Percent Change: 2.55% Day Change: 0.11 | |
| Week Change: 2.55% Year-to-date Change: 39.3% | |
| TNYA Links: Profile News Message Board | |
| Charts:- Daily , Weekly | |
| Add TNYA to Watchlist: View: Get Complete TNYA Trend Analysis ➞ | |
 | ACIU AC Immune SA |
| Sector: Health Care | |
| SubSector: Biotechnology | |
| MarketCap: 356.585 Millions | |
| Recent Price: 2.42 Market Intelligence Score: 27 | |
| Day Percent Change: 2.54% Day Change: 0.06 | |
| Week Change: 2.54% Year-to-date Change: -51.6% | |
| ACIU Links: Profile News Message Board | |
| Charts:- Daily , Weekly | |
| Add ACIU to Watchlist: View: Get Complete ACIU Trend Analysis ➞ | |
 | ETNB 89bio, Inc. |
| Sector: Health Care | |
| SubSector: Biotechnology | |
| MarketCap: 517.485 Millions | |
| Recent Price: 9.31 Market Intelligence Score: 32 | |
| Day Percent Change: 2.53% Day Change: 0.23 | |
| Week Change: 2.53% Year-to-date Change: -16.7% | |
| ETNB Links: Profile News Message Board | |
| Charts:- Daily , Weekly | |
| Add ETNB to Watchlist: View: Get Complete ETNB Trend Analysis ➞ | |
| To view more stocks, click on Next / Previous arrows or select different range: 0 - 25 , 25 - 50 , 50 - 75 , 75 - 100 , 100 - 125 , 125 - 150 , 150 - 175 , 175 - 200 , 200 - 225 , 225 - 250 , 250 - 275 , 275 - 300 , 300 - 325 , 325 - 350 , 350 - 375 , 375 - 400 | ||
| Click To Change The Sort Order: By Market Cap or Company Size Performance: Year-to-date, Week and Day | |
| Select Chart Type: | ||
|
Best Stocks Today 12Stocks.com |
© 2024 12Stocks.com Terms & Conditions Privacy Contact Us
All Information Provided Only For Education And Not To Be Used For Investing or Trading. See Terms & Conditions


One More Thing ... Get Best Stocks Delivered Daily!
Never Ever Miss A Move With Our Top Ten Stocks Lists
Find Best Stocks In Any Market - Bull or Bear Market
Take A Peek At Our Top Ten Stocks Lists: Daily, Weekly, Year-to-Date & Top Trends
Find Best Stocks In Any Market - Bull or Bear Market
Take A Peek At Our Top Ten Stocks Lists: Daily, Weekly, Year-to-Date & Top Trends
Biotech Stocks With Best Up Trends [0-bearish to 100-bullish]: Annovis Bio[93], Agios [90], Anika [90], GH Research[88], Day One[86], Agenus [83], Moderna [83], Geron [83], XOMA [83], Humacyte [81], NuCana [81]
Best Biotech Stocks Year-to-Date:
Precision [2552.05%], Inovio [1864.71%], Assembly [1512%], Adverum nologies[1406.38%], NuCana [1231.98%], Affimed N.V[700%], Agenus [596.94%], Corbus [524.17%], Mesoblast [402.73%], Janux [354.91%], Viking [237.13%] Best Biotech Stocks This Week:
ProKidney [33.33%], BeyondSpring [17.22%], Molecular Partners[16.87%], ArTara [16.41%], Annovis Bio[14.9%], Seres [11.56%], Cara [10.5%], Syros [9.91%], Nektar [9.68%], Pharvaris N.V[8.92%], Agenus [8.66%] Best Biotech Stocks Daily:
ProKidney [33.33%], BeyondSpring [17.22%], Molecular Partners[16.87%], ArTara [16.41%], Annovis Bio[14.90%], Seres [11.56%], Cara [10.50%], Syros [9.91%], Nektar [9.68%], Pharvaris N.V[8.92%], Agenus [8.66%]