
 Login Sign Up


| |||||
 |  | ||||

| 12Stocks.com Market Intelligence |
Best Biotech Stocks
|
|
| Quick Read: Best Biotech Stocks List By Performances & Trends: Daily, Weekly, Year-to-Date, Market Cap (Size) & Technical Trends | |||
| Best Biotech Stocks Views: Quick Browse View, Summary & Slide Show View | |||
| 12Stocks.com Biotech Stocks Performances & Trends Daily | |||||||||
|
|  The overall market intelligence score is 49 (0-bearish to 100-bullish) which puts Biotech sector in short term neutral trend. The market intelligence score from previous trading session is 17 and hence an improvement of trend.
| ||||||||
Here are the market intelligence trend scores of the most requested Biotech stocks at 12Stocks.com (click stock name for detailed review):
|


| 12Stocks.com: Investing in Biotech sector with Stocks | |
|
The following table helps investors and traders sort through current performance and trends (as measured by market intelligence score) of various
stocks in the Biotech sector. Quick View: Move mouse or cursor over stock symbol (ticker) to view short-term Technical chart and over stock name to view long term chart. Click on  to add stock symbol to your watchlist and to add stock symbol to your watchlist and  to view watchlist. Click on any ticker or stock name for detailed market intelligence report for that stock. to view watchlist. Click on any ticker or stock name for detailed market intelligence report for that stock. |
12Stocks.com Performance of Stocks in Biotech Sector
| Ticker | Stock Name | Watchlist | Category | Recent Price | Market Intelligence Score | Change % | Weekly Change% |
| RPTX | Repare |   | Biotechnology | 3.22 | 27 | 0.63% | 0.63% |
| PHVS | Pharvaris N.V | | Biotechnology | 23.47 | 50 | 0.51% | 0.51% |
| KRON | Kronos Bio | | Biotechnology | 1.00 | 30 | 0.50% | 0.50% |
| PCVX | Vaxcyte | | Biotechnology | 61.02 | 50 | 0.50% | 0.50% |
| HALO | Halozyme | | Biotechnology | 38.76 | 83 | 0.49% | 0.49% |
| ARCT | Arcturus | | Biotechnology | 26.68 | 17 | 0.49% | 0.49% |
| GPCR | Structure | | Biotechnology | 39.09 | 32 | 0.49% | 0.49% |
| ALXO | ALX Oncology | | Biotechnology | 16.94 | 76 | 0.47% | 0.47% |
| SGMO | Sangamo | | Biotechnology | 0.52 | 76 | 0.44% | 0.44% |
| NAUT | Nautilus nology | | Biotechnology | 2.50 | 64 | 0.40% | 0.40% |
| AMRN | Amarin | | Biotechnology | 0.88 | 13 | 0.39% | 0.39% |
| RPRX | Royalty Pharma | | Biotechnology | 28.10 | 17 | 0.36% | 0.36% |
| SIGA | SIGA Technologies | | Biotechnology | 8.82 | 90 | 0.34% | 0.34% |
| INBX | Inhibrx | | Biotechnology | 34.17 | 35 | 0.32% | 0.32% |
| ABOS | Acumen | | Biotechnology | 3.18 | 39 | 0.32% | 0.32% |
| ADMA | ADMA Biologics | | Biotechnology | 6.57 | 90 | 0.31% | 0.31% |
| OMGA | Omega | | Biotechnology | 2.27 | 10 | 0.22% | 0.22% |
| EXEL | Exelixis | | Biotechnology | 23.75 | 88 | 0.21% | 0.21% |
| ANIP | ANI | | Biotechnology | 65.50 | 51 | 0.21% | 0.21% |
| DRTS | Alpha Tau | | Biotechnology | 2.40 | 10 | 0.21% | 0.21% |
| MRUS | Merus N.V | | Biotechnology | 45.12 | 78 | 0.18% | 0.18% |
| SRPT | Sarepta | | Biotechnology | 128.95 | 100 | 0.14% | 0.14% |
| BPMC | Blueprint Medicines | | Biotechnology | 93.13 | 95 | 0.14% | 0.14% |
| ANNX | Annexon | | Biotechnology | 4.71 | 51 | 0.11% | 0.11% |
| LGND | Ligand | | Biotechnology | 70.63 | 20 | 0.09% | 0.09% |
| To view more stocks, click on Next / Previous arrows or select different range: 0 - 25 , 25 - 50 , 50 - 75 , 75 - 100 , 100 - 125 , 125 - 150 , 150 - 175 , 175 - 200 , 200 - 225 , 225 - 250 , 250 - 275 , 275 - 300 , 300 - 325 , 325 - 350 , 350 - 375 , 375 - 400 | ||
 | Click To Change The Sort Order: By Market Cap or Company Size Performance: Year-to-date, Week and Day |  |
|
Get the most comprehensive stock market coverage daily at 12Stocks.com ➞ Best Stocks Today ➞ Best Stocks Weekly ➞ Best Stocks Year-to-Date ➞ Best Stocks Trends ➞  Best Stocks Today 12Stocks.com Best Nasdaq Stocks ➞ Best S&P 500 Stocks ➞ Best Tech Stocks ➞ Best Biotech Stocks ➞ |
| Detailed Overview of Biotech Stocks |
| Biotech Technical Overview, Leaders & Laggards, Top Biotech ETF Funds & Detailed Biotech Stocks List, Charts, Trends & More |
| Biotech Sector: Technical Analysis, Trends & YTD Performance | |
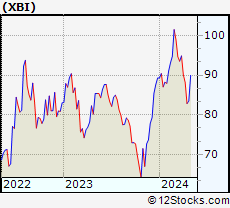
| Biotech sector, as represented by XBI, an exchange-traded fund [ETF] that holds basket of Biotech stocks (e.g, Amgen, Celgene) is down by -4.22% and is currently underperforming the overall market by -10.78% year-to-date. Below is a quick view of Technical charts and trends: | |
 XBI Weekly Chart |
|
| Long Term Trend: Not Good | |
| Medium Term Trend: Not Good | |
 XBI Daily Chart |
|
| Short Term Trend: Very Good | |
| Overall Trend Score: 49 | |
| YTD Performance: -4.22% | |
| **Trend Scores & Views Are Only For Educational Purposes And Not For Investing | |
| 12Stocks.com: Top Performing Biotech Sector Stocks | ||||||||||||||||||||||||||||||||||||||||||||||||
 The top performing Biotech sector stocks year to date are
Now, more recently, over last week, the top performing Biotech sector stocks on the move are


|
||||||||||||||||||||||||||||||||||||||||||||||||
| 12Stocks.com: Investing in Biotech Sector using Exchange Traded Funds | |
|
The following table shows list of key exchange traded funds (ETF) that
help investors track Biotech Index. For detailed view, check out our ETF Funds section of our website. Quick View: Move mouse or cursor over ETF symbol (ticker) to view short-term Technical chart and over ETF name to view long term chart. Click on ticker or stock name for detailed view. Click on to add stock symbol to your watchlist and to view watchlist. |
12Stocks.com List of ETFs that track Biotech Index
| Ticker | ETF Name | Watchlist | Recent Price | Market Intelligence Score | Change % | Week % | Year-to-date % |
| LABD | Biotech Bear 3X | | 9.69 | 35 | -7.89 | -7.89 | 0% |
| XBI | Biotech | | 85.52 | 49 | 2.43 | 2.43 | -4.22% |
| LABU | Biotech Bull 3X | | 94.11 | 42 | 7.54 | 7.54 | -22.84% |
| IBB | Biotechnology | | 128.35 | 35 | 1.47 | 1.47 | -5.52% |
| IYH | Healthcare | | 58.86 | 70 | 0.43 | 0.43 | 2.82% |
| IXJ | Global Healthcare | | 89.47 | 70 | 0.39 | 0.39 | 3.17% |
| BIB | Biotechnology | | 51.77 | 57 | 4.25 | 4.25 | -9.26% |
| IHF | Healthcare Providers | | 52.06 | 65 | 0.26 | 0.26 | -0.87% |
| CURE | Healthcare Bull 3X | | 106.25 | 49 | 0.90 | 0.9 | 4.43% |
| FBT | First NYSE | | 145.65 | 42 | 1.39 | 1.39 | -7.85% |
| BIS | Short Biotech | | 19.55 | 56 | -3.31 | -3.31 | 8.19% |
| PTH | DWA Healthcare Momentum | | 39.88 | 48 | -0.03 | -0.03 | 1.89% |
| PBE | Biotech & Genome | | 61.47 | 57 | 1.81 | 1.81 | -6.64% |
| BTEC | Principal Healthcare Innovators | | 34.84 | 42 | 1.72 | 1.72 | -4.1% |
| BBH | Biotech | | 155.59 | 27 | -0.04 | -0.04 | -5.88% |
| BBP | Bio Biotechnology Products | | 53.55 | 64 | 4.01 | 4.01 | -7.82% |
| BBC | Bio Biotechnology Clinical | | 26.25 | 75 | 2.82 | 2.82 | 7.35% |
| 12Stocks.com: Charts, Trends, Fundamental Data and Performances of Biotech Stocks | |
|
We now take in-depth look at all Biotech stocks including charts, multi-period performances and overall trends (as measured by market intelligence score). One can sort Biotech stocks (click link to choose) by Daily, Weekly and by Year-to-Date performances. Also, one can sort by size of the company or by market capitalization. |
| Select Your Default Chart Type: | |||||
| |||||
| Click on stock symbol or name for detailed view. Click on to add stock symbol to your watchlist and to view watchlist. Quick View: Move mouse or cursor over "Daily" to quickly view daily Technical stock chart and over "Weekly" to view weekly Technical stock chart. | |||||

 | RPTX Repare Therapeutics Inc. |
| Sector: Health Care | |
| SubSector: Biotechnology | |
| MarketCap: 13687 Millions | |
| Recent Price: 3.22 Market Intelligence Score: 27 | |
| Day Percent Change: 0.63% Day Change: 0.02 | |
| Week Change: 0.63% Year-to-date Change: -55.9% | |
| RPTX Links: Profile News Message Board | |
| Charts:- Daily , Weekly | |
| Add RPTX to Watchlist: View: Get Complete RPTX Trend Analysis ➞ | |
 | PHVS Pharvaris N.V. |
| Sector: Health Care | |
| SubSector: Biotechnology | |
| MarketCap: 475 Millions | |
| Recent Price: 23.47 Market Intelligence Score: 50 | |
| Day Percent Change: 0.51% Day Change: 0.12 | |
| Week Change: 0.51% Year-to-date Change: -17.1% | |
| PHVS Links: Profile News Message Board | |
| Charts:- Daily , Weekly | |
| Add PHVS to Watchlist: View: Get Complete PHVS Trend Analysis ➞ | |
 | KRON Kronos Bio, Inc. |
| Sector: Health Care | |
| SubSector: Biotechnology | |
| MarketCap: 17287 Millions | |
| Recent Price: 1.00 Market Intelligence Score: 30 | |
| Day Percent Change: 0.50% Day Change: 0.00 | |
| Week Change: 0.5% Year-to-date Change: -19.6% | |
| KRON Links: Profile News Message Board | |
| Charts:- Daily , Weekly | |
| Add KRON to Watchlist: View: Get Complete KRON Trend Analysis ➞ | |
 | PCVX Vaxcyte, Inc. |
| Sector: Health Care | |
| SubSector: Biotechnology | |
| MarketCap: 13887 Millions | |
| Recent Price: 61.02 Market Intelligence Score: 50 | |
| Day Percent Change: 0.50% Day Change: 0.30 | |
| Week Change: 0.5% Year-to-date Change: -2.8% | |
| PCVX Links: Profile News Message Board | |
| Charts:- Daily , Weekly | |
| Add PCVX to Watchlist: View: Get Complete PCVX Trend Analysis ➞ | |
 | HALO Halozyme Therapeutics, Inc. |
| Sector: Health Care | |
| SubSector: Biotechnology | |
| MarketCap: 2383.75 Millions | |
| Recent Price: 38.76 Market Intelligence Score: 83 | |
| Day Percent Change: 0.49% Day Change: 0.19 | |
| Week Change: 0.49% Year-to-date Change: 4.9% | |
| HALO Links: Profile News Message Board | |
| Charts:- Daily , Weekly | |
| Add HALO to Watchlist: View: Get Complete HALO Trend Analysis ➞ | |
 | ARCT Arcturus Therapeutics Holdings Inc. |
| Sector: Health Care | |
| SubSector: Biotechnology | |
| MarketCap: 241.385 Millions | |
| Recent Price: 26.68 Market Intelligence Score: 17 | |
| Day Percent Change: 0.49% Day Change: 0.13 | |
| Week Change: 0.49% Year-to-date Change: -15.4% | |
| ARCT Links: Profile News Message Board | |
| Charts:- Daily , Weekly | |
| Add ARCT to Watchlist: View: Get Complete ARCT Trend Analysis ➞ | |
 | GPCR Structure Therapeutics Inc. |
| Sector: Health Care | |
| SubSector: Biotechnology | |
| MarketCap: 1530 Millions | |
| Recent Price: 39.09 Market Intelligence Score: 32 | |
| Day Percent Change: 0.49% Day Change: 0.19 | |
| Week Change: 0.49% Year-to-date Change: 2.7% | |
| GPCR Links: Profile News Message Board | |
| Charts:- Daily , Weekly | |
| Add GPCR to Watchlist: View: Get Complete GPCR Trend Analysis ➞ | |
 | ALXO ALX Oncology Holdings Inc. |
| Sector: Health Care | |
| SubSector: Biotechnology | |
| MarketCap: 41787 Millions | |
| Recent Price: 16.94 Market Intelligence Score: 76 | |
| Day Percent Change: 0.47% Day Change: 0.08 | |
| Week Change: 0.47% Year-to-date Change: 13.8% | |
| ALXO Links: Profile News Message Board | |
| Charts:- Daily , Weekly | |
| Add ALXO to Watchlist: View: Get Complete ALXO Trend Analysis ➞ | |
 | SGMO Sangamo Therapeutics, Inc. |
| Sector: Health Care | |
| SubSector: Biotechnology | |
| MarketCap: 779.285 Millions | |
| Recent Price: 0.52 Market Intelligence Score: 76 | |
| Day Percent Change: 0.44% Day Change: 0.00 | |
| Week Change: 0.44% Year-to-date Change: -4.3% | |
| SGMO Links: Profile News Message Board | |
| Charts:- Daily , Weekly | |
| Add SGMO to Watchlist: View: Get Complete SGMO Trend Analysis ➞ | |
 | NAUT Nautilus Biotechnology, Inc. |
| Sector: Health Care | |
| SubSector: Biotechnology | |
| MarketCap: 458 Millions | |
| Recent Price: 2.50 Market Intelligence Score: 64 | |
| Day Percent Change: 0.40% Day Change: 0.01 | |
| Week Change: 0.4% Year-to-date Change: -24.0% | |
| NAUT Links: Profile News Message Board | |
| Charts:- Daily , Weekly | |
| Add NAUT to Watchlist: View: Get Complete NAUT Trend Analysis ➞ | |
 | AMRN Amarin Corporation plc |
| Sector: Health Care | |
| SubSector: Biotechnology | |
| MarketCap: 4197.45 Millions | |
| Recent Price: 0.88 Market Intelligence Score: 13 | |
| Day Percent Change: 0.39% Day Change: 0.00 | |
| Week Change: 0.39% Year-to-date Change: 1.0% | |
| AMRN Links: Profile News Message Board | |
| Charts:- Daily , Weekly | |
| Add AMRN to Watchlist: View: Get Complete AMRN Trend Analysis ➞ | |
 | RPRX Royalty Pharma plc |
| Sector: Health Care | |
| SubSector: Biotechnology | |
| MarketCap: 28457 Millions | |
| Recent Price: 28.10 Market Intelligence Score: 17 | |
| Day Percent Change: 0.36% Day Change: 0.10 | |
| Week Change: 0.36% Year-to-date Change: 0.0% | |
| RPRX Links: Profile News Message Board | |
| Charts:- Daily , Weekly | |
| Add RPRX to Watchlist: View: Get Complete RPRX Trend Analysis ➞ | |
 | SIGA SIGA Technologies, Inc. |
| Sector: Health Care | |
| SubSector: Biotechnology | |
| MarketCap: 424.285 Millions | |
| Recent Price: 8.82 Market Intelligence Score: 90 | |
| Day Percent Change: 0.34% Day Change: 0.03 | |
| Week Change: 0.34% Year-to-date Change: 57.5% | |
| SIGA Links: Profile News Message Board | |
| Charts:- Daily , Weekly | |
| Add SIGA to Watchlist: View: Get Complete SIGA Trend Analysis ➞ | |
 | INBX Inhibrx, Inc. |
| Sector: Health Care | |
| SubSector: Biotechnology | |
| MarketCap: 14187 Millions | |
| Recent Price: 34.17 Market Intelligence Score: 35 | |
| Day Percent Change: 0.32% Day Change: 0.11 | |
| Week Change: 0.32% Year-to-date Change: -10.1% | |
| INBX Links: Profile News Message Board | |
| Charts:- Daily , Weekly | |
| Add INBX to Watchlist: View: Get Complete INBX Trend Analysis ➞ | |
 | ABOS Acumen Pharmaceuticals, Inc. |
| Sector: Health Care | |
| SubSector: Biotechnology | |
| MarketCap: 199 Millions | |
| Recent Price: 3.18 Market Intelligence Score: 39 | |
| Day Percent Change: 0.32% Day Change: 0.01 | |
| Week Change: 0.32% Year-to-date Change: -17.2% | |
| ABOS Links: Profile News Message Board | |
| Charts:- Daily , Weekly | |
| Add ABOS to Watchlist: View: Get Complete ABOS Trend Analysis ➞ | |
 | ADMA ADMA Biologics, Inc. |
| Sector: Health Care | |
| SubSector: Biotechnology | |
| MarketCap: 204.985 Millions | |
| Recent Price: 6.57 Market Intelligence Score: 90 | |
| Day Percent Change: 0.31% Day Change: 0.02 | |
| Week Change: 0.31% Year-to-date Change: 45.4% | |
| ADMA Links: Profile News Message Board | |
| Charts:- Daily , Weekly | |
| Add ADMA to Watchlist: View: Get Complete ADMA Trend Analysis ➞ | |
 | OMGA Omega Therapeutics, Inc. |
| Sector: Health Care | |
| SubSector: Biotechnology | |
| MarketCap: 304 Millions | |
| Recent Price: 2.27 Market Intelligence Score: 10 | |
| Day Percent Change: 0.22% Day Change: 0.00 | |
| Week Change: 0.22% Year-to-date Change: -24.4% | |
| OMGA Links: Profile News Message Board | |
| Charts:- Daily , Weekly | |
| Add OMGA to Watchlist: View: Get Complete OMGA Trend Analysis ➞ | |
 | EXEL Exelixis, Inc. |
| Sector: Health Care | |
| SubSector: Biotechnology | |
| MarketCap: 5254.75 Millions | |
| Recent Price: 23.75 Market Intelligence Score: 88 | |
| Day Percent Change: 0.21% Day Change: 0.05 | |
| Week Change: 0.21% Year-to-date Change: -1.0% | |
| EXEL Links: Profile News Message Board | |
| Charts:- Daily , Weekly | |
| Add EXEL to Watchlist: View: Get Complete EXEL Trend Analysis ➞ | |
 | ANIP ANI Pharmaceuticals, Inc. |
| Sector: Health Care | |
| SubSector: Biotechnology | |
| MarketCap: 489.285 Millions | |
| Recent Price: 65.50 Market Intelligence Score: 51 | |
| Day Percent Change: 0.21% Day Change: 0.14 | |
| Week Change: 0.21% Year-to-date Change: 18.8% | |
| ANIP Links: Profile News Message Board | |
| Charts:- Daily , Weekly | |
| Add ANIP to Watchlist: View: Get Complete ANIP Trend Analysis ➞ | |
 | DRTS Alpha Tau Medical Ltd. |
| Sector: Health Care | |
| SubSector: Biotechnology | |
| MarketCap: 300 Millions | |
| Recent Price: 2.40 Market Intelligence Score: 10 | |
| Day Percent Change: 0.21% Day Change: 0.00 | |
| Week Change: 0.21% Year-to-date Change: -19.6% | |
| DRTS Links: Profile News Message Board | |
| Charts:- Daily , Weekly | |
| Add DRTS to Watchlist: View: Get Complete DRTS Trend Analysis ➞ | |
 | MRUS Merus N.V. |
| Sector: Health Care | |
| SubSector: Biotechnology | |
| MarketCap: 417.385 Millions | |
| Recent Price: 45.12 Market Intelligence Score: 78 | |
| Day Percent Change: 0.18% Day Change: 0.08 | |
| Week Change: 0.18% Year-to-date Change: 64.1% | |
| MRUS Links: Profile News Message Board | |
| Charts:- Daily , Weekly | |
| Add MRUS to Watchlist: View: Get Complete MRUS Trend Analysis ➞ | |
 | SRPT Sarepta Therapeutics, Inc. |
| Sector: Health Care | |
| SubSector: Biotechnology | |
| MarketCap: 7388.05 Millions | |
| Recent Price: 128.95 Market Intelligence Score: 100 | |
| Day Percent Change: 0.14% Day Change: 0.18 | |
| Week Change: 0.14% Year-to-date Change: 33.7% | |
| SRPT Links: Profile News Message Board | |
| Charts:- Daily , Weekly | |
| Add SRPT to Watchlist: View: Get Complete SRPT Trend Analysis ➞ | |
 | BPMC Blueprint Medicines Corporation |
| Sector: Health Care | |
| SubSector: Biotechnology | |
| MarketCap: 3113.55 Millions | |
| Recent Price: 93.13 Market Intelligence Score: 95 | |
| Day Percent Change: 0.14% Day Change: 0.13 | |
| Week Change: 0.14% Year-to-date Change: 1.0% | |
| BPMC Links: Profile News Message Board | |
| Charts:- Daily , Weekly | |
| Add BPMC to Watchlist: View: Get Complete BPMC Trend Analysis ➞ | |
 | ANNX Annexon, Inc. |
| Sector: Health Care | |
| SubSector: Biotechnology | |
| MarketCap: 94487 Millions | |
| Recent Price: 4.71 Market Intelligence Score: 51 | |
| Day Percent Change: 0.11% Day Change: 0.00 | |
| Week Change: 0.11% Year-to-date Change: 3.2% | |
| ANNX Links: Profile News Message Board | |
| Charts:- Daily , Weekly | |
| Add ANNX to Watchlist: View: Get Complete ANNX Trend Analysis ➞ | |
 | LGND Ligand Pharmaceuticals Incorporated |
| Sector: Health Care | |
| SubSector: Biotechnology | |
| MarketCap: 1344.45 Millions | |
| Recent Price: 70.63 Market Intelligence Score: 20 | |
| Day Percent Change: 0.09% Day Change: 0.06 | |
| Week Change: 0.09% Year-to-date Change: -1.1% | |
| LGND Links: Profile News Message Board | |
| Charts:- Daily , Weekly | |
| Add LGND to Watchlist: View: Get Complete LGND Trend Analysis ➞ | |
| To view more stocks, click on Next / Previous arrows or select different range: 0 - 25 , 25 - 50 , 50 - 75 , 75 - 100 , 100 - 125 , 125 - 150 , 150 - 175 , 175 - 200 , 200 - 225 , 225 - 250 , 250 - 275 , 275 - 300 , 300 - 325 , 325 - 350 , 350 - 375 , 375 - 400 | ||
| Click To Change The Sort Order: By Market Cap or Company Size Performance: Year-to-date, Week and Day | |
| Select Chart Type: | ||
|
Best Stocks Today 12Stocks.com |
© 2024 12Stocks.com Terms & Conditions Privacy Contact Us
All Information Provided Only For Education And Not To Be Used For Investing or Trading. See Terms & Conditions


One More Thing ... Get Best Stocks Delivered Daily!
Never Ever Miss A Move With Our Top Ten Stocks Lists
Find Best Stocks In Any Market - Bull or Bear Market
Take A Peek At Our Top Ten Stocks Lists: Daily, Weekly, Year-to-Date & Top Trends
Find Best Stocks In Any Market - Bull or Bear Market
Take A Peek At Our Top Ten Stocks Lists: Daily, Weekly, Year-to-Date & Top Trends
Biotech Stocks With Best Up Trends [0-bearish to 100-bullish]: Deciphera [100], Mesoblast [100], PTC [100], Agenus [100], Cullinan Oncology[100], Xencor [100], Zura Bio[100], Agios [100], Shattuck Labs[100], Moderna [100], Verrica [100]
Best Biotech Stocks Year-to-Date:
Pieris [6328.57%], Avenue [2757.14%], Precision [2524.66%], Inovio [2154.9%], Assembly [1479.08%], Agenus [1437.63%], NuCana [1265.79%], Adverum nologies[1167.27%], Affimed N.V[776.8%], Mesoblast [547.27%], Corbus [485.6%] Best Biotech Stocks This Week:
Deciphera [71.95%], Vaxxinity [35.33%], Janux [18.32%], Acrivon [18.09%], Ocean Biomedical[17.16%], Ginkgo Bioworks[15.08%], Exscientia [14.5%], Codexis [14.29%], Mesoblast [14.1%], HOOKIPA Pharma[13.62%], PTC [12.57%] Best Biotech Stocks Daily:
Deciphera [71.95%], Vaxxinity [35.33%], Janux [18.32%], Acrivon [18.09%], Ocean Biomedical[17.16%], Ginkgo Bioworks[15.08%], Exscientia [14.50%], Codexis [14.29%], Mesoblast [14.10%], HOOKIPA Pharma[13.62%], PTC [12.57%]