
 Login Sign Up


| |||||
 |  | ||||

| 12Stocks.com Market Intelligence |
Best Biotech Stocks
|
|
| Quick Read: Best Biotech Stocks List By Performances & Trends: Daily, Weekly, Year-to-Date, Market Cap (Size) & Technical Trends | |||
| Best Biotech Stocks Views: Quick Browse View, Summary & Slide Show View | |||
| 12Stocks.com Biotech Stocks Performances & Trends Daily | |||||||||
|
|  The overall market intelligence score is 100 (0-bearish to 100-bullish) which puts Biotech sector in short term bullish trend. The market intelligence score from previous trading session is 60 and hence an improvement of trend.
| ||||||||
Here are the market intelligence trend scores of the most requested Biotech stocks at 12Stocks.com (click stock name for detailed review):
|


| 12Stocks.com: Investing in Biotech sector with Stocks | |
|
The following table helps investors and traders sort through current performance and trends (as measured by market intelligence score) of various
stocks in the Biotech sector. Quick View: Move mouse or cursor over stock symbol (ticker) to view short-term Technical chart and over stock name to view long term chart. Click on  to add stock symbol to your watchlist and to add stock symbol to your watchlist and  to view watchlist. Click on any ticker or stock name for detailed market intelligence report for that stock. to view watchlist. Click on any ticker or stock name for detailed market intelligence report for that stock. |
12Stocks.com Performance of Stocks in Biotech Sector
| Ticker | Stock Name | Watchlist | Category | Recent Price | Market Intelligence Score | Change % | YTD Change% |
| INBX | Inhibrx |   | Biotechnology | 28.20 | 100 | -1.02 | 56.88% |
| REGN | Regeneron | | Biotechnology | 574.73 | 40 | -1.03 | -14.36% |
| ATHA | Athira Pharma | | Biotechnology | 0.39 | 50 | -1.03 | -32.78% |
| ADMA | ADMA Biologics | | Biotechnology | 17.26 | 50 | -1.16 | -0.29% |
| AVXL | Anavex Life | | Biotechnology | 9.64 | 60 | -1.34 | -11.08% |
| VOR | Vor Biopharma | | Biotechnology | 1.97 | 30 | -1.36 | 95.50% |
| QTRX | Quanterix | | Biotechnology | 4.55 | 20 | -1.43 | -54.47% |
| AXON | Axovant | | Biotechnology | 735.94 | 0 | -1.52 | 12.84% |
| VXRT | Vaxart | | Biotechnology | 0.39 | 80 | -1.52 | -46.08% |
| MNOV | MediciNova | | Biotechnology | 1.31 | 30 | -1.53 | -38.57% |
| RPRX | Royalty Pharma | | Biotechnology | 35.98 | 60 | -1.55 | 44.24% |
| RGEN | Repligen | | Biotechnology | 122.32 | 20 | -1.57 | -16.88% |
| OABI | OmniAb | | Biotechnology | 1.60 | 56 | -1.64 | -49.15% |
| LCTX | Lineage Cell | | Biotechnology | 1.17 | 50 | -1.68 | 132.84% |
| FATE | Fate | | Biotechnology | 1.04 | 20 | -1.77 | -32.73% |
| CLLS | Cellectis S.A | | Biotechnology | 2.57 | 30 | -1.77 | 53.89% |
| ACIU | AC Immune | | Biotechnology | 2.04 | 90 | -1.87 | -22.22% |
| STRO | Sutro Biopharma | | Biotechnology | 0.86 | 90 | -1.95 | -53.93% |
| VNDA | Vanda | | Biotechnology | 4.73 | 80 | -1.96 | -5.85% |
| RLYB | Rallybio | | Biotechnology | 0.54 | 50 | -2.03 | -38.13% |
| ILMN | Illumina | | Biotechnology | 97.82 | 30 | -2.14 | -26.31% |
| ATRA | Atara Bio | | Biotechnology | 12.05 | 50 | -2.30 | -13.67% |
| SRPT | Sarepta | | Biotechnology | 18.20 | 30 | -2.53 | -83.50% |
| ENTA | Enanta | | Biotechnology | 8.40 | 100 | -2.61 | 49.39% |
| DBVT | DBV Technologies | | Biotechnology | 9.65 | 20 | -2.65 | 208.74% |
| To view more stocks, click on Next / Previous arrows or select different range: 0 - 25 , 25 - 50 , 50 - 75 , 75 - 100 , 100 - 125 , 125 - 150 , 150 - 175 , 175 - 200 , 200 - 225 , 225 - 250 , 250 - 275 , 275 - 300 , 300 - 325 | ||
 | Click To Change The Sort Order: By Market Cap or Company Size Performance: Year-to-date, Week and Day |  |
|
Get the most comprehensive stock market coverage daily at 12Stocks.com ➞ Best Stocks Today ➞ Best Stocks Weekly ➞ Best Stocks Year-to-Date ➞ Best Stocks Trends ➞  Best Stocks Today 12Stocks.com Best Nasdaq Stocks ➞ Best S&P 500 Stocks ➞ Best Tech Stocks ➞ Best Biotech Stocks ➞ |
| Detailed Overview of Biotech Stocks |
| Biotech Technical Overview, Leaders & Laggards, Top Biotech ETF Funds & Detailed Biotech Stocks List, Charts, Trends & More |
| Biotech Sector: Technical Analysis, Trends & YTD Performance | |
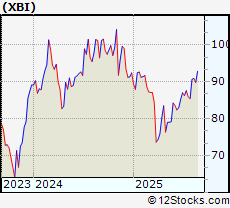
| Biotech sector, as represented by XBI, an exchange-traded fund [ETF] that holds basket of Biotech stocks (e.g, Amgen, Celgene) is up by 0.24% and is currently underperforming the overall market by -6.28% year-to-date. Below is a quick view of Technical charts and trends: | |
 XBI Weekly Chart |
|
| Long Term Trend: Very Good | |
| Medium Term Trend: Very Good | |
 XBI Daily Chart |
|
| Short Term Trend: Very Good | |
| Overall Trend Score: 100 | |
| YTD Performance: 0.24% | |
| **Trend Scores & Views Are Only For Educational Purposes And Not For Investing | |
| 12Stocks.com: Top Performing Biotech Sector Stocks | ||||||||||||||||||||||||||||||||||||||||||||||||
 The top performing Biotech sector stocks year to date are
Now, more recently, over last week, the top performing Biotech sector stocks on the move are


|
||||||||||||||||||||||||||||||||||||||||||||||||
| 12Stocks.com: Investing in Biotech Sector using Exchange Traded Funds | |
|
The following table shows list of key exchange traded funds (ETF) that
help investors track Biotech Index. For detailed view, check out our ETF Funds section of our website. Quick View: Move mouse or cursor over ETF symbol (ticker) to view short-term Technical chart and over ETF name to view long term chart. Click on ticker or stock name for detailed view. Click on to add stock symbol to your watchlist and to view watchlist. |
12Stocks.com List of ETFs that track Biotech Index
| Ticker | ETF Name | Watchlist | Recent Price | Market Intelligence Score | Change % | Week % | Year-to-date % |
| XBI | Biotech | | 92.88 | 100 | 3.37 | 3.37 | 0.24% |
| LABD | Biotech Bear 3X | | 5.75 | 10 | -2.55 | -1.37 | -19.84% |
| IBB | Biotechnology | | 138.22 | 100 | 0.73 | 0.73 | 0.89% |
| IHF | Healthcare Providers | | 47.35 | 80 | 0.25 | 0.25 | -10.02% |
| LABU | Biotech Bull 3X | | 69.35 | 100 | 2.38 | 0.61 | -22.08% |
| IYH | Healthcare | | 57.87 | 90 | -0.31 | 2.14 | -0.44% |
| CURE | Healthcare Bull 3X | | 80.67 | 80 | -1.02 | 6.93 | -12.21% |
| ZBIO | Short Biotech | | 16.00 | 100 | 3.74 | 1.01 | 106.72% |
| IXJ | Global Healthcare | | 87.66 | 70 | 0.82 | 1.4 | -2.62% |
| BBC | Bio Biotechnology Clinical | | 22.70 | 100 | 2.05 | 0.29 | -5.46% |
| FBT | First NYSE | | 171.98 | 90 | -0.15 | 0.66 | 4.14% |
| BIB | Biotechnology | | 55.26 | 100 | 1.03 | 2.47 | 11.53% |
| BBH | Biotech | | 165.18 | 70 | 0.61 | 0.53 | 1.51% |
| BIS | Short Biotech | | 14.42 | 0 | -0.99 | -2.37 | -20.83% |
| PBE | Biotech & Genome | | 68.45 | 100 | 0.31 | 1.64 | 2.9% |
| BBP | Bio Biotechnology Products | | 67.32 | 100 | 0.76 | 1.05 | 12.25% |
| PTH | DWA Healthcare Momentum | | 39.81 | 90 | 0.67 | 0.47 | -1.58% |
| 12Stocks.com: Charts, Trends, Fundamental Data and Performances of Biotech Stocks | |
|
We now take in-depth look at all Biotech stocks including charts, multi-period performances and overall trends (as measured by market intelligence score). One can sort Biotech stocks (click link to choose) by Daily, Weekly and by Year-to-Date performances. Also, one can sort by size of the company or by market capitalization. |
| Select Your Default Chart Type: | |||||
| |||||
| Click on stock symbol or name for detailed view. Click on to add stock symbol to your watchlist and to view watchlist. Quick View: Move mouse or cursor over "Daily" to quickly view daily Technical stock chart and over "Weekly" to view weekly Technical stock chart. | |||||

 | INBX Inhibrx, Inc. |
| Sector: Health Care | |
| SubSector: Biotechnology | |
| MarketCap: 14187 Millions | |
| Recent Price: 28.20 Market Intelligence Score: 100 | |
| Day Percent Change: -1.02% Day Change: -0.25 | |
| Week Change: 0.92% Year-to-date Change: 56.9% | |
| INBX Links: Profile News Message Board | |
| Charts:- Daily , Weekly | |
| Add INBX to Watchlist: View: Get Complete INBX Trend Analysis ➞ | |
 | REGN Regeneron Pharmaceuticals, Inc. |
| Sector: Health Care | |
| SubSector: Biotechnology | |
| MarketCap: 51903.7 Millions | |
| Recent Price: 574.73 Market Intelligence Score: 40 | |
| Day Percent Change: -1.03% Day Change: -5.97 | |
| Week Change: -1.03% Year-to-date Change: -14.4% | |
| REGN Links: Profile News Message Board | |
| Charts:- Daily , Weekly | |
| Add REGN to Watchlist: View: Get Complete REGN Trend Analysis ➞ | |
 | ATHA Athira Pharma, Inc. |
| Sector: Health Care | |
| SubSector: Biotechnology | |
| MarketCap: 92487 Millions | |
| Recent Price: 0.39 Market Intelligence Score: 50 | |
| Day Percent Change: -1.03% Day Change: 0 | |
| Week Change: -0.93% Year-to-date Change: -32.8% | |
| ATHA Links: Profile News Message Board | |
| Charts:- Daily , Weekly | |
| Add ATHA to Watchlist: View: Get Complete ATHA Trend Analysis ➞ | |
 | ADMA ADMA Biologics, Inc. |
| Sector: Health Care | |
| SubSector: Biotechnology | |
| MarketCap: 204.985 Millions | |
| Recent Price: 17.26 Market Intelligence Score: 50 | |
| Day Percent Change: -1.16% Day Change: -0.2 | |
| Week Change: 0.77% Year-to-date Change: -0.3% | |
| ADMA Links: Profile News Message Board | |
| Charts:- Daily , Weekly | |
| Add ADMA to Watchlist: View: Get Complete ADMA Trend Analysis ➞ | |
 | AVXL Anavex Life Sciences Corp. |
| Sector: Health Care | |
| SubSector: Biotechnology | |
| MarketCap: 175.985 Millions | |
| Recent Price: 9.64 Market Intelligence Score: 60 | |
| Day Percent Change: -1.34% Day Change: -0.13 | |
| Week Change: -5.54% Year-to-date Change: -11.1% | |
| AVXL Links: Profile News Message Board | |
| Charts:- Daily , Weekly | |
| Add AVXL to Watchlist: View: Get Complete AVXL Trend Analysis ➞ | |
 | VOR Vor Biopharma Inc. |
| Sector: Health Care | |
| SubSector: Biotechnology | |
| MarketCap: 224 Millions | |
| Recent Price: 1.97 Market Intelligence Score: 30 | |
| Day Percent Change: -1.36% Day Change: -0.03 | |
| Week Change: 9.6% Year-to-date Change: 95.5% | |
| VOR Links: Profile News Message Board | |
| Charts:- Daily , Weekly | |
| Add VOR to Watchlist: View: Get Complete VOR Trend Analysis ➞ | |
 | QTRX Quanterix Corporation |
| Sector: Health Care | |
| SubSector: Biotechnology | |
| MarketCap: 448.685 Millions | |
| Recent Price: 4.55 Market Intelligence Score: 20 | |
| Day Percent Change: -1.43% Day Change: -0.07 | |
| Week Change: 6.61% Year-to-date Change: -54.5% | |
| QTRX Links: Profile News Message Board | |
| Charts:- Daily , Weekly | |
| Add QTRX to Watchlist: View: Get Complete QTRX Trend Analysis ➞ | |
 | AXON Axovant Sciences Ltd. |
| Sector: Health Care | |
| SubSector: Biotechnology | |
| MarketCap: 1492.04 Millions | |
| Recent Price: 735.94 Market Intelligence Score: 0 | |
| Day Percent Change: -1.52% Day Change: -11.35 | |
| Week Change: -1.52% Year-to-date Change: 12.8% | |
| AXON Links: Profile News Message Board | |
| Charts:- Daily , Weekly | |
| Add AXON to Watchlist: View: Get Complete AXON Trend Analysis ➞ | |
 | VXRT Vaxart, Inc. |
| Sector: Health Care | |
| SubSector: Biotechnology | |
| MarketCap: 129.785 Millions | |
| Recent Price: 0.39 Market Intelligence Score: 80 | |
| Day Percent Change: -1.52% Day Change: -0.01 | |
| Week Change: -0.83% Year-to-date Change: -46.1% | |
| VXRT Links: Profile News Message Board | |
| Charts:- Daily , Weekly | |
| Add VXRT to Watchlist: View: Get Complete VXRT Trend Analysis ➞ | |
 | MNOV MediciNova, Inc. |
| Sector: Health Care | |
| SubSector: Biotechnology | |
| MarketCap: 137.685 Millions | |
| Recent Price: 1.31 Market Intelligence Score: 30 | |
| Day Percent Change: -1.53% Day Change: -0.02 | |
| Week Change: -0.77% Year-to-date Change: -38.6% | |
| MNOV Links: Profile News Message Board | |
| Charts:- Daily , Weekly | |
| Add MNOV to Watchlist: View: Get Complete MNOV Trend Analysis ➞ | |
 | RPRX Royalty Pharma plc |
| Sector: Health Care | |
| SubSector: Biotechnology | |
| MarketCap: 28457 Millions | |
| Recent Price: 35.98 Market Intelligence Score: 60 | |
| Day Percent Change: -1.55% Day Change: -0.57 | |
| Week Change: -0.52% Year-to-date Change: 44.2% | |
| RPRX Links: Profile News Message Board | |
| Charts:- Daily , Weekly | |
| Add RPRX to Watchlist: View: Get Complete RPRX Trend Analysis ➞ | |
 | RGEN Repligen Corporation |
| Sector: Health Care | |
| SubSector: Biotechnology | |
| MarketCap: 4711.75 Millions | |
| Recent Price: 122.32 Market Intelligence Score: 20 | |
| Day Percent Change: -1.57% Day Change: -1.91 | |
| Week Change: -5.52% Year-to-date Change: -16.9% | |
| RGEN Links: Profile News Message Board | |
| Charts:- Daily , Weekly | |
| Add RGEN to Watchlist: View: Get Complete RGEN Trend Analysis ➞ | |
 | OABI OmniAb, Inc. |
| Sector: Health Care | |
| SubSector: Biotechnology | |
| MarketCap: 570 Millions | |
| Recent Price: 1.60 Market Intelligence Score: 56 | |
| Day Percent Change: -1.64% Day Change: -0.03 | |
| Week Change: -10% Year-to-date Change: -49.2% | |
| OABI Links: Profile News Message Board | |
| Charts:- Daily , Weekly | |
| Add OABI to Watchlist: View: Get Complete OABI Trend Analysis ➞ | |
 | LCTX Lineage Cell Therapeutics, Inc. |
| Sector: Health Care | |
| SubSector: Biotechnology | |
| MarketCap: 141.285 Millions | |
| Recent Price: 1.17 Market Intelligence Score: 50 | |
| Day Percent Change: -1.68% Day Change: -0.02 | |
| Week Change: 14.71% Year-to-date Change: 132.8% | |
| LCTX Links: Profile News Message Board | |
| Charts:- Daily , Weekly | |
| Add LCTX to Watchlist: View: Get Complete LCTX Trend Analysis ➞ | |
 | FATE Fate Therapeutics, Inc. |
| Sector: Health Care | |
| SubSector: Biotechnology | |
| MarketCap: 2022.45 Millions | |
| Recent Price: 1.04 Market Intelligence Score: 20 | |
| Day Percent Change: -1.77% Day Change: -0.02 | |
| Week Change: 3.74% Year-to-date Change: -32.7% | |
| FATE Links: Profile News Message Board | |
| Charts:- Daily , Weekly | |
| Add FATE to Watchlist: View: Get Complete FATE Trend Analysis ➞ | |
 | CLLS Cellectis S.A. |
| Sector: Health Care | |
| SubSector: Biotechnology | |
| MarketCap: 398.685 Millions | |
| Recent Price: 2.57 Market Intelligence Score: 30 | |
| Day Percent Change: -1.77% Day Change: -0.05 | |
| Week Change: -3.15% Year-to-date Change: 53.9% | |
| CLLS Links: Profile News Message Board | |
| Charts:- Daily , Weekly | |
| Add CLLS to Watchlist: View: Get Complete CLLS Trend Analysis ➞ | |
 | ACIU AC Immune SA |
| Sector: Health Care | |
| SubSector: Biotechnology | |
| MarketCap: 356.585 Millions | |
| Recent Price: 2.04 Market Intelligence Score: 90 | |
| Day Percent Change: -1.87% Day Change: -0.04 | |
| Week Change: -1.41% Year-to-date Change: -22.2% | |
| ACIU Links: Profile News Message Board | |
| Charts:- Daily , Weekly | |
| Add ACIU to Watchlist: View: Get Complete ACIU Trend Analysis ➞ | |
 | STRO Sutro Biopharma, Inc. |
| Sector: Health Care | |
| SubSector: Biotechnology | |
| MarketCap: 196.485 Millions | |
| Recent Price: 0.86 Market Intelligence Score: 90 | |
| Day Percent Change: -1.95% Day Change: -0.02 | |
| Week Change: 8.65% Year-to-date Change: -53.9% | |
| STRO Links: Profile News Message Board | |
| Charts:- Daily , Weekly | |
| Add STRO to Watchlist: View: Get Complete STRO Trend Analysis ➞ | |
 | VNDA Vanda Pharmaceuticals Inc. |
| Sector: Health Care | |
| SubSector: Biotechnology | |
| MarketCap: 464.585 Millions | |
| Recent Price: 4.73 Market Intelligence Score: 80 | |
| Day Percent Change: -1.96% Day Change: -0.09 | |
| Week Change: 1.81% Year-to-date Change: -5.9% | |
| VNDA Links: Profile News Message Board | |
| Charts:- Daily , Weekly | |
| Add VNDA to Watchlist: View: Get Complete VNDA Trend Analysis ➞ | |
 | RLYB Rallybio Corporation |
| Sector: Health Care | |
| SubSector: Biotechnology | |
| MarketCap: 226 Millions | |
| Recent Price: 0.54 Market Intelligence Score: 50 | |
| Day Percent Change: -2.03% Day Change: -0.01 | |
| Week Change: 8.79% Year-to-date Change: -38.1% | |
| RLYB Links: Profile News Message Board | |
| Charts:- Daily , Weekly | |
| Add RLYB to Watchlist: View: Get Complete RLYB Trend Analysis ➞ | |
 | ILMN Illumina, Inc. |
| Sector: Health Care | |
| SubSector: Biotechnology | |
| MarketCap: 39194.3 Millions | |
| Recent Price: 97.82 Market Intelligence Score: 30 | |
| Day Percent Change: -2.14% Day Change: -2.14 | |
| Week Change: -2.14% Year-to-date Change: -26.3% | |
| ILMN Links: Profile News Message Board | |
| Charts:- Daily , Weekly | |
| Add ILMN to Watchlist: View: Get Complete ILMN Trend Analysis ➞ | |
 | ATRA Atara Biotherapeutics, Inc. |
| Sector: Health Care | |
| SubSector: Biotechnology | |
| MarketCap: 579.185 Millions | |
| Recent Price: 12.05 Market Intelligence Score: 50 | |
| Day Percent Change: -2.3% Day Change: -0.27 | |
| Week Change: -1.96% Year-to-date Change: -13.7% | |
| ATRA Links: Profile News Message Board | |
| Charts:- Daily , Weekly | |
| Add ATRA to Watchlist: View: Get Complete ATRA Trend Analysis ➞ | |
 | SRPT Sarepta Therapeutics, Inc. |
| Sector: Health Care | |
| SubSector: Biotechnology | |
| MarketCap: 7388.05 Millions | |
| Recent Price: 18.20 Market Intelligence Score: 30 | |
| Day Percent Change: -2.53% Day Change: -0.52 | |
| Week Change: -1.18% Year-to-date Change: -83.5% | |
| SRPT Links: Profile News Message Board | |
| Charts:- Daily , Weekly | |
| Add SRPT to Watchlist: View: Get Complete SRPT Trend Analysis ➞ | |
 | ENTA Enanta Pharmaceuticals, Inc. |
| Sector: Health Care | |
| SubSector: Biotechnology | |
| MarketCap: 998.385 Millions | |
| Recent Price: 8.40 Market Intelligence Score: 100 | |
| Day Percent Change: -2.61% Day Change: -0.23 | |
| Week Change: 10.98% Year-to-date Change: 49.4% | |
| ENTA Links: Profile News Message Board | |
| Charts:- Daily , Weekly | |
| Add ENTA to Watchlist: View: Get Complete ENTA Trend Analysis ➞ | |
 | DBVT DBV Technologies S.A. |
| Sector: Health Care | |
| SubSector: Biotechnology | |
| MarketCap: 405.885 Millions | |
| Recent Price: 9.65 Market Intelligence Score: 20 | |
| Day Percent Change: -2.65% Day Change: -0.26 | |
| Week Change: -2.85% Year-to-date Change: 208.7% | |
| DBVT Links: Profile News Message Board | |
| Charts:- Daily , Weekly | |
| Add DBVT to Watchlist: View: Get Complete DBVT Trend Analysis ➞ | |
| To view more stocks, click on Next / Previous arrows or select different range: 0 - 25 , 25 - 50 , 50 - 75 , 75 - 100 , 100 - 125 , 125 - 150 , 150 - 175 , 175 - 200 , 200 - 225 , 225 - 250 , 250 - 275 , 275 - 300 , 300 - 325 | ||
| Click To Change The Sort Order: By Market Cap or Company Size Performance: Year-to-date, Week and Day | |
| Select Chart Type: | ||
|
Best Stocks Today 12Stocks.com |
© 2025 12Stocks.com Terms & Conditions Privacy Contact Us
All Information Provided Only For Education And Not To Be Used For Investing or Trading. See Terms & Conditions


One More Thing ... Get Best Stocks Delivered Daily!
Never Ever Miss A Move With Our Top Ten Stocks Lists
Find Best Stocks In Any Market - Bull or Bear Market
Take A Peek At Our Top Ten Stocks Lists: Daily, Weekly, Year-to-Date & Top Trends
Find Best Stocks In Any Market - Bull or Bear Market
Take A Peek At Our Top Ten Stocks Lists: Daily, Weekly, Year-to-Date & Top Trends
Biotech Stocks With Best Up Trends [0-bearish to 100-bullish]: Sol-Gel Technologies[100], Immuneering [100], Precigen [100], Gossamer Bio[100], Fortress [100], Design [100], Terns [100], Keros [100], Coherus [100], Kura Oncology[100], FibroGen [100]
Best Biotech Stocks Year-to-Date:
I Mab[454.12%], Matinas BioPharma[241.18%], Nanobiotix S.A[239.28%], Atai Life[230.08%], Precigen [225%], DBV Technologies[208.74%], Galectin [200.78%], Sol-Gel Technologies[177.39%], Rigel [149.64%], Gossamer Bio[139.89%], Lineage Cell[132.84%] Best Biotech Stocks This Week:
Precigen [96.76%], Sol-Gel Technologies[69.18%], ALX Oncology[57.25%], Immuneering [52.3%], Minerva Neuro[34.54%], Aligos [29.73%], Karyopharm [29.46%], CASI [27.32%], Zentalis [26.35%], Rocket [23.1%], Tenaya [22.51%] Best Biotech Stocks Daily:
Sol-Gel Technologies[40.22%], Immuneering [34.99%], ALX Oncology[23.8%], Tyra [14.26%], Nanobiotix S.A[14.15%], Zentalis [14.02%], Zura Bio[13.71%], X4 [13.57%], Precigen [13.4%], Gossamer Bio[11.28%], Mersana [11.25%]