
 Login Sign Up


| |||||
 |  | ||||

| 12Stocks.com Market Intelligence |
Best S&P 500 Stocks
|
On this page, you will find the most comprehensive analysis of S&P 500 stocks and ETFs - from latest trends to performances to charts ➞. First, here are the year-to-date (YTD) performances of the most requested S&P 500 stocks at 12Stocks.com (click stock for review):
| NVIDIA 67% | ||
| Merck 20% | ||
| Walmart 15% | ||
| Caterpillar 14% | ||
| Amazon.com 14% | ||
| JPMorgan Chase 14% | ||
| Google 12% | ||
| Chevron 11% | ||
| Goldman Sachs 9% | ||
| Microsoft 6% | ||
| Johnson & Johnson -6% | ||
| McDonald s -7% | ||
| Starbucks -9% | ||
| Apple -12% | ||
| Gilead -19% | ||
| Intel -30% | ||
| Boeing -36% | ||
| Quick: S&P 500 Stocks Lists: Performances & Trends, S&P 500 Stock Charts
Sort S&P 500 stocks: Daily, Weekly, Year-to-Date, Market Cap & Trends. Filter S&P 500 stocks list by sector: Show all, Tech, Finance, Energy, Staples, Retail, Industrial, Materials, Utilities and HealthCare |
| 12Stocks.com S&P 500 Stocks Performances & Trends Daily Report | |||||||||
|
| 
The overall Smart Investing & Trading Score is 44 (0-bearish to 100-bullish) which puts S&P 500 index in short term neutral trend. The Smart Investing & Trading Score from previous trading session is 58 and hence a deterioration of trend. | ||||||||
Here are the Smart Investing & Trading Scores of the most requested S&P 500 stocks at 12Stocks.com (click stock name for detailed review):
|


| 12Stocks.com: Top Performing S&P 500 Index Stocks | ||||||||||||||||||||||||||||||||||||||||||||||||
 The top performing S&P 500 Index stocks year to date are
Now, more recently, over last week, the top performing S&P 500 Index stocks on the move are


|
||||||||||||||||||||||||||||||||||||||||||||||||
| 12Stocks.com: Investing in S&P 500 Index with Stocks | |
|
The following table helps investors and traders sort through current performance and trends (as measured by Smart Investing & Trading Score) of various
stocks in the S&P 500 Index. Quick View: Move mouse or cursor over stock symbol (ticker) to view short-term technical chart and over stock name to view long term chart. Click on  to add stock symbol to your watchlist and to add stock symbol to your watchlist and  to view watchlist. Click on any ticker or stock name for detailed market intelligence report for that stock. to view watchlist. Click on any ticker or stock name for detailed market intelligence report for that stock. |
12Stocks.com Performance of Stocks in S&P 500 Index
| Ticker | Stock Name | Watchlist | Category | Recent Price | Smart Investing & Trading Score | Change % | YTD Change% |
| MPC | Marathon |   | Energy | 199.51 | 61 | 0.19 | 34.48% |
| BRO | Brown & Brown | | Financials | 82.28 | 51 | 0.18 | 15.71% |
| GRMN | Garmin | | Technology | 143.03 | 56 | 0.17 | 11.27% |
| CTAS | Cintas | | Services & Goods | 665.25 | 44 | 0.17 | 10.39% |
| APD | Air Products | | Materials | 235.08 | 42 | 0.17 | -14.14% |
| STX | Seagate | | Technology | 87.26 | 68 | 0.17 | 2.21% |
| PLD | Prologis | | Financials | 103.35 | 10 | 0.16 | -22.47% |
| AWK | American Water | | Utilities | 121.55 | 74 | 0.16 | -7.91% |
| JPM | JPMorgan Chase | | Financials | 193.37 | 70 | 0.15 | 13.68% |
| J | Jacobs Engineering | | Services & Goods | 144.18 | 41 | 0.14 | 11.08% |
| HPQ | HP | | Technology | 28.13 | 32 | 0.11 | -6.51% |
| DXCM | DexCom | | Health Care | 138.01 | 80 | 0.10 | 11.22% |
| SYK | Stryker | | Health Care | 337.15 | 38 | 0.09 | 12.59% |
| VLO | Valero | | Energy | 167.13 | 54 | 0.08 | 28.56% |
| WRB | W. R. | | Financials | 77.91 | 0 | 0.08 | 10.17% |
| DUK | Duke | | Utilities | 99.03 | 100 | 0.07 | 2.05% |
| AEE | Ameren | | Utilities | 74.76 | 93 | 0.07 | 3.35% |
| AJG | Arthur J. | | Financials | 236.95 | 51 | 0.06 | 5.37% |
| STZ | Constellation Brands | | Consumer Staples | 261.71 | 61 | 0.06 | 8.26% |
| V | Visa | | Financials | 275.16 | 53 | 0.05 | 5.69% |
| HII | Huntington Ingalls | | Industrials | 275.98 | 51 | 0.05 | 6.29% |
| FICO | Fair Isaac | | Technology | 1193.66 | 55 | 0.05 | 2.55% |
| ALL | Allstate | | Financials | 172.34 | 51 | 0.04 | 23.12% |
| DVA | DaVita | | Health Care | 132.77 | 61 | 0.02 | 26.74% |
| HAL | Halliburton | | Energy | 38.72 | 61 | 0.00 | 7.11% |
| For chart view version of above stock list: Chart View ➞ 0 - 25 , 25 - 50 , 50 - 75 , 75 - 100 , 100 - 125 , 125 - 150 , 150 - 175 , 175 - 200 , 200 - 225 , 225 - 250 , 250 - 275 , 275 - 300 , 300 - 325 , 325 - 350 , 350 - 375 , 375 - 400 , 400 - 425 , 425 - 450 , 450 - 475 , 475 - 500 | ||
 | Click To Change The Sort Order: By Market Cap or Company Size Performance: Year-to-date, Week and Day |  |
|
Get the most comprehensive stock market coverage daily at 12Stocks.com ➞ Best Stocks Today ➞ Best Stocks Weekly ➞ Best Stocks Year-to-Date ➞ Best Stocks Trends ➞  Best Stocks Today 12Stocks.com Best Nasdaq Stocks ➞ Best S&P 500 Stocks ➞ Best Tech Stocks ➞ Best Biotech Stocks ➞ |
| Detailed Overview of S&P 500 Stocks |
| S&P 500 Technical Overview, Leaders & Laggards, Top S&P 500 ETF Funds & Detailed S&P 500 Stocks List, Charts, Trends & More |
| S&P 500: Technical Analysis, Trends & YTD Performance | |
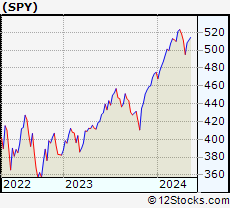
| S&P 500 index as represented by
SPY, an exchange-traded fund [ETF], holds basket of five hundred (mostly largecap) stocks from across all major sectors of the US stock market. The S&P 500 index (contains stocks like Apple and Exxon) is up by 5.93% and is currently outperforming the overall market by 0.77% year-to-date. Below is a quick view of technical charts and trends: | |
 SPY Weekly Chart |
|
| Long Term Trend: Good | |
| Medium Term Trend: Not Good | |
 SPY Daily Chart |
|
| Short Term Trend: Very Good | |
| Overall Trend Score: 44 | |
| YTD Performance: 5.93% | |
| **Trend Scores & Views Are Only For Educational Purposes And Not For Investing | |
| 12Stocks.com: Investing in S&P 500 Index using Exchange Traded Funds | |
|
The following table shows list of key exchange traded funds (ETF) that
help investors track S&P 500 index. The following list also includes leveraged ETF funds that track twice or thrice the daily returns of S&P 500 indices. Short or inverse ETF funds move in the opposite direction to the index they track and are useful during market pullbacks or during bear markets. Quick View: Move mouse or cursor over ETF symbol (ticker) to view short-term technical chart and over ETF name to view long term chart. Click on ticker or stock name for detailed view. Click on to add stock symbol to your watchlist and to view watchlist. |
12Stocks.com List of ETFs that track S&P 500 Index
| Ticker | ETF Name | Watchlist | Recent Price | Smart Investing & Trading Score | Change % | Week % | Year-to-date % |
| SPY | SPDR S&P 500 ETF | | 503.49 | 44 | -0.38 | 1.68 | 5.93% |
| IVV | iShares Core S&P 500 ETF | | 505.82 | 56 | -0.42 | 1.67 | 5.9% |
| VOO | Vanguard 500 ETF | | 462.58 | 56 | -0.41 | 1.64 | 5.9% |
| OEF | iShares S&P 100 | | 238.34 | 44 | -0.60 | 1.56 | 6.69% |
| SSO | ProShares Ultra S&P500 | | 71.32 | 51 | -0.88 | 3.2 | 9.61% |
| UPRO | ProShares UltraPro S&P500 | | 62.03 | 51 | -1.35 | 4.85 | 13.32% |
| SPXL | Direxion Daily S&P500 Bull 3X ETF | | 117.84 | 56 | -1.27 | 4.7 | 13.32% |
| SH | ProShares Short S&P500 | | 12.39 | 57 | 0.49 | -1.59 | -4.62% |
| SDS | ProShares UltraShort S&P500 | | 27.04 | 49 | 0.90 | -3.08 | -9.63% |
| SPXU | ProShares UltraPro Short S&P500 | | 36.52 | 49 | 1.33 | -4.72 | -15.07% |
| SPXS | Direxion Daily S&P 500 Bear 3X ETF | | 9.88 | 32 | 1.33 | -4.63 | -14.46% |
| 12Stocks.com: Charts, Trends, Fundamental Data and Performances of S&P 500 Stocks | |
|
We now take in-depth look at all S&P 500 stocks including charts, multi-period performances and overall trends (as measured by Smart Investing & Trading Score). One can sort S&P 500 stocks (click link to choose) by Daily, Weekly and by Year-to-Date performances. Also, one can sort by size of the company or by market capitalization. |
| Select Your Default Chart Type: | |||||
| |||||
| Click on stock symbol or name for detailed view. Click on to add stock symbol to your watchlist and to view watchlist. Quick View: Move mouse or cursor over "Daily" to quickly view daily technical stock chart and over "Weekly" to view weekly technical stock chart. | |||||

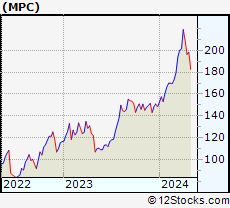 | MPC Marathon Petroleum Corporation |
| Sector: Energy | |
| SubSector: Oil & Gas Refining & Marketing | |
| MarketCap: 16862.4 Millions | |
| Recent Price: 199.51 Smart Investing & Trading Score: 61 | |
| Day Percent Change: 0.19% Day Change: 0.37 | |
| Week Change: 1.59% Year-to-date Change: 34.5% | |
| MPC Links: Profile News Message Board | |
| Charts:- Daily , Weekly | |
| Add MPC to Watchlist: View: Get MPC Trend Analysis ➞ | |
 | BRO Brown & Brown, Inc. |
| Sector: Financials | |
| SubSector: Insurance Brokers | |
| MarketCap: 10475.7 Millions | |
| Recent Price: 82.28 Smart Investing & Trading Score: 51 | |
| Day Percent Change: 0.18% Day Change: 0.15 | |
| Week Change: 0.13% Year-to-date Change: 15.7% | |
| BRO Links: Profile News Message Board | |
| Charts:- Daily , Weekly | |
| Add BRO to Watchlist: View: Get BRO Trend Analysis ➞ | |
 | GRMN Garmin Ltd. |
| Sector: Technology | |
| SubSector: Scientific & Technical Instruments | |
| MarketCap: 13909.3 Millions | |
| Recent Price: 143.03 Smart Investing & Trading Score: 56 | |
| Day Percent Change: 0.17% Day Change: 0.24 | |
| Week Change: 2.52% Year-to-date Change: 11.3% | |
| GRMN Links: Profile News Message Board | |
| Charts:- Daily , Weekly | |
| Add GRMN to Watchlist: View: Get GRMN Trend Analysis ➞ | |
 | CTAS Cintas Corporation |
| Sector: Services & Goods | |
| SubSector: Business Services | |
| MarketCap: 20154.6 Millions | |
| Recent Price: 665.25 Smart Investing & Trading Score: 44 | |
| Day Percent Change: 0.17% Day Change: 1.12 | |
| Week Change: 0.6% Year-to-date Change: 10.4% | |
| CTAS Links: Profile News Message Board | |
| Charts:- Daily , Weekly | |
| Add CTAS to Watchlist: View: Get CTAS Trend Analysis ➞ | |
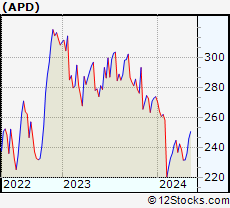 | APD Air Products and Chemicals, Inc. |
| Sector: Materials | |
| SubSector: Chemicals - Major Diversified | |
| MarketCap: 46203.6 Millions | |
| Recent Price: 235.08 Smart Investing & Trading Score: 42 | |
| Day Percent Change: 0.17% Day Change: 0.40 | |
| Week Change: 1.49% Year-to-date Change: -14.1% | |
| APD Links: Profile News Message Board | |
| Charts:- Daily , Weekly | |
| Add APD to Watchlist: View: Get APD Trend Analysis ➞ | |
 | STX Seagate Technology plc |
| Sector: Technology | |
| SubSector: Data Storage Devices | |
| MarketCap: 10814.7 Millions | |
| Recent Price: 87.26 Smart Investing & Trading Score: 68 | |
| Day Percent Change: 0.17% Day Change: 0.15 | |
| Week Change: 5.82% Year-to-date Change: 2.2% | |
| STX Links: Profile News Message Board | |
| Charts:- Daily , Weekly | |
| Add STX to Watchlist: View: Get STX Trend Analysis ➞ | |
 | PLD Prologis, Inc. |
| Sector: Financials | |
| SubSector: REIT - Industrial | |
| MarketCap: 48728.9 Millions | |
| Recent Price: 103.35 Smart Investing & Trading Score: 10 | |
| Day Percent Change: 0.16% Day Change: 0.17 | |
| Week Change: -0.14% Year-to-date Change: -22.5% | |
| PLD Links: Profile News Message Board | |
| Charts:- Daily , Weekly | |
| Add PLD to Watchlist: View: Get PLD Trend Analysis ➞ | |
 | AWK American Water Works Company, Inc. |
| Sector: Utilities | |
| SubSector: Water Utilities | |
| MarketCap: 20029.2 Millions | |
| Recent Price: 121.55 Smart Investing & Trading Score: 74 | |
| Day Percent Change: 0.16% Day Change: 0.19 | |
| Week Change: 2.56% Year-to-date Change: -7.9% | |
| AWK Links: Profile News Message Board | |
| Charts:- Daily , Weekly | |
| Add AWK to Watchlist: View: Get AWK Trend Analysis ➞ | |
 | JPM JPMorgan Chase & Co. |
| Sector: Financials | |
| SubSector: Money Center Banks | |
| MarketCap: 279736 Millions | |
| Recent Price: 193.37 Smart Investing & Trading Score: 70 | |
| Day Percent Change: 0.15% Day Change: 0.29 | |
| Week Change: 4.07% Year-to-date Change: 13.7% | |
| JPM Links: Profile News Message Board | |
| Charts:- Daily , Weekly | |
| Add JPM to Watchlist: View: Get JPM Trend Analysis ➞ | |
 | J Jacobs Engineering Group Inc. |
| Sector: Services & Goods | |
| SubSector: Technical Services | |
| MarketCap: 9714.8 Millions | |
| Recent Price: 144.18 Smart Investing & Trading Score: 41 | |
| Day Percent Change: 0.14% Day Change: 0.20 | |
| Week Change: 0.24% Year-to-date Change: 11.1% | |
| J Links: Profile News Message Board | |
| Charts:- Daily , Weekly | |
| Add J to Watchlist: View: Get J Trend Analysis ➞ | |
 | HPQ HP Inc. |
| Sector: Technology | |
| SubSector: Diversified Computer Systems | |
| MarketCap: 22107.8 Millions | |
| Recent Price: 28.13 Smart Investing & Trading Score: 32 | |
| Day Percent Change: 0.11% Day Change: 0.03 | |
| Week Change: 1.15% Year-to-date Change: -6.5% | |
| HPQ Links: Profile News Message Board | |
| Charts:- Daily , Weekly | |
| Add HPQ to Watchlist: View: Get HPQ Trend Analysis ➞ | |
 | DXCM DexCom, Inc. |
| Sector: Health Care | |
| SubSector: Medical Laboratories & Research | |
| MarketCap: 19559 Millions | |
| Recent Price: 138.01 Smart Investing & Trading Score: 80 | |
| Day Percent Change: 0.10% Day Change: 0.14 | |
| Week Change: 5.58% Year-to-date Change: 11.2% | |
| DXCM Links: Profile News Message Board | |
| Charts:- Daily , Weekly | |
| Add DXCM to Watchlist: View: Get DXCM Trend Analysis ➞ | |
 | SYK Stryker Corporation |
| Sector: Health Care | |
| SubSector: Medical Appliances & Equipment | |
| MarketCap: 59441.3 Millions | |
| Recent Price: 337.15 Smart Investing & Trading Score: 38 | |
| Day Percent Change: 0.09% Day Change: 0.30 | |
| Week Change: 3.6% Year-to-date Change: 12.6% | |
| SYK Links: Profile News Message Board | |
| Charts:- Daily , Weekly | |
| Add SYK to Watchlist: View: Get SYK Trend Analysis ➞ | |
 | VLO Valero Energy Corporation |
| Sector: Energy | |
| SubSector: Oil & Gas Refining & Marketing | |
| MarketCap: 19590.5 Millions | |
| Recent Price: 167.13 Smart Investing & Trading Score: 54 | |
| Day Percent Change: 0.08% Day Change: 0.13 | |
| Week Change: 1.98% Year-to-date Change: 28.6% | |
| VLO Links: Profile News Message Board | |
| Charts:- Daily , Weekly | |
| Add VLO to Watchlist: View: Get VLO Trend Analysis ➞ | |
 | WRB W. R. Berkley Corporation |
| Sector: Financials | |
| SubSector: Property & Casualty Insurance | |
| MarketCap: 9863.82 Millions | |
| Recent Price: 77.91 Smart Investing & Trading Score: 0 | |
| Day Percent Change: 0.08% Day Change: 0.06 | |
| Week Change: -5.45% Year-to-date Change: 10.2% | |
| WRB Links: Profile News Message Board | |
| Charts:- Daily , Weekly | |
| Add WRB to Watchlist: View: Get WRB Trend Analysis ➞ | |
 | DUK Duke Energy Corporation |
| Sector: Utilities | |
| SubSector: Electric Utilities | |
| MarketCap: 56678.2 Millions | |
| Recent Price: 99.03 Smart Investing & Trading Score: 100 | |
| Day Percent Change: 0.07% Day Change: 0.07 | |
| Week Change: 0.8% Year-to-date Change: 2.1% | |
| DUK Links: Profile News Message Board | |
| Charts:- Daily , Weekly | |
| Add DUK to Watchlist: View: Get DUK Trend Analysis ➞ | |
 | AEE Ameren Corporation |
| Sector: Utilities | |
| SubSector: Electric Utilities | |
| MarketCap: 17308.2 Millions | |
| Recent Price: 74.76 Smart Investing & Trading Score: 93 | |
| Day Percent Change: 0.07% Day Change: 0.05 | |
| Week Change: 1.19% Year-to-date Change: 3.4% | |
| AEE Links: Profile News Message Board | |
| Charts:- Daily , Weekly | |
| Add AEE to Watchlist: View: Get AEE Trend Analysis ➞ | |
 | AJG Arthur J. Gallagher & Co. |
| Sector: Financials | |
| SubSector: Insurance Brokers | |
| MarketCap: 14852.2 Millions | |
| Recent Price: 236.95 Smart Investing & Trading Score: 51 | |
| Day Percent Change: 0.06% Day Change: 0.14 | |
| Week Change: 0.16% Year-to-date Change: 5.4% | |
| AJG Links: Profile News Message Board | |
| Charts:- Daily , Weekly | |
| Add AJG to Watchlist: View: Get AJG Trend Analysis ➞ | |
 | STZ Constellation Brands, Inc. |
| Sector: Consumer Staples | |
| SubSector: Beverages - Wineries & Distillers | |
| MarketCap: 27394.5 Millions | |
| Recent Price: 261.71 Smart Investing & Trading Score: 61 | |
| Day Percent Change: 0.06% Day Change: 0.16 | |
| Week Change: 0.39% Year-to-date Change: 8.3% | |
| STZ Links: Profile News Message Board | |
| Charts:- Daily , Weekly | |
| Add STZ to Watchlist: View: Get STZ Trend Analysis ➞ | |
 | V Visa Inc. |
| Sector: Financials | |
| SubSector: Credit Services | |
| MarketCap: 340798 Millions | |
| Recent Price: 275.16 Smart Investing & Trading Score: 53 | |
| Day Percent Change: 0.05% Day Change: 0.14 | |
| Week Change: 1.99% Year-to-date Change: 5.7% | |
| V Links: Profile News Message Board | |
| Charts:- Daily , Weekly | |
| Add V to Watchlist: View: Get V Trend Analysis ➞ | |
 | HII Huntington Ingalls Industries, Inc. |
| Sector: Industrials | |
| SubSector: Aerospace/Defense Products & Services | |
| MarketCap: 7276.11 Millions | |
| Recent Price: 275.98 Smart Investing & Trading Score: 51 | |
| Day Percent Change: 0.05% Day Change: 0.14 | |
| Week Change: 1.59% Year-to-date Change: 6.3% | |
| HII Links: Profile News Message Board | |
| Charts:- Daily , Weekly | |
| Add HII to Watchlist: View: Get HII Trend Analysis ➞ | |
 | FICO Fair Isaac Corporation |
| Sector: Technology | |
| SubSector: Business Software & Services | |
| MarketCap: 7930.98 Millions | |
| Recent Price: 1193.66 Smart Investing & Trading Score: 55 | |
| Day Percent Change: 0.05% Day Change: 0.63 | |
| Week Change: 5.63% Year-to-date Change: 2.6% | |
| FICO Links: Profile News Message Board | |
| Charts:- Daily , Weekly | |
| Add FICO to Watchlist: View: Get FICO Trend Analysis ➞ | |
 | ALL The Allstate Corporation |
| Sector: Financials | |
| SubSector: Property & Casualty Insurance | |
| MarketCap: 25916.6 Millions | |
| Recent Price: 172.34 Smart Investing & Trading Score: 51 | |
| Day Percent Change: 0.04% Day Change: 0.07 | |
| Week Change: -0.36% Year-to-date Change: 23.1% | |
| ALL Links: Profile News Message Board | |
| Charts:- Daily , Weekly | |
| Add ALL to Watchlist: View: Get ALL Trend Analysis ➞ | |
 | DVA DaVita Inc. |
| Sector: Health Care | |
| SubSector: Specialized Health Services | |
| MarketCap: 8954.36 Millions | |
| Recent Price: 132.77 Smart Investing & Trading Score: 61 | |
| Day Percent Change: 0.02% Day Change: 0.03 | |
| Week Change: 3.87% Year-to-date Change: 26.7% | |
| DVA Links: Profile News Message Board | |
| Charts:- Daily , Weekly | |
| Add DVA to Watchlist: View: Get DVA Trend Analysis ➞ | |
 | HAL Halliburton Company |
| Sector: Energy | |
| SubSector: Oil & Gas Equipment & Services | |
| MarketCap: 5419.41 Millions | |
| Recent Price: 38.72 Smart Investing & Trading Score: 61 | |
| Day Percent Change: 0.00% Day Change: 0.00 | |
| Week Change: -0.92% Year-to-date Change: 7.1% | |
| HAL Links: Profile News Message Board | |
| Charts:- Daily , Weekly | |
| Add HAL to Watchlist: View: Get HAL Trend Analysis ➞ | |
| For tabular summary view of above stock list: Summary View ➞ 0 - 25 , 25 - 50 , 50 - 75 , 75 - 100 , 100 - 125 , 125 - 150 , 150 - 175 , 175 - 200 , 200 - 225 , 225 - 250 , 250 - 275 , 275 - 300 , 300 - 325 , 325 - 350 , 350 - 375 , 375 - 400 , 400 - 425 , 425 - 450 , 450 - 475 , 475 - 500 | ||
| Click To Change The Sort Order: By Market Cap or Company Size Performance: Year-to-date, Week and Day | |
| Select Chart Type: | ||
|
Best Stocks Today 12Stocks.com |
© 2024 12Stocks.com Terms & Conditions Privacy Contact Us
All Information Provided Only For Education And Not To Be Used For Investing or Trading. See Terms & Conditions


One More Thing ... Get Best Stocks Delivered Daily!
Never Ever Miss A Move With Our Top Ten Stocks Lists
Find Best Stocks In Any Market - Bull or Bear Market
Take A Peek At Our Top Ten Stocks Lists: Daily, Weekly, Year-to-Date & Top Trends
Find Best Stocks In Any Market - Bull or Bear Market
Take A Peek At Our Top Ten Stocks Lists: Daily, Weekly, Year-to-Date & Top Trends
S&P 500 Stocks With Best Up Trends [0-bearish to 100-bullish]: Newmont [100], Teradyne [100], Chipotle Mexican[100], Dover [100], Merck [100], Northrop Grumman[100], Tractor Supply[100], EQT [100], Microchip [100], Hess [100], Altria [100]
Best S&P 500 Stocks Year-to-Date:
NVIDIA [66.86%], Constellation [60.54%], NRG [40.93%], Chipotle Mexican[36.07%], Targa Resources[35.47%], Marathon [34.48%], Diamondback [33.54%], Western Digital[32.59%], Progressive [31.89%], Eaton [31.68%], Micron [30.75%] Best S&P 500 Stocks This Week:
Hasbro [17.55%], Tesla [15.73%], Tyler Technologies[13.57%], Teradyne [13.48%], Wabtec [13.19%], Globe Life[13.19%], Microchip [12.89%], Monolithic Power[11.63%], Newmont [11.25%], NXP Semiconductors[10.67%], EQT [10.26%] Best S&P 500 Stocks Daily:
Newmont [12.46%], Tyler Technologies[9.32%], Teradyne [8.15%], Carrier Global[7.19%], Chipotle Mexican[6.33%], United Rentals[5.45%], Zebra Technologies[5.40%], Union Pacific[4.99%], Tesla [4.97%], Keurig Dr[4.73%], Dover [4.47%]