
 Login Sign Up


| |||||
 |  | ||||

| 12Stocks.com Market Intelligence |
Best S&P 500 Stocks
|
On this page, you will find the most comprehensive analysis of S&P 500 stocks and ETFs - from latest trends to performances to charts ➞. First, here are the year-to-date (YTD) performances of the most requested S&P 500 stocks at 12Stocks.com (click stock for review):
| NVIDIA 66% | ||
| Caterpillar 23% | ||
| Amazon.com 18% | ||
| Merck 16% | ||
| Google 13% | ||
| JPMorgan Chase 13% | ||
| Walmart 12% | ||
| Goldman Sachs 10% | ||
| Chevron 9% | ||
| Microsoft 8% | ||
| Johnson & Johnson -5% | ||
| McDonald s -7% | ||
| Starbucks -8% | ||
| Apple -13% | ||
| Gilead -17% | ||
| Intel -32% | ||
| Boeing -35% | ||
| Quick: S&P 500 Stocks Lists: Performances & Trends, S&P 500 Stock Charts
Sort S&P 500 stocks: Daily, Weekly, Year-to-Date, Market Cap & Trends. Filter S&P 500 stocks list by sector: Show all, Tech, Finance, Energy, Staples, Retail, Industrial, Materials, Utilities and HealthCare |
| 12Stocks.com S&P 500 Stocks Performances & Trends Daily Report | |||||||||
|
| 
The overall Smart Investing & Trading Score is 58 (0-bearish to 100-bullish) which puts S&P 500 index in short term neutral trend. The Smart Investing & Trading Score from previous trading session is 51 and hence an improvement of trend. | ||||||||
Here are the Smart Investing & Trading Scores of the most requested S&P 500 stocks at 12Stocks.com (click stock name for detailed review):
|


| 12Stocks.com: Top Performing S&P 500 Index Stocks | ||||||||||||||||||||||||||||||||||||||||||||||||
 The top performing S&P 500 Index stocks year to date are
Now, more recently, over last week, the top performing S&P 500 Index stocks on the move are


|
||||||||||||||||||||||||||||||||||||||||||||||||
| 12Stocks.com: Investing in S&P 500 Index with Stocks | |
|
The following table helps investors and traders sort through current performance and trends (as measured by Smart Investing & Trading Score) of various
stocks in the S&P 500 Index. Quick View: Move mouse or cursor over stock symbol (ticker) to view short-term technical chart and over stock name to view long term chart. Click on  to add stock symbol to your watchlist and to add stock symbol to your watchlist and  to view watchlist. Click on any ticker or stock name for detailed market intelligence report for that stock. to view watchlist. Click on any ticker or stock name for detailed market intelligence report for that stock. |
12Stocks.com Performance of Stocks in S&P 500 Index
| Ticker | Stock Name | Watchlist | Category | Recent Price | Smart Investing & Trading Score | Change % | YTD Change% |
| RJF | Raymond James |   | Financials | 127.14 | 75 | 1.32 | 14.03% |
| SCHW | Charles Schwab | | Financials | 75.23 | 100 | 1.31 | 9.35% |
| AMZN | Amazon.com | | Services & Goods | 179.54 | 56 | 1.30 | 18.17% |
| ADBE | Adobe | | Technology | 472.90 | 35 | 1.29 | -20.73% |
| HOLX | Hologic | | Health Care | 77.19 | 68 | 1.27 | 8.03% |
| TRMB | Trimble | | Technology | 59.69 | 68 | 1.27 | 12.20% |
| GOOGL | | Technology | 158.26 | 93 | 1.27 | 13.29% | |
| TTWO | Take-Two Interactive | | Technology | 141.72 | 42 | 1.26 | -11.95% |
| VRTX | Vertex | | Health Care | 404.91 | 57 | 1.25 | -0.49% |
| VFC | V.F | | Consumer Staples | 12.95 | 54 | 1.25 | -31.12% |
| TXN | Texas Instruments | | Technology | 165.47 | 68 | 1.25 | -2.93% |
| GOOG | | Technology | 159.92 | 93 | 1.25 | 13.47% | |
| ALLE | Allegion | | Services & Goods | 126.97 | 58 | 1.24 | 0.22% |
| CBRE | CBRE | | Financials | 87.11 | 58 | 1.24 | -6.42% |
| OTIS | Otis Worldwide | | Industrials | 97.47 | 76 | 1.23 | 8.94% |
| CFG | Citizens Financial | | Financials | 34.97 | 100 | 1.22 | 5.52% |
| SWKS | Skyworks Solutions | | Technology | 99.30 | 32 | 1.21 | -11.67% |
| SPY | SPDR S&P | | Utilities | 505.65 | 58 | 1.19 | 6.38% |
| CDW | CDW | | Technology | 240.47 | 58 | 1.19 | 5.78% |
| DOV | Dover | | Industrials | 172.29 | 68 | 1.18 | 12.01% |
| AOS | A. O. | | Industrials | 87.92 | 83 | 1.17 | 6.65% |
| T | AT&T | | Technology | 16.50 | 39 | 1.16 | -1.67% |
| PSX | Phillips 66 | | Energy | 158.84 | 68 | 1.14 | 19.30% |
| AME | AMETEK | | Industrials | 179.85 | 63 | 1.12 | 9.07% |
| AMT | American Tower | | Financials | 174.18 | 32 | 1.09 | -19.32% |
| For chart view version of above stock list: Chart View ➞ 0 - 25 , 25 - 50 , 50 - 75 , 75 - 100 , 100 - 125 , 125 - 150 , 150 - 175 , 175 - 200 , 200 - 225 , 225 - 250 , 250 - 275 , 275 - 300 , 300 - 325 , 325 - 350 , 350 - 375 , 375 - 400 , 400 - 425 , 425 - 450 , 450 - 475 , 475 - 500 | ||
 | Click To Change The Sort Order: By Market Cap or Company Size Performance: Year-to-date, Week and Day |  |
|
Get the most comprehensive stock market coverage daily at 12Stocks.com ➞ Best Stocks Today ➞ Best Stocks Weekly ➞ Best Stocks Year-to-Date ➞ Best Stocks Trends ➞  Best Stocks Today 12Stocks.com Best Nasdaq Stocks ➞ Best S&P 500 Stocks ➞ Best Tech Stocks ➞ Best Biotech Stocks ➞ |
| Detailed Overview of S&P 500 Stocks |
| S&P 500 Technical Overview, Leaders & Laggards, Top S&P 500 ETF Funds & Detailed S&P 500 Stocks List, Charts, Trends & More |
| S&P 500: Technical Analysis, Trends & YTD Performance | |
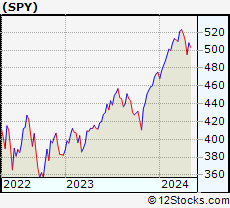
| S&P 500 index as represented by
SPY, an exchange-traded fund [ETF], holds basket of five hundred (mostly largecap) stocks from across all major sectors of the US stock market. The S&P 500 index (contains stocks like Apple and Exxon) is up by 6.38% and is currently outperforming the overall market by 0.74% year-to-date. Below is a quick view of technical charts and trends: | |
 SPY Weekly Chart |
|
| Long Term Trend: Good | |
| Medium Term Trend: Not Good | |
 SPY Daily Chart |
|
| Short Term Trend: Very Good | |
| Overall Trend Score: 58 | |
| YTD Performance: 6.38% | |
| **Trend Scores & Views Are Only For Educational Purposes And Not For Investing | |
| 12Stocks.com: Investing in S&P 500 Index using Exchange Traded Funds | |
|
The following table shows list of key exchange traded funds (ETF) that
help investors track S&P 500 index. The following list also includes leveraged ETF funds that track twice or thrice the daily returns of S&P 500 indices. Short or inverse ETF funds move in the opposite direction to the index they track and are useful during market pullbacks or during bear markets. Quick View: Move mouse or cursor over ETF symbol (ticker) to view short-term technical chart and over ETF name to view long term chart. Click on ticker or stock name for detailed view. Click on to add stock symbol to your watchlist and to view watchlist. |
12Stocks.com List of ETFs that track S&P 500 Index
| Ticker | ETF Name | Watchlist | Recent Price | Smart Investing & Trading Score | Change % | Week % | Year-to-date % |
| SPY | SPDR S&P 500 ETF | | 505.65 | 58 | 1.19 | 2.12 | 6.38% |
| IVV | iShares Core S&P 500 ETF | | 508.17 | 63 | 2.00 | 2.14 | 6.39% |
| VOO | Vanguard 500 ETF | | 464.84 | 63 | 2.03 | 2.14 | 6.42% |
| OEF | iShares S&P 100 | | 239.95 | 58 | 1.33 | 2.25 | 7.41% |
| SSO | ProShares Ultra S&P500 | | 72.04 | 58 | 2.43 | 4.24 | 10.71% |
| UPRO | ProShares UltraPro S&P500 | | 62.93 | 58 | 3.59 | 6.37 | 14.96% |
| SPXL | Direxion Daily S&P500 Bull 3X ETF | | 119.51 | 63 | 3.52 | 6.18 | 14.92% |
| SH | ProShares Short S&P500 | | 12.34 | 42 | -1.20 | -1.99 | -5% |
| SDS | ProShares UltraShort S&P500 | | 26.78 | 37 | -2.30 | -4.01 | -10.49% |
| SPXU | ProShares UltraPro Short S&P500 | | 35.99 | 42 | -3.62 | -6.1 | -16.3% |
| SPXS | Direxion Daily S&P 500 Bear 3X ETF | | 9.75 | 32 | -5.43 | -5.89 | -15.58% |
| 12Stocks.com: Charts, Trends, Fundamental Data and Performances of S&P 500 Stocks | |
|
We now take in-depth look at all S&P 500 stocks including charts, multi-period performances and overall trends (as measured by Smart Investing & Trading Score). One can sort S&P 500 stocks (click link to choose) by Daily, Weekly and by Year-to-Date performances. Also, one can sort by size of the company or by market capitalization. |
| Select Your Default Chart Type: | |||||
| |||||
| Click on stock symbol or name for detailed view. Click on to add stock symbol to your watchlist and to view watchlist. Quick View: Move mouse or cursor over "Daily" to quickly view daily technical stock chart and over "Weekly" to view weekly technical stock chart. | |||||
 | RJF Raymond James Financial, Inc. |
| Sector: Financials | |
| SubSector: Investment Brokerage - Regional | |
| MarketCap: 9490.65 Millions | |
| Recent Price: 127.14 Smart Investing & Trading Score: 75 | |
| Day Percent Change: 1.32% Day Change: 1.66 | |
| Week Change: 2.86% Year-to-date Change: 14.0% | |
| RJF Links: Profile News Message Board | |
| Charts:- Daily , Weekly | |
| Add RJF to Watchlist: View: Get RJF Trend Analysis ➞ | |
 | SCHW The Charles Schwab Corporation |
| Sector: Financials | |
| SubSector: Investment Brokerage - National | |
| MarketCap: 45115.8 Millions | |
| Recent Price: 75.23 Smart Investing & Trading Score: 100 | |
| Day Percent Change: 1.31% Day Change: 0.97 | |
| Week Change: 2.47% Year-to-date Change: 9.4% | |
| SCHW Links: Profile News Message Board | |
| Charts:- Daily , Weekly | |
| Add SCHW to Watchlist: View: Get SCHW Trend Analysis ➞ | |
 | AMZN Amazon.com, Inc. |
| Sector: Services & Goods | |
| SubSector: Catalog & Mail Order Houses | |
| MarketCap: 998070 Millions | |
| Recent Price: 179.54 Smart Investing & Trading Score: 56 | |
| Day Percent Change: 1.30% Day Change: 2.31 | |
| Week Change: 2.81% Year-to-date Change: 18.2% | |
| AMZN Links: Profile News Message Board | |
| Charts:- Daily , Weekly | |
| Add AMZN to Watchlist: View: Get AMZN Trend Analysis ➞ | |
 | ADBE Adobe Inc. |
| Sector: Technology | |
| SubSector: Application Software | |
| MarketCap: 157868 Millions | |
| Recent Price: 472.90 Smart Investing & Trading Score: 35 | |
| Day Percent Change: 1.29% Day Change: 6.01 | |
| Week Change: 1.69% Year-to-date Change: -20.7% | |
| ADBE Links: Profile News Message Board | |
| Charts:- Daily , Weekly | |
| Add ADBE to Watchlist: View: Get ADBE Trend Analysis ➞ | |
 | HOLX Hologic, Inc. |
| Sector: Health Care | |
| SubSector: Medical Instruments & Supplies | |
| MarketCap: 9075.2 Millions | |
| Recent Price: 77.19 Smart Investing & Trading Score: 68 | |
| Day Percent Change: 1.27% Day Change: 0.97 | |
| Week Change: 2.4% Year-to-date Change: 8.0% | |
| HOLX Links: Profile News Message Board | |
| Charts:- Daily , Weekly | |
| Add HOLX to Watchlist: View: Get HOLX Trend Analysis ➞ | |
 | TRMB Trimble Inc. |
| Sector: Technology | |
| SubSector: Scientific & Technical Instruments | |
| MarketCap: 7990.33 Millions | |
| Recent Price: 59.69 Smart Investing & Trading Score: 68 | |
| Day Percent Change: 1.27% Day Change: 0.75 | |
| Week Change: 2.97% Year-to-date Change: 12.2% | |
| TRMB Links: Profile News Message Board | |
| Charts:- Daily , Weekly | |
| Add TRMB to Watchlist: View: Get TRMB Trend Analysis ➞ | |
 | GOOGL Alphabet Inc. |
| Sector: Technology | |
| SubSector: Internet Information Providers | |
| MarketCap: 801264 Millions | |
| Recent Price: 158.26 Smart Investing & Trading Score: 93 | |
| Day Percent Change: 1.27% Day Change: 1.98 | |
| Week Change: 2.71% Year-to-date Change: 13.3% | |
| GOOGL Links: Profile News Message Board | |
| Charts:- Daily , Weekly | |
| Add GOOGL to Watchlist: View: Get GOOGL Trend Analysis ➞ | |
 | TTWO Take-Two Interactive Software, Inc. |
| Sector: Technology | |
| SubSector: Multimedia & Graphics Software | |
| MarketCap: 12479.6 Millions | |
| Recent Price: 141.72 Smart Investing & Trading Score: 42 | |
| Day Percent Change: 1.26% Day Change: 1.76 | |
| Week Change: 0.8% Year-to-date Change: -12.0% | |
| TTWO Links: Profile News Message Board | |
| Charts:- Daily , Weekly | |
| Add TTWO to Watchlist: View: Get TTWO Trend Analysis ➞ | |
 | VRTX Vertex Pharmaceuticals Incorporated |
| Sector: Health Care | |
| SubSector: Biotechnology | |
| MarketCap: 57669.6 Millions | |
| Recent Price: 404.91 Smart Investing & Trading Score: 57 | |
| Day Percent Change: 1.25% Day Change: 4.99 | |
| Week Change: 2.7% Year-to-date Change: -0.5% | |
| VRTX Links: Profile News Message Board | |
| Charts:- Daily , Weekly | |
| Add VRTX to Watchlist: View: Get VRTX Trend Analysis ➞ | |
 | VFC V.F. Corporation |
| Sector: Consumer Staples | |
| SubSector: Textile - Apparel Clothing | |
| MarketCap: 23607.5 Millions | |
| Recent Price: 12.95 Smart Investing & Trading Score: 54 | |
| Day Percent Change: 1.25% Day Change: 0.16 | |
| Week Change: 0.94% Year-to-date Change: -31.1% | |
| VFC Links: Profile News Message Board | |
| Charts:- Daily , Weekly | |
| Add VFC to Watchlist: View: Get VFC Trend Analysis ➞ | |
 | TXN Texas Instruments Incorporated |
| Sector: Technology | |
| SubSector: Semiconductor - Broad Line | |
| MarketCap: 99509.1 Millions | |
| Recent Price: 165.47 Smart Investing & Trading Score: 68 | |
| Day Percent Change: 1.25% Day Change: 2.04 | |
| Week Change: 3.63% Year-to-date Change: -2.9% | |
| TXN Links: Profile News Message Board | |
| Charts:- Daily , Weekly | |
| Add TXN to Watchlist: View: Get TXN Trend Analysis ➞ | |
 | GOOG Alphabet Inc. |
| Sector: Technology | |
| SubSector: Internet Information Providers | |
| MarketCap: 730159 Millions | |
| Recent Price: 159.92 Smart Investing & Trading Score: 93 | |
| Day Percent Change: 1.25% Day Change: 1.97 | |
| Week Change: 2.7% Year-to-date Change: 13.5% | |
| GOOG Links: Profile News Message Board | |
| Charts:- Daily , Weekly | |
| Add GOOG to Watchlist: View: Get GOOG Trend Analysis ➞ | |
 | ALLE Allegion plc |
| Sector: Services & Goods | |
| SubSector: Security & Protection Services | |
| MarketCap: 8515.93 Millions | |
| Recent Price: 126.97 Smart Investing & Trading Score: 58 | |
| Day Percent Change: 1.24% Day Change: 1.55 | |
| Week Change: 1.41% Year-to-date Change: 0.2% | |
| ALLE Links: Profile News Message Board | |
| Charts:- Daily , Weekly | |
| Add ALLE to Watchlist: View: Get ALLE Trend Analysis ➞ | |
 | CBRE CBRE Group, Inc. |
| Sector: Financials | |
| SubSector: Property Management | |
| MarketCap: 12799.2 Millions | |
| Recent Price: 87.11 Smart Investing & Trading Score: 58 | |
| Day Percent Change: 1.24% Day Change: 1.07 | |
| Week Change: 2.6% Year-to-date Change: -6.4% | |
| CBRE Links: Profile News Message Board | |
| Charts:- Daily , Weekly | |
| Add CBRE to Watchlist: View: Get CBRE Trend Analysis ➞ | |
 | OTIS Otis Worldwide Corporation |
| Sector: Industrials | |
| SubSector: Specialty Industrial Machinery | |
| MarketCap: 27727 Millions | |
| Recent Price: 97.47 Smart Investing & Trading Score: 76 | |
| Day Percent Change: 1.23% Day Change: 1.18 | |
| Week Change: 1.76% Year-to-date Change: 8.9% | |
| OTIS Links: Profile News Message Board | |
| Charts:- Daily , Weekly | |
| Add OTIS to Watchlist: View: Get OTIS Trend Analysis ➞ | |
 | CFG Citizens Financial Group, Inc. |
| Sector: Financials | |
| SubSector: Regional - Mid-Atlantic Banks | |
| MarketCap: 8225.19 Millions | |
| Recent Price: 34.97 Smart Investing & Trading Score: 100 | |
| Day Percent Change: 1.22% Day Change: 0.42 | |
| Week Change: 2.88% Year-to-date Change: 5.5% | |
| CFG Links: Profile News Message Board | |
| Charts:- Daily , Weekly | |
| Add CFG to Watchlist: View: Get CFG Trend Analysis ➞ | |
 | SWKS Skyworks Solutions, Inc. |
| Sector: Technology | |
| SubSector: Semiconductor - Integrated Circuits | |
| MarketCap: 13981 Millions | |
| Recent Price: 99.30 Smart Investing & Trading Score: 32 | |
| Day Percent Change: 1.21% Day Change: 1.19 | |
| Week Change: 3.32% Year-to-date Change: -11.7% | |
| SWKS Links: Profile News Message Board | |
| Charts:- Daily , Weekly | |
| Add SWKS to Watchlist: View: Get SWKS Trend Analysis ➞ | |
 | SPY SPDR S&P 500 ETF |
| Sector: Utilities | |
| SubSector: Exchange Traded Fund | |
| MarketCap: 0 Millions | |
| Recent Price: 505.65 Smart Investing & Trading Score: 58 | |
| Day Percent Change: 1.19% Day Change: 5.93 | |
| Week Change: 2.12% Year-to-date Change: 6.4% | |
| SPY Links: Profile News Message Board | |
| Charts:- Daily , Weekly | |
| Add SPY to Watchlist: View: Get SPY Trend Analysis ➞ | |
 | CDW CDW Corporation |
| Sector: Technology | |
| SubSector: Information Technology Services | |
| MarketCap: 12775 Millions | |
| Recent Price: 240.47 Smart Investing & Trading Score: 58 | |
| Day Percent Change: 1.19% Day Change: 2.83 | |
| Week Change: 1.99% Year-to-date Change: 5.8% | |
| CDW Links: Profile News Message Board | |
| Charts:- Daily , Weekly | |
| Add CDW to Watchlist: View: Get CDW Trend Analysis ➞ | |
 | DOV Dover Corporation |
| Sector: Industrials | |
| SubSector: Diversified Machinery | |
| MarketCap: 10725.6 Millions | |
| Recent Price: 172.29 Smart Investing & Trading Score: 68 | |
| Day Percent Change: 1.18% Day Change: 2.01 | |
| Week Change: 1.44% Year-to-date Change: 12.0% | |
| DOV Links: Profile News Message Board | |
| Charts:- Daily , Weekly | |
| Add DOV to Watchlist: View: Get DOV Trend Analysis ➞ | |
 | AOS A. O. Smith Corporation |
| Sector: Industrials | |
| SubSector: Industrial Electrical Equipment | |
| MarketCap: 5809.89 Millions | |
| Recent Price: 87.92 Smart Investing & Trading Score: 83 | |
| Day Percent Change: 1.17% Day Change: 1.02 | |
| Week Change: 2.15% Year-to-date Change: 6.7% | |
| AOS Links: Profile News Message Board | |
| Charts:- Daily , Weekly | |
| Add AOS to Watchlist: View: Get AOS Trend Analysis ➞ | |
 | T AT&T Inc. |
| Sector: Technology | |
| SubSector: Telecom Services - Domestic | |
| MarketCap: 224847 Millions | |
| Recent Price: 16.50 Smart Investing & Trading Score: 39 | |
| Day Percent Change: 1.16% Day Change: 0.19 | |
| Week Change: -0.06% Year-to-date Change: -1.7% | |
| T Links: Profile News Message Board | |
| Charts:- Daily , Weekly | |
| Add T to Watchlist: View: Get T Trend Analysis ➞ | |
 | PSX Phillips 66 |
| Sector: Energy | |
| SubSector: Oil & Gas Refining & Marketing | |
| MarketCap: 25253.6 Millions | |
| Recent Price: 158.84 Smart Investing & Trading Score: 68 | |
| Day Percent Change: 1.14% Day Change: 1.79 | |
| Week Change: 2.67% Year-to-date Change: 19.3% | |
| PSX Links: Profile News Message Board | |
| Charts:- Daily , Weekly | |
| Add PSX to Watchlist: View: Get PSX Trend Analysis ➞ | |
 | AME AMETEK, Inc. |
| Sector: Industrials | |
| SubSector: Diversified Machinery | |
| MarketCap: 16611.8 Millions | |
| Recent Price: 179.85 Smart Investing & Trading Score: 63 | |
| Day Percent Change: 1.12% Day Change: 1.99 | |
| Week Change: 1.21% Year-to-date Change: 9.1% | |
| AME Links: Profile News Message Board | |
| Charts:- Daily , Weekly | |
| Add AME to Watchlist: View: Get AME Trend Analysis ➞ | |
 | AMT American Tower Corporation (REIT) |
| Sector: Financials | |
| SubSector: REIT - Diversified | |
| MarketCap: 92527 Millions | |
| Recent Price: 174.18 Smart Investing & Trading Score: 32 | |
| Day Percent Change: 1.09% Day Change: 1.88 | |
| Week Change: 1.68% Year-to-date Change: -19.3% | |
| AMT Links: Profile News Message Board | |
| Charts:- Daily , Weekly | |
| Add AMT to Watchlist: View: Get AMT Trend Analysis ➞ | |
| For tabular summary view of above stock list: Summary View ➞ 0 - 25 , 25 - 50 , 50 - 75 , 75 - 100 , 100 - 125 , 125 - 150 , 150 - 175 , 175 - 200 , 200 - 225 , 225 - 250 , 250 - 275 , 275 - 300 , 300 - 325 , 325 - 350 , 350 - 375 , 375 - 400 , 400 - 425 , 425 - 450 , 450 - 475 , 475 - 500 | ||
| Click To Change The Sort Order: By Market Cap or Company Size Performance: Year-to-date, Week and Day | |
| Select Chart Type: | ||
|
Best Stocks Today 12Stocks.com |
© 2024 12Stocks.com Terms & Conditions Privacy Contact Us
All Information Provided Only For Education And Not To Be Used For Investing or Trading. See Terms & Conditions


One More Thing ... Get Best Stocks Delivered Daily!
Never Ever Miss A Move With Our Top Ten Stocks Lists
Find Best Stocks In Any Market - Bull or Bear Market
Take A Peek At Our Top Ten Stocks Lists: Daily, Weekly, Year-to-Date & Top Trends
Find Best Stocks In Any Market - Bull or Bear Market
Take A Peek At Our Top Ten Stocks Lists: Daily, Weekly, Year-to-Date & Top Trends
S&P 500 Stocks With Best Up Trends [0-bearish to 100-bullish]: Danaher [100], Kimberly-Clark [100], Quest Diagnostics[100], Hasbro [100], Philip Morris[100], Citi [100], American Express[100], Truist Financial[100], Morgan Stanley[100], Federal Realty[100], Bank of America[100]
Best S&P 500 Stocks Year-to-Date:
NVIDIA [66.44%], Constellation [60.75%], Meta Platforms[40.09%], NRG [38.28%], Marathon [34.57%], Progressive [34.37%], Targa Resources[33.54%], Western Digital[33.51%], Micron [31.78%], Diamondback [31.78%], United Airlines[30.95%] Best S&P 500 Stocks This Week:
Globe Life[13.52%], General Electric[9.83%], NVIDIA [8.17%], Danaher [7.47%], Kimberly-Clark [7.26%], Pulte [6.95%], Norwegian Cruise[6.83%], Ford Motor[6.59%], Enphase [6.57%], General Motors[6.44%], Quest Diagnostics[6.43%] Best S&P 500 Stocks Daily:
Globe Life[14.11%], General Electric[8.28%], Danaher [7.21%], Kimberly-Clark [5.51%], Norwegian Cruise[5.39%], United Rentals[5.09%], Quest Diagnostics[5.08%], Builders FirstSource[5.07%], Thermo Fisher[4.78%], Waters [4.70%], Pulte [4.57%]