
 Login Sign Up


| |||||
 |  | ||||

| 12Stocks.com Market Intelligence |
Best S&P 500 Stocks
|
On this page, you will find the most comprehensive analysis of S&P 500 stocks and ETFs - from latest trends to performances to charts ➞. First, here are the year-to-date (YTD) performances of the most requested S&P 500 stocks at 12Stocks.com (click stock for review):
| NVIDIA 68% | ||
| Merck 18% | ||
| Amazon.com 18% | ||
| Google 17% | ||
| JPMorgan Chase 13% | ||
| Walmart 12% | ||
| Caterpillar 12% | ||
| Goldman Sachs 11% | ||
| Chevron 7% | ||
| Microsoft 5% | ||
| Johnson & Johnson -4% | ||
| McDonald s -7% | ||
| Apple -12% | ||
| Gilead -19% | ||
| Starbucks -22% | ||
| Boeing -34% | ||
| Intel -40% | ||
| Quick: S&P 500 Stocks Lists: Performances & Trends, S&P 500 Stock Charts
Sort S&P 500 stocks: Daily, Weekly, Year-to-Date, Market Cap & Trends. Filter S&P 500 stocks list by sector: Show all, Tech, Finance, Energy, Staples, Retail, Industrial, Materials, Utilities and HealthCare |
| 12Stocks.com S&P 500 Stocks Performances & Trends Daily Report | |||||||||
|
| 
The overall Smart Investing & Trading Score is 38 (0-bearish to 100-bullish) which puts S&P 500 index in short term bearish to neutral trend. The Smart Investing & Trading Score from previous trading session is 41 and hence a deterioration of trend. | ||||||||
Here are the Smart Investing & Trading Scores of the most requested S&P 500 stocks at 12Stocks.com (click stock name for detailed review):
|


| 12Stocks.com: Top Performing S&P 500 Index Stocks | ||||||||||||||||||||||||||||||||||||||||||||||||
 The top performing S&P 500 Index stocks year to date are
Now, more recently, over last week, the top performing S&P 500 Index stocks on the move are


|
||||||||||||||||||||||||||||||||||||||||||||||||
| 12Stocks.com: Investing in S&P 500 Index with Stocks | |
|
The following table helps investors and traders sort through current performance and trends (as measured by Smart Investing & Trading Score) of various
stocks in the S&P 500 Index. Quick View: Move mouse or cursor over stock symbol (ticker) to view short-term technical chart and over stock name to view long term chart. Click on  to add stock symbol to your watchlist and to add stock symbol to your watchlist and  to view watchlist. Click on any ticker or stock name for detailed market intelligence report for that stock. to view watchlist. Click on any ticker or stock name for detailed market intelligence report for that stock. |
12Stocks.com Performance of Stocks in S&P 500 Index
| Ticker | Stock Name | Watchlist | Category | Recent Price | Smart Investing & Trading Score | Change % | YTD Change% |
| MLM | Martin Marietta |   | Industrials | 590.86 | 51 | 0.65 | 18.43% |
| FICO | Fair Isaac | | Technology | 1140.73 | 42 | 0.65 | -2.00% |
| ATO | Atmos | | Utilities | 118.66 | 100 | 0.64 | 2.38% |
| FDS | FactSet Research | | Technology | 419.57 | 42 | 0.64 | -12.05% |
| TROW | T. Rowe | | Financials | 110.27 | 22 | 0.64 | 2.40% |
| AON | Aon | | Financials | 283.81 | 18 | 0.64 | -2.48% |
| HOLX | Hologic | | Health Care | 76.25 | 76 | 0.63 | 6.72% |
| CNP | CenterPoint | | Utilities | 29.32 | 95 | 0.62 | 2.63% |
| BMY | Bristol-Myers | | Health Care | 44.21 | 20 | 0.61 | -13.84% |
| EXPD | Expeditors | | Transports | 111.99 | 28 | 0.61 | -11.96% |
| GOOGL | | Technology | 163.78 | 73 | 0.61 | 17.25% | |
| BIIB | Biogen | | Health Care | 216.11 | 87 | 0.60 | -16.49% |
| DOW | Dow | | Materials | 57.23 | 61 | 0.58 | 4.36% |
| LEN | Lennar | | Industrials | 152.47 | 18 | 0.56 | 2.30% |
| GOOG | | Technology | 165.57 | 73 | 0.56 | 17.48% | |
| JBHT | J.B. Hunt | | Transports | 163.47 | 42 | 0.55 | -18.16% |
| SWK | Stanley Black | | Industrials | 91.90 | 88 | 0.55 | -6.32% |
| CE | Celanese | | Materials | 154.44 | 66 | 0.54 | -0.60% |
| FTNT | Fortinet | | Technology | 63.52 | 25 | 0.54 | 8.53% |
| DVA | DaVita | | Health Care | 139.75 | 95 | 0.53 | 33.40% |
| CB | Chubb | | Financials | 249.93 | 60 | 0.52 | 10.59% |
| AAL | American Airlines | | Transports | 13.58 | 15 | 0.52 | -1.16% |
| MCD | McDonald s | | Services & Goods | 274.43 | 45 | 0.51 | -7.45% |
| PAYX | Paychex | | Services & Goods | 119.41 | 52 | 0.51 | 0.25% |
| XRAY | DENTSPLY SIRONA | | Health Care | 30.16 | 35 | 0.50 | -15.26% |
| For chart view version of above stock list: Chart View ➞ 0 - 25 , 25 - 50 , 50 - 75 , 75 - 100 , 100 - 125 , 125 - 150 , 150 - 175 , 175 - 200 , 200 - 225 , 225 - 250 , 250 - 275 , 275 - 300 , 300 - 325 , 325 - 350 , 350 - 375 , 375 - 400 , 400 - 425 , 425 - 450 , 450 - 475 , 475 - 500 | ||
 | Click To Change The Sort Order: By Market Cap or Company Size Performance: Year-to-date, Week and Day |  |
|
Get the most comprehensive stock market coverage daily at 12Stocks.com ➞ Best Stocks Today ➞ Best Stocks Weekly ➞ Best Stocks Year-to-Date ➞ Best Stocks Trends ➞  Best Stocks Today 12Stocks.com Best Nasdaq Stocks ➞ Best S&P 500 Stocks ➞ Best Tech Stocks ➞ Best Biotech Stocks ➞ |
| Detailed Overview of S&P 500 Stocks |
| S&P 500 Technical Overview, Leaders & Laggards, Top S&P 500 ETF Funds & Detailed S&P 500 Stocks List, Charts, Trends & More |
| S&P 500: Technical Analysis, Trends & YTD Performance | |
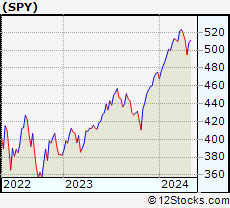
| S&P 500 index as represented by
SPY, an exchange-traded fund [ETF], holds basket of five hundred (mostly largecap) stocks from across all major sectors of the US stock market. The S&P 500 index (contains stocks like Apple and Exxon) is up by 5.27% and is currently outperforming the overall market by 0.73% year-to-date. Below is a quick view of technical charts and trends: | |
 SPY Weekly Chart |
|
| Long Term Trend: Not Good | |
| Medium Term Trend: Not Good | |
 SPY Daily Chart |
|
| Short Term Trend: Deteriorating | |
| Overall Trend Score: 38 | |
| YTD Performance: 5.27% | |
| **Trend Scores & Views Are Only For Educational Purposes And Not For Investing | |
| 12Stocks.com: Investing in S&P 500 Index using Exchange Traded Funds | |
|
The following table shows list of key exchange traded funds (ETF) that
help investors track S&P 500 index. The following list also includes leveraged ETF funds that track twice or thrice the daily returns of S&P 500 indices. Short or inverse ETF funds move in the opposite direction to the index they track and are useful during market pullbacks or during bear markets. Quick View: Move mouse or cursor over ETF symbol (ticker) to view short-term technical chart and over ETF name to view long term chart. Click on ticker or stock name for detailed view. Click on to add stock symbol to your watchlist and to view watchlist. |
12Stocks.com List of ETFs that track S&P 500 Index
| Ticker | ETF Name | Watchlist | Recent Price | Smart Investing & Trading Score | Change % | Week % | Year-to-date % |
| SPY | SPDR S&P 500 ETF | | 500.35 | 38 | -0.32 | -1.56 | 5.27% |
| IVV | iShares Core S&P 500 ETF | | 502.58 | 7 | -0.37 | -1.6 | 5.22% |
| VOO | Vanguard 500 ETF | | 459.94 | 7 | -0.32 | -1.56 | 5.3% |
| OEF | iShares S&P 100 | | 237.48 | 38 | -0.40 | -1.69 | 6.31% |
| SSO | ProShares Ultra S&P500 | | 70.39 | 17 | -0.68 | -3.19 | 8.18% |
| UPRO | ProShares UltraPro S&P500 | | 60.70 | 17 | -1.14 | -4.89 | 10.89% |
| SPXL | Direxion Daily S&P500 Bull 3X ETF | | 115.22 | 7 | -1.20 | -4.89 | 10.8% |
| SH | ProShares Short S&P500 | | 12.49 | 70 | 0.48 | 1.71 | -3.85% |
| SDS | ProShares UltraShort S&P500 | | 27.40 | 70 | 0.74 | 3.28 | -8.42% |
| SPXU | ProShares UltraPro Short S&P500 | | 37.21 | 65 | 0.98 | 4.82 | -13.47% |
| SPXS | Direxion Daily S&P 500 Bear 3X ETF | | 10.06 | 88 | 0.95 | 4.63 | -12.94% |
| 12Stocks.com: Charts, Trends, Fundamental Data and Performances of S&P 500 Stocks | |
|
We now take in-depth look at all S&P 500 stocks including charts, multi-period performances and overall trends (as measured by Smart Investing & Trading Score). One can sort S&P 500 stocks (click link to choose) by Daily, Weekly and by Year-to-Date performances. Also, one can sort by size of the company or by market capitalization. |
| Select Your Default Chart Type: | |||||
| |||||
| Click on stock symbol or name for detailed view. Click on to add stock symbol to your watchlist and to view watchlist. Quick View: Move mouse or cursor over "Daily" to quickly view daily technical stock chart and over "Weekly" to view weekly technical stock chart. | |||||

 | MLM Martin Marietta Materials, Inc. |
| Sector: Industrials | |
| SubSector: General Building Materials | |
| MarketCap: 10624.3 Millions | |
| Recent Price: 590.86 Smart Investing & Trading Score: 51 | |
| Day Percent Change: 0.65% Day Change: 3.79 | |
| Week Change: -2.34% Year-to-date Change: 18.4% | |
| MLM Links: Profile News Message Board | |
| Charts:- Daily , Weekly | |
| Add MLM to Watchlist: View: Get MLM Trend Analysis ➞ | |
 | FICO Fair Isaac Corporation |
| Sector: Technology | |
| SubSector: Business Software & Services | |
| MarketCap: 7930.98 Millions | |
| Recent Price: 1140.73 Smart Investing & Trading Score: 42 | |
| Day Percent Change: 0.65% Day Change: 7.40 | |
| Week Change: 2.69% Year-to-date Change: -2.0% | |
| FICO Links: Profile News Message Board | |
| Charts:- Daily , Weekly | |
| Add FICO to Watchlist: View: Get FICO Trend Analysis ➞ | |
 | ATO Atmos Energy Corporation |
| Sector: Utilities | |
| SubSector: Gas Utilities | |
| MarketCap: 11449 Millions | |
| Recent Price: 118.66 Smart Investing & Trading Score: 100 | |
| Day Percent Change: 0.64% Day Change: 0.76 | |
| Week Change: 1.48% Year-to-date Change: 2.4% | |
| ATO Links: Profile News Message Board | |
| Charts:- Daily , Weekly | |
| Add ATO to Watchlist: View: Get ATO Trend Analysis ➞ | |
 | FDS FactSet Research Systems Inc. |
| Sector: Technology | |
| SubSector: Information & Delivery Services | |
| MarketCap: 9024.37 Millions | |
| Recent Price: 419.57 Smart Investing & Trading Score: 42 | |
| Day Percent Change: 0.64% Day Change: 2.68 | |
| Week Change: -0.45% Year-to-date Change: -12.1% | |
| FDS Links: Profile News Message Board | |
| Charts:- Daily , Weekly | |
| Add FDS to Watchlist: View: Get FDS Trend Analysis ➞ | |
 | TROW T. Rowe Price Group, Inc. |
| Sector: Financials | |
| SubSector: Asset Management | |
| MarketCap: 24530 Millions | |
| Recent Price: 110.27 Smart Investing & Trading Score: 22 | |
| Day Percent Change: 0.64% Day Change: 0.70 | |
| Week Change: -3.29% Year-to-date Change: 2.4% | |
| TROW Links: Profile News Message Board | |
| Charts:- Daily , Weekly | |
| Add TROW to Watchlist: View: Get TROW Trend Analysis ➞ | |
 | AON Aon plc |
| Sector: Financials | |
| SubSector: Insurance Brokers | |
| MarketCap: 36870.1 Millions | |
| Recent Price: 283.81 Smart Investing & Trading Score: 18 | |
| Day Percent Change: 0.64% Day Change: 1.80 | |
| Week Change: -0.43% Year-to-date Change: -2.5% | |
| AON Links: Profile News Message Board | |
| Charts:- Daily , Weekly | |
| Add AON to Watchlist: View: Get AON Trend Analysis ➞ | |
 | HOLX Hologic, Inc. |
| Sector: Health Care | |
| SubSector: Medical Instruments & Supplies | |
| MarketCap: 9075.2 Millions | |
| Recent Price: 76.25 Smart Investing & Trading Score: 76 | |
| Day Percent Change: 0.63% Day Change: 0.48 | |
| Week Change: 0.36% Year-to-date Change: 6.7% | |
| HOLX Links: Profile News Message Board | |
| Charts:- Daily , Weekly | |
| Add HOLX to Watchlist: View: Get HOLX Trend Analysis ➞ | |
 | CNP CenterPoint Energy, Inc. |
| Sector: Utilities | |
| SubSector: Gas Utilities | |
| MarketCap: 7444.07 Millions | |
| Recent Price: 29.32 Smart Investing & Trading Score: 95 | |
| Day Percent Change: 0.62% Day Change: 0.18 | |
| Week Change: 1.63% Year-to-date Change: 2.6% | |
| CNP Links: Profile News Message Board | |
| Charts:- Daily , Weekly | |
| Add CNP to Watchlist: View: Get CNP Trend Analysis ➞ | |
 | BMY Bristol-Myers Squibb Company |
| Sector: Health Care | |
| SubSector: Drug Manufacturers - Major | |
| MarketCap: 117052 Millions | |
| Recent Price: 44.21 Smart Investing & Trading Score: 20 | |
| Day Percent Change: 0.61% Day Change: 0.27 | |
| Week Change: -1.43% Year-to-date Change: -13.8% | |
| BMY Links: Profile News Message Board | |
| Charts:- Daily , Weekly | |
| Add BMY to Watchlist: View: Get BMY Trend Analysis ➞ | |
 | EXPD Expeditors International of Washington, Inc. |
| Sector: Transports | |
| SubSector: Air Delivery & Freight Services | |
| MarketCap: 10129.8 Millions | |
| Recent Price: 111.99 Smart Investing & Trading Score: 28 | |
| Day Percent Change: 0.61% Day Change: 0.68 | |
| Week Change: -1.16% Year-to-date Change: -12.0% | |
| EXPD Links: Profile News Message Board | |
| Charts:- Daily , Weekly | |
| Add EXPD to Watchlist: View: Get EXPD Trend Analysis ➞ | |
 | GOOGL Alphabet Inc. |
| Sector: Technology | |
| SubSector: Internet Information Providers | |
| MarketCap: 801264 Millions | |
| Recent Price: 163.78 Smart Investing & Trading Score: 73 | |
| Day Percent Change: 0.61% Day Change: 1.00 | |
| Week Change: -4.75% Year-to-date Change: 17.3% | |
| GOOGL Links: Profile News Message Board | |
| Charts:- Daily , Weekly | |
| Add GOOGL to Watchlist: View: Get GOOGL Trend Analysis ➞ | |
 | BIIB Biogen Inc. |
| Sector: Health Care | |
| SubSector: Biotechnology | |
| MarketCap: 53102.6 Millions | |
| Recent Price: 216.11 Smart Investing & Trading Score: 87 | |
| Day Percent Change: 0.60% Day Change: 1.29 | |
| Week Change: 3.45% Year-to-date Change: -16.5% | |
| BIIB Links: Profile News Message Board | |
| Charts:- Daily , Weekly | |
| Add BIIB to Watchlist: View: Get BIIB Trend Analysis ➞ | |
 | DOW Dow Inc. |
| Sector: Materials | |
| SubSector: Chemicals - Major Diversified | |
| MarketCap: 24098.6 Millions | |
| Recent Price: 57.23 Smart Investing & Trading Score: 61 | |
| Day Percent Change: 0.58% Day Change: 0.33 | |
| Week Change: -0.1% Year-to-date Change: 4.4% | |
| DOW Links: Profile News Message Board | |
| Charts:- Daily , Weekly | |
| Add DOW to Watchlist: View: Get DOW Trend Analysis ➞ | |
 | LEN Lennar Corporation |
| Sector: Industrials | |
| SubSector: Residential Construction | |
| MarketCap: 11926.6 Millions | |
| Recent Price: 152.47 Smart Investing & Trading Score: 18 | |
| Day Percent Change: 0.56% Day Change: 0.85 | |
| Week Change: -1.18% Year-to-date Change: 2.3% | |
| LEN Links: Profile News Message Board | |
| Charts:- Daily , Weekly | |
| Add LEN to Watchlist: View: Get LEN Trend Analysis ➞ | |
 | GOOG Alphabet Inc. |
| Sector: Technology | |
| SubSector: Internet Information Providers | |
| MarketCap: 730159 Millions | |
| Recent Price: 165.57 Smart Investing & Trading Score: 73 | |
| Day Percent Change: 0.56% Day Change: 0.93 | |
| Week Change: -4.67% Year-to-date Change: 17.5% | |
| GOOG Links: Profile News Message Board | |
| Charts:- Daily , Weekly | |
| Add GOOG to Watchlist: View: Get GOOG Trend Analysis ➞ | |
 | JBHT J.B. Hunt Transport Services, Inc. |
| Sector: Transports | |
| SubSector: Trucking | |
| MarketCap: 9074 Millions | |
| Recent Price: 163.47 Smart Investing & Trading Score: 42 | |
| Day Percent Change: 0.55% Day Change: 0.90 | |
| Week Change: 0.9% Year-to-date Change: -18.2% | |
| JBHT Links: Profile News Message Board | |
| Charts:- Daily , Weekly | |
| Add JBHT to Watchlist: View: Get JBHT Trend Analysis ➞ | |
 | SWK Stanley Black & Decker, Inc. |
| Sector: Industrials | |
| SubSector: Machine Tools & Accessories | |
| MarketCap: 14274.8 Millions | |
| Recent Price: 91.90 Smart Investing & Trading Score: 88 | |
| Day Percent Change: 0.55% Day Change: 0.50 | |
| Week Change: 2.44% Year-to-date Change: -6.3% | |
| SWK Links: Profile News Message Board | |
| Charts:- Daily , Weekly | |
| Add SWK to Watchlist: View: Get SWK Trend Analysis ➞ | |
 | CE Celanese Corporation |
| Sector: Materials | |
| SubSector: Chemicals - Major Diversified | |
| MarketCap: 8521.06 Millions | |
| Recent Price: 154.44 Smart Investing & Trading Score: 66 | |
| Day Percent Change: 0.54% Day Change: 0.83 | |
| Week Change: -0.03% Year-to-date Change: -0.6% | |
| CE Links: Profile News Message Board | |
| Charts:- Daily , Weekly | |
| Add CE to Watchlist: View: Get CE Trend Analysis ➞ | |
 | FTNT Fortinet, Inc. |
| Sector: Technology | |
| SubSector: Application Software | |
| MarketCap: 16993.8 Millions | |
| Recent Price: 63.52 Smart Investing & Trading Score: 25 | |
| Day Percent Change: 0.54% Day Change: 0.34 | |
| Week Change: -1.03% Year-to-date Change: 8.5% | |
| FTNT Links: Profile News Message Board | |
| Charts:- Daily , Weekly | |
| Add FTNT to Watchlist: View: Get FTNT Trend Analysis ➞ | |
 | DVA DaVita Inc. |
| Sector: Health Care | |
| SubSector: Specialized Health Services | |
| MarketCap: 8954.36 Millions | |
| Recent Price: 139.75 Smart Investing & Trading Score: 95 | |
| Day Percent Change: 0.53% Day Change: 0.74 | |
| Week Change: 4.67% Year-to-date Change: 33.4% | |
| DVA Links: Profile News Message Board | |
| Charts:- Daily , Weekly | |
| Add DVA to Watchlist: View: Get DVA Trend Analysis ➞ | |
 | CB Chubb Limited |
| Sector: Financials | |
| SubSector: Property & Casualty Insurance | |
| MarketCap: 51615.9 Millions | |
| Recent Price: 249.93 Smart Investing & Trading Score: 60 | |
| Day Percent Change: 0.52% Day Change: 1.29 | |
| Week Change: 1.83% Year-to-date Change: 10.6% | |
| CB Links: Profile News Message Board | |
| Charts:- Daily , Weekly | |
| Add CB to Watchlist: View: Get CB Trend Analysis ➞ | |
 | AAL American Airlines Group Inc. |
| Sector: Transports | |
| SubSector: Major Airlines | |
| MarketCap: 5346.45 Millions | |
| Recent Price: 13.58 Smart Investing & Trading Score: 15 | |
| Day Percent Change: 0.52% Day Change: 0.07 | |
| Week Change: -2.16% Year-to-date Change: -1.2% | |
| AAL Links: Profile News Message Board | |
| Charts:- Daily , Weekly | |
| Add AAL to Watchlist: View: Get AAL Trend Analysis ➞ | |
 | MCD McDonald s Corporation |
| Sector: Services & Goods | |
| SubSector: Restaurants | |
| MarketCap: 122481 Millions | |
| Recent Price: 274.43 Smart Investing & Trading Score: 45 | |
| Day Percent Change: 0.51% Day Change: 1.39 | |
| Week Change: 0.49% Year-to-date Change: -7.5% | |
| MCD Links: Profile News Message Board | |
| Charts:- Daily , Weekly | |
| Add MCD to Watchlist: View: Get MCD Trend Analysis ➞ | |
 | PAYX Paychex, Inc. |
| Sector: Services & Goods | |
| SubSector: Staffing & Outsourcing Services | |
| MarketCap: 20928.8 Millions | |
| Recent Price: 119.41 Smart Investing & Trading Score: 52 | |
| Day Percent Change: 0.51% Day Change: 0.60 | |
| Week Change: -0.47% Year-to-date Change: 0.3% | |
| PAYX Links: Profile News Message Board | |
| Charts:- Daily , Weekly | |
| Add PAYX to Watchlist: View: Get PAYX Trend Analysis ➞ | |
 | XRAY DENTSPLY SIRONA Inc. |
| Sector: Health Care | |
| SubSector: Medical Instruments & Supplies | |
| MarketCap: 7746.1 Millions | |
| Recent Price: 30.16 Smart Investing & Trading Score: 35 | |
| Day Percent Change: 0.50% Day Change: 0.15 | |
| Week Change: -1.34% Year-to-date Change: -15.3% | |
| XRAY Links: Profile News Message Board | |
| Charts:- Daily , Weekly | |
| Add XRAY to Watchlist: View: Get XRAY Trend Analysis ➞ | |
| For tabular summary view of above stock list: Summary View ➞ 0 - 25 , 25 - 50 , 50 - 75 , 75 - 100 , 100 - 125 , 125 - 150 , 150 - 175 , 175 - 200 , 200 - 225 , 225 - 250 , 250 - 275 , 275 - 300 , 300 - 325 , 325 - 350 , 350 - 375 , 375 - 400 , 400 - 425 , 425 - 450 , 450 - 475 , 475 - 500 | ||
| Click To Change The Sort Order: By Market Cap or Company Size Performance: Year-to-date, Week and Day | |
| Select Chart Type: | ||
|
Best Stocks Today 12Stocks.com |
© 2024 12Stocks.com Terms & Conditions Privacy Contact Us
All Information Provided Only For Education And Not To Be Used For Investing or Trading. See Terms & Conditions


One More Thing ... Get Best Stocks Delivered Daily!
Never Ever Miss A Move With Our Top Ten Stocks Lists
Find Best Stocks In Any Market - Bull or Bear Market
Take A Peek At Our Top Ten Stocks Lists: Daily, Weekly, Year-to-Date & Top Trends
Find Best Stocks In Any Market - Bull or Bear Market
Take A Peek At Our Top Ten Stocks Lists: Daily, Weekly, Year-to-Date & Top Trends
S&P 500 Stocks With Best Up Trends [0-bearish to 100-bullish]: Bio-Techne [100], Garmin [100], Amcor [100], DuPont de[100], Pfizer [100], Zions Ban[100], American Electric[100], NextEra [100], Arch Capital[100], American Water[100], 3M [100]
Best S&P 500 Stocks Year-to-Date:
NVIDIA [67.69%], Constellation [57.66%], NRG [42.48%], Chipotle Mexican[37.24%], Western Digital[34.63%], DaVita [33.4%], Eli Lilly[33.25%], Progressive [32.97%], Leidos Holdings[31.37%], Eaton [29.57%], Targa Resources[29.4%] Best S&P 500 Stocks This Week:
Bio-Techne [14.64%], Garmin [13.92%], Amcor [9.25%], Leidos Holdings[9.07%], 3M [7.2%], Pfizer [7.01%], Tesla [6.96%], Corning [6.86%], DuPont de[6.24%], Eli Lilly[5.89%], Cincinnati Financial[5.78%] Best S&P 500 Stocks Daily:
Bio-Techne [16.18%], Garmin [13.12%], Amcor [9.62%], DuPont de[8.01%], Verisk Analytics[6.87%], Pfizer [6.09%], Johnson & Johnson[4.56%], Globe Life[4.35%], Humana [4.01%], Extra Space[3.29%], American Tower[3.08%]