
 Login Sign Up


| |||||
 |  | ||||

| 12Stocks.com Market Intelligence |
Best S&P 500 Stocks
|
On this page, you will find the most comprehensive analysis of S&P 500 stocks and ETFs - from latest trends to performances to charts ➞. First, here are the year-to-date (YTD) performances of the most requested S&P 500 stocks at 12Stocks.com (click stock for review):
| NVIDIA 54% | ||
| Caterpillar 20% | ||
| Merck 15% | ||
| Amazon.com 15% | ||
| Walmart 13% | ||
| Google 10% | ||
| JPMorgan Chase 9% | ||
| Chevron 7% | ||
| Microsoft 6% | ||
| Goldman Sachs 5% | ||
| Johnson & Johnson -6% | ||
| McDonald s -8% | ||
| Starbucks -9% | ||
| Apple -14% | ||
| Gilead -18% | ||
| Intel -32% | ||
| Boeing -35% | ||
| Quick: S&P 500 Stocks Lists: Performances & Trends, S&P 500 Stock Charts
Sort S&P 500 stocks: Daily, Weekly, Year-to-Date, Market Cap & Trends. Filter S&P 500 stocks list by sector: Show all, Tech, Finance, Energy, Staples, Retail, Industrial, Materials, Utilities and HealthCare |
| 12Stocks.com S&P 500 Stocks Performances & Trends Daily Report | |||||||||
|
| 
The overall Smart Investing & Trading Score is 26 (0-bearish to 100-bullish) which puts S&P 500 index in short term bearish to neutral trend. The Smart Investing & Trading Score from previous trading session is 36 and hence a deterioration of trend. | ||||||||
Here are the Smart Investing & Trading Scores of the most requested S&P 500 stocks at 12Stocks.com (click stock name for detailed review):
|


| 12Stocks.com: Top Performing S&P 500 Index Stocks | ||||||||||||||||||||||||||||||||||||||||||||||||
 The top performing S&P 500 Index stocks year to date are
Now, more recently, over last week, the top performing S&P 500 Index stocks on the move are


|
||||||||||||||||||||||||||||||||||||||||||||||||
| 12Stocks.com: Investing in S&P 500 Index with Stocks | |
|
The following table helps investors and traders sort through current performance and trends (as measured by Smart Investing & Trading Score) of various
stocks in the S&P 500 Index. Quick View: Move mouse or cursor over stock symbol (ticker) to view short-term technical chart and over stock name to view long term chart. Click on  to add stock symbol to your watchlist and to add stock symbol to your watchlist and  to view watchlist. Click on any ticker or stock name for detailed market intelligence report for that stock. to view watchlist. Click on any ticker or stock name for detailed market intelligence report for that stock. |
12Stocks.com Performance of Stocks in S&P 500 Index
| Ticker | Stock Name | Watchlist | Category | Recent Price | Smart Investing & Trading Score | Change % | YTD Change% |
| YUM | Yum! Brands |   | Services & Goods | 138.50 | 75 | 0.46 | 6.00% |
| WMT | Walmart | | Services & Goods | 59.53 | 49 | 0.46 | 13.28% |
| CTSH | Cognizant | | Technology | 67.44 | 18 | 0.46 | -10.71% |
| STT | State Street | | Financials | 73.37 | 38 | 0.45 | -5.28% |
| NEE | NextEra | | Utilities | 64.30 | 81 | 0.45 | 5.86% |
| APTV | Aptiv | | Consumer Staples | 69.63 | 10 | 0.45 | -22.39% |
| MRK | Merck | | Health Care | 125.78 | 56 | 0.44 | 15.37% |
| MS | Morgan Stanley | | Financials | 90.66 | 73 | 0.44 | -2.78% |
| IFF | Flavors | | Materials | 83.97 | 68 | 0.44 | 3.71% |
| CSCO | Cisco Systems | | Technology | 48.32 | 32 | 0.44 | -4.35% |
| FSLR | First Solar | | Technology | 175.04 | 78 | 0.43 | 1.60% |
| EMN | Eastman Chemical | | Materials | 96.42 | 61 | 0.42 | 7.35% |
| AZO | AutoZone | | Services & Goods | 2985.54 | 58 | 0.42 | 15.47% |
| BDX | Becton Dickinson | | Health Care | 234.12 | 32 | 0.42 | -3.98% |
| IEX | IDEX | | Industrials | 227.04 | 36 | 0.42 | 4.57% |
| RSG | Republic Services | | Industrials | 189.76 | 75 | 0.42 | 15.07% |
| NSC | Norfolk Southern | | Transports | 241.28 | 56 | 0.42 | 2.07% |
| MKTX | MarketAxess Holdings | | Financials | 204.01 | 32 | 0.42 | -30.34% |
| IQV | IQVIA Holdings | | Health Care | 228.09 | 44 | 0.40 | -1.42% |
| WY | Weyerhaeuser | | Industrials | 31.47 | 10 | 0.38 | -9.49% |
| PTC | PTC | | Technology | 176.37 | 10 | 0.38 | 0.81% |
| MDT | Medtronic | | Health Care | 79.48 | 25 | 0.37 | -3.52% |
| MCD | McDonald s | | Services & Goods | 271.99 | 49 | 0.37 | -8.27% |
| HOLX | Hologic | | Health Care | 75.38 | 61 | 0.37 | 5.50% |
| MRO | Marathon Oil | | Energy | 27.50 | 43 | 0.36 | 13.82% |
| For chart view version of above stock list: Chart View ➞ 0 - 25 , 25 - 50 , 50 - 75 , 75 - 100 , 100 - 125 , 125 - 150 , 150 - 175 , 175 - 200 , 200 - 225 , 225 - 250 , 250 - 275 , 275 - 300 , 300 - 325 , 325 - 350 , 350 - 375 , 375 - 400 , 400 - 425 , 425 - 450 , 450 - 475 , 475 - 500 | ||
 | Click To Change The Sort Order: By Market Cap or Company Size Performance: Year-to-date, Week and Day |  |
|
Get the most comprehensive stock market coverage daily at 12Stocks.com ➞ Best Stocks Today ➞ Best Stocks Weekly ➞ Best Stocks Year-to-Date ➞ Best Stocks Trends ➞  Best Stocks Today 12Stocks.com Best Nasdaq Stocks ➞ Best S&P 500 Stocks ➞ Best Tech Stocks ➞ Best Biotech Stocks ➞ |
| Detailed Overview of S&P 500 Stocks |
| S&P 500 Technical Overview, Leaders & Laggards, Top S&P 500 ETF Funds & Detailed S&P 500 Stocks List, Charts, Trends & More |
| S&P 500: Technical Analysis, Trends & YTD Performance | |
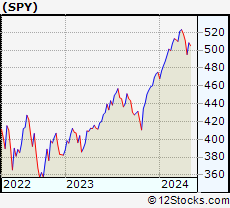
| S&P 500 index as represented by
SPY, an exchange-traded fund [ETF], holds basket of five hundred (mostly largecap) stocks from across all major sectors of the US stock market. The S&P 500 index (contains stocks like Apple and Exxon) is up by 4.18% and is currently outperforming the overall market by 0.8% year-to-date. Below is a quick view of technical charts and trends: | |
 SPY Weekly Chart |
|
| Long Term Trend: Good | |
| Medium Term Trend: Not Good | |
 SPY Daily Chart |
|
| Short Term Trend: Not Good | |
| Overall Trend Score: 26 | |
| YTD Performance: 4.18% | |
| **Trend Scores & Views Are Only For Educational Purposes And Not For Investing | |
| 12Stocks.com: Investing in S&P 500 Index using Exchange Traded Funds | |
|
The following table shows list of key exchange traded funds (ETF) that
help investors track S&P 500 index. The following list also includes leveraged ETF funds that track twice or thrice the daily returns of S&P 500 indices. Short or inverse ETF funds move in the opposite direction to the index they track and are useful during market pullbacks or during bear markets. Quick View: Move mouse or cursor over ETF symbol (ticker) to view short-term technical chart and over ETF name to view long term chart. Click on ticker or stock name for detailed view. Click on to add stock symbol to your watchlist and to view watchlist. |
12Stocks.com List of ETFs that track S&P 500 Index
| Ticker | ETF Name | Watchlist | Recent Price | Smart Investing & Trading Score | Change % | Week % | Year-to-date % |
| SPY | SPDR S&P 500 ETF | | 495.16 | 26 | -0.87 | -3.07 | 4.18% |
| IVV | iShares Core S&P 500 ETF | | 497.53 | 36 | -0.87 | -3.07 | 4.17% |
| VOO | Vanguard 500 ETF | | 455.10 | 36 | -0.84 | -3.08 | 4.19% |
| OEF | iShares S&P 100 | | 234.68 | 26 | -1.24 | -3.48 | 5.05% |
| SSO | ProShares Ultra S&P500 | | 69.11 | 26 | -1.73 | -6.18 | 6.21% |
| UPRO | ProShares UltraPro S&P500 | | 59.16 | 26 | -2.67 | -9.26 | 8.07% |
| SPXL | Direxion Daily S&P500 Bull 3X ETF | | 112.55 | 36 | -2.58 | -9.12 | 8.23% |
| SH | ProShares Short S&P500 | | 12.59 | 74 | 0.96 | 3.28 | -3.08% |
| SDS | ProShares UltraShort S&P500 | | 27.90 | 74 | 1.79 | 6.61 | -6.75% |
| SPXU | ProShares UltraPro Short S&P500 | | 38.33 | 74 | 2.68 | 9.95 | -10.86% |
| SPXS | Direxion Daily S&P 500 Bear 3X ETF | | 10.36 | 49 | 2.47 | 9.98 | -10.3% |
| 12Stocks.com: Charts, Trends, Fundamental Data and Performances of S&P 500 Stocks | |
|
We now take in-depth look at all S&P 500 stocks including charts, multi-period performances and overall trends (as measured by Smart Investing & Trading Score). One can sort S&P 500 stocks (click link to choose) by Daily, Weekly and by Year-to-Date performances. Also, one can sort by size of the company or by market capitalization. |
| Select Your Default Chart Type: | |||||
| |||||
| Click on stock symbol or name for detailed view. Click on to add stock symbol to your watchlist and to view watchlist. Quick View: Move mouse or cursor over "Daily" to quickly view daily technical stock chart and over "Weekly" to view weekly technical stock chart. | |||||

 | YUM Yum! Brands, Inc. |
| Sector: Services & Goods | |
| SubSector: Restaurants | |
| MarketCap: 18033.3 Millions | |
| Recent Price: 138.50 Smart Investing & Trading Score: 75 | |
| Day Percent Change: 0.46% Day Change: 0.63 | |
| Week Change: 0.51% Year-to-date Change: 6.0% | |
| YUM Links: Profile News Message Board | |
| Charts:- Daily , Weekly | |
| Add YUM to Watchlist: View: Get YUM Trend Analysis ➞ | |
 | WMT Walmart Inc. |
| Sector: Services & Goods | |
| SubSector: Discount, Variety Stores | |
| MarketCap: 355610 Millions | |
| Recent Price: 59.53 Smart Investing & Trading Score: 49 | |
| Day Percent Change: 0.46% Day Change: 0.27 | |
| Week Change: -1.01% Year-to-date Change: 13.3% | |
| WMT Links: Profile News Message Board | |
| Charts:- Daily , Weekly | |
| Add WMT to Watchlist: View: Get WMT Trend Analysis ➞ | |
 | CTSH Cognizant Technology Solutions Corporation |
| Sector: Technology | |
| SubSector: Information Technology Services | |
| MarketCap: 26249.7 Millions | |
| Recent Price: 67.44 Smart Investing & Trading Score: 18 | |
| Day Percent Change: 0.46% Day Change: 0.31 | |
| Week Change: -2.63% Year-to-date Change: -10.7% | |
| CTSH Links: Profile News Message Board | |
| Charts:- Daily , Weekly | |
| Add CTSH to Watchlist: View: Get CTSH Trend Analysis ➞ | |
 | STT State Street Corporation |
| Sector: Financials | |
| SubSector: Asset Management | |
| MarketCap: 18623 Millions | |
| Recent Price: 73.37 Smart Investing & Trading Score: 38 | |
| Day Percent Change: 0.45% Day Change: 0.33 | |
| Week Change: -3.18% Year-to-date Change: -5.3% | |
| STT Links: Profile News Message Board | |
| Charts:- Daily , Weekly | |
| Add STT to Watchlist: View: Get STT Trend Analysis ➞ | |
 | NEE NextEra Energy, Inc. |
| Sector: Utilities | |
| SubSector: Electric Utilities | |
| MarketCap: 108288 Millions | |
| Recent Price: 64.30 Smart Investing & Trading Score: 81 | |
| Day Percent Change: 0.45% Day Change: 0.29 | |
| Week Change: 1.93% Year-to-date Change: 5.9% | |
| NEE Links: Profile News Message Board | |
| Charts:- Daily , Weekly | |
| Add NEE to Watchlist: View: Get NEE Trend Analysis ➞ | |
 | APTV Aptiv PLC |
| Sector: Consumer Staples | |
| SubSector: Auto Parts | |
| MarketCap: 13047.9 Millions | |
| Recent Price: 69.63 Smart Investing & Trading Score: 10 | |
| Day Percent Change: 0.45% Day Change: 0.31 | |
| Week Change: -6.15% Year-to-date Change: -22.4% | |
| APTV Links: Profile News Message Board | |
| Charts:- Daily , Weekly | |
| Add APTV to Watchlist: View: Get APTV Trend Analysis ➞ | |
 | MRK Merck & Co., Inc. |
| Sector: Health Care | |
| SubSector: Drug Manufacturers - Major | |
| MarketCap: 192657 Millions | |
| Recent Price: 125.78 Smart Investing & Trading Score: 56 | |
| Day Percent Change: 0.44% Day Change: 0.55 | |
| Week Change: 0.03% Year-to-date Change: 15.4% | |
| MRK Links: Profile News Message Board | |
| Charts:- Daily , Weekly | |
| Add MRK to Watchlist: View: Get MRK Trend Analysis ➞ | |
 | MS Morgan Stanley |
| Sector: Financials | |
| SubSector: Investment Brokerage - National | |
| MarketCap: 55876.7 Millions | |
| Recent Price: 90.66 Smart Investing & Trading Score: 73 | |
| Day Percent Change: 0.44% Day Change: 0.40 | |
| Week Change: 5.19% Year-to-date Change: -2.8% | |
| MS Links: Profile News Message Board | |
| Charts:- Daily , Weekly | |
| Add MS to Watchlist: View: Get MS Trend Analysis ➞ | |
 | IFF International Flavors & Fragrances Inc. |
| Sector: Materials | |
| SubSector: Specialty Chemicals | |
| MarketCap: 12178.7 Millions | |
| Recent Price: 83.97 Smart Investing & Trading Score: 68 | |
| Day Percent Change: 0.44% Day Change: 0.37 | |
| Week Change: 0.43% Year-to-date Change: 3.7% | |
| IFF Links: Profile News Message Board | |
| Charts:- Daily , Weekly | |
| Add IFF to Watchlist: View: Get IFF Trend Analysis ➞ | |
 | CSCO Cisco Systems, Inc. |
| Sector: Technology | |
| SubSector: Communication Equipment | |
| MarketCap: 168483 Millions | |
| Recent Price: 48.32 Smart Investing & Trading Score: 32 | |
| Day Percent Change: 0.44% Day Change: 0.21 | |
| Week Change: -0.35% Year-to-date Change: -4.4% | |
| CSCO Links: Profile News Message Board | |
| Charts:- Daily , Weekly | |
| Add CSCO to Watchlist: View: Get CSCO Trend Analysis ➞ | |
 | FSLR First Solar, Inc. |
| Sector: Technology | |
| SubSector: Semiconductor - Specialized | |
| MarketCap: 3617.9 Millions | |
| Recent Price: 175.04 Smart Investing & Trading Score: 78 | |
| Day Percent Change: 0.43% Day Change: 0.75 | |
| Week Change: -5.1% Year-to-date Change: 1.6% | |
| FSLR Links: Profile News Message Board | |
| Charts:- Daily , Weekly | |
| Add FSLR to Watchlist: View: Get FSLR Trend Analysis ➞ | |
 | EMN Eastman Chemical Company |
| Sector: Materials | |
| SubSector: Chemicals - Major Diversified | |
| MarketCap: 6217.06 Millions | |
| Recent Price: 96.42 Smart Investing & Trading Score: 61 | |
| Day Percent Change: 0.42% Day Change: 0.40 | |
| Week Change: -1.59% Year-to-date Change: 7.4% | |
| EMN Links: Profile News Message Board | |
| Charts:- Daily , Weekly | |
| Add EMN to Watchlist: View: Get EMN Trend Analysis ➞ | |
 | AZO AutoZone, Inc. |
| Sector: Services & Goods | |
| SubSector: Auto Parts Stores | |
| MarketCap: 19128 Millions | |
| Recent Price: 2985.54 Smart Investing & Trading Score: 58 | |
| Day Percent Change: 0.42% Day Change: 12.37 | |
| Week Change: 0.78% Year-to-date Change: 15.5% | |
| AZO Links: Profile News Message Board | |
| Charts:- Daily , Weekly | |
| Add AZO to Watchlist: View: Get AZO Trend Analysis ➞ | |
 | BDX Becton, Dickinson and Company |
| Sector: Health Care | |
| SubSector: Medical Instruments & Supplies | |
| MarketCap: 62758.4 Millions | |
| Recent Price: 234.12 Smart Investing & Trading Score: 32 | |
| Day Percent Change: 0.42% Day Change: 0.97 | |
| Week Change: -0.45% Year-to-date Change: -4.0% | |
| BDX Links: Profile News Message Board | |
| Charts:- Daily , Weekly | |
| Add BDX to Watchlist: View: Get BDX Trend Analysis ➞ | |
 | IEX IDEX Corporation |
| Sector: Industrials | |
| SubSector: Diversified Machinery | |
| MarketCap: 9721.46 Millions | |
| Recent Price: 227.04 Smart Investing & Trading Score: 36 | |
| Day Percent Change: 0.42% Day Change: 0.94 | |
| Week Change: -2.42% Year-to-date Change: 4.6% | |
| IEX Links: Profile News Message Board | |
| Charts:- Daily , Weekly | |
| Add IEX to Watchlist: View: Get IEX Trend Analysis ➞ | |
 | RSG Republic Services, Inc. |
| Sector: Industrials | |
| SubSector: Waste Management | |
| MarketCap: 26178.6 Millions | |
| Recent Price: 189.76 Smart Investing & Trading Score: 75 | |
| Day Percent Change: 0.42% Day Change: 0.79 | |
| Week Change: 1.03% Year-to-date Change: 15.1% | |
| RSG Links: Profile News Message Board | |
| Charts:- Daily , Weekly | |
| Add RSG to Watchlist: View: Get RSG Trend Analysis ➞ | |
 | NSC Norfolk Southern Corporation |
| Sector: Transports | |
| SubSector: Railroads | |
| MarketCap: 36165.4 Millions | |
| Recent Price: 241.28 Smart Investing & Trading Score: 56 | |
| Day Percent Change: 0.42% Day Change: 1.01 | |
| Week Change: -1.81% Year-to-date Change: 2.1% | |
| NSC Links: Profile News Message Board | |
| Charts:- Daily , Weekly | |
| Add NSC to Watchlist: View: Get NSC Trend Analysis ➞ | |
 | MKTX MarketAxess Holdings Inc. |
| Sector: Financials | |
| SubSector: Investment Brokerage - National | |
| MarketCap: 12431.5 Millions | |
| Recent Price: 204.01 Smart Investing & Trading Score: 32 | |
| Day Percent Change: 0.42% Day Change: 0.86 | |
| Week Change: -4.22% Year-to-date Change: -30.3% | |
| MKTX Links: Profile News Message Board | |
| Charts:- Daily , Weekly | |
| Add MKTX to Watchlist: View: Get MKTX Trend Analysis ➞ | |
 | IQV IQVIA Holdings Inc. |
| Sector: Health Care | |
| SubSector: Medical Laboratories & Research | |
| MarketCap: 19616.5 Millions | |
| Recent Price: 228.09 Smart Investing & Trading Score: 44 | |
| Day Percent Change: 0.40% Day Change: 0.92 | |
| Week Change: -2.62% Year-to-date Change: -1.4% | |
| IQV Links: Profile News Message Board | |
| Charts:- Daily , Weekly | |
| Add IQV to Watchlist: View: Get IQV Trend Analysis ➞ | |
 | WY Weyerhaeuser Company |
| Sector: Industrials | |
| SubSector: Lumber, Wood Production | |
| MarketCap: 13244.8 Millions | |
| Recent Price: 31.47 Smart Investing & Trading Score: 10 | |
| Day Percent Change: 0.38% Day Change: 0.12 | |
| Week Change: -5.32% Year-to-date Change: -9.5% | |
| WY Links: Profile News Message Board | |
| Charts:- Daily , Weekly | |
| Add WY to Watchlist: View: Get WY Trend Analysis ➞ | |
 | PTC PTC Inc. |
| Sector: Technology | |
| SubSector: Technical & System Software | |
| MarketCap: 6166.7 Millions | |
| Recent Price: 176.37 Smart Investing & Trading Score: 10 | |
| Day Percent Change: 0.38% Day Change: 0.67 | |
| Week Change: -2.05% Year-to-date Change: 0.8% | |
| PTC Links: Profile News Message Board | |
| Charts:- Daily , Weekly | |
| Add PTC to Watchlist: View: Get PTC Trend Analysis ➞ | |
 | MDT Medtronic plc |
| Sector: Health Care | |
| SubSector: Medical Appliances & Equipment | |
| MarketCap: 113698 Millions | |
| Recent Price: 79.48 Smart Investing & Trading Score: 25 | |
| Day Percent Change: 0.37% Day Change: 0.29 | |
| Week Change: -0.81% Year-to-date Change: -3.5% | |
| MDT Links: Profile News Message Board | |
| Charts:- Daily , Weekly | |
| Add MDT to Watchlist: View: Get MDT Trend Analysis ➞ | |
 | MCD McDonald s Corporation |
| Sector: Services & Goods | |
| SubSector: Restaurants | |
| MarketCap: 122481 Millions | |
| Recent Price: 271.99 Smart Investing & Trading Score: 49 | |
| Day Percent Change: 0.37% Day Change: 1.01 | |
| Week Change: 1.72% Year-to-date Change: -8.3% | |
| MCD Links: Profile News Message Board | |
| Charts:- Daily , Weekly | |
| Add MCD to Watchlist: View: Get MCD Trend Analysis ➞ | |
 | HOLX Hologic, Inc. |
| Sector: Health Care | |
| SubSector: Medical Instruments & Supplies | |
| MarketCap: 9075.2 Millions | |
| Recent Price: 75.38 Smart Investing & Trading Score: 61 | |
| Day Percent Change: 0.37% Day Change: 0.28 | |
| Week Change: -2.52% Year-to-date Change: 5.5% | |
| HOLX Links: Profile News Message Board | |
| Charts:- Daily , Weekly | |
| Add HOLX to Watchlist: View: Get HOLX Trend Analysis ➞ | |
 | MRO Marathon Oil Corporation |
| Sector: Energy | |
| SubSector: Independent Oil & Gas | |
| MarketCap: 2911.53 Millions | |
| Recent Price: 27.50 Smart Investing & Trading Score: 43 | |
| Day Percent Change: 0.36% Day Change: 0.10 | |
| Week Change: -5.47% Year-to-date Change: 13.8% | |
| MRO Links: Profile News Message Board | |
| Charts:- Daily , Weekly | |
| Add MRO to Watchlist: View: Get MRO Trend Analysis ➞ | |
| For tabular summary view of above stock list: Summary View ➞ 0 - 25 , 25 - 50 , 50 - 75 , 75 - 100 , 100 - 125 , 125 - 150 , 150 - 175 , 175 - 200 , 200 - 225 , 225 - 250 , 250 - 275 , 275 - 300 , 300 - 325 , 325 - 350 , 350 - 375 , 375 - 400 , 400 - 425 , 425 - 450 , 450 - 475 , 475 - 500 | ||
| Click To Change The Sort Order: By Market Cap or Company Size Performance: Year-to-date, Week and Day | |
| Select Chart Type: | ||
|
Best Stocks Today 12Stocks.com |
© 2024 12Stocks.com Terms & Conditions Privacy Contact Us
All Information Provided Only For Education And Not To Be Used For Investing or Trading. See Terms & Conditions


One More Thing ... Get Best Stocks Delivered Daily!
Never Ever Miss A Move With Our Top Ten Stocks Lists
Find Best Stocks In Any Market - Bull or Bear Market
Take A Peek At Our Top Ten Stocks Lists: Daily, Weekly, Year-to-Date & Top Trends
Find Best Stocks In Any Market - Bull or Bear Market
Take A Peek At Our Top Ten Stocks Lists: Daily, Weekly, Year-to-Date & Top Trends
S&P 500 Stocks With Best Up Trends [0-bearish to 100-bullish]: Kinder Morgan[100], Entergy [100], Bunge [100], Philip Morris[100], Wells Fargo[100], Dominion [100], Duke [100], Tyson Foods[100], Lockheed Martin[100], Genuine Parts[100], Consolidated Edison[100]
Best S&P 500 Stocks Year-to-Date:
Constellation [54.47%], NVIDIA [53.87%], Meta Platforms[35.89%], NRG [35.34%], Progressive [34.79%], Marathon [32.37%], Targa Resources[29.99%], Diamondback [29.44%], Western Digital[26.12%], Valero [26.07%], Eaton [25.83%] Best S&P 500 Stocks This Week:
United Airlines[22.92%], UnitedHealth [14.1%], Globe Life[12.95%], Genuine Parts[11.7%], ProShares UltraPro[9.95%], American Airlines[7.3%], Wells Fargo[6.87%], Southwest Airlines[6.68%], M&T Bank[6.55%], General Mills[6.37%], Centene [6.25%] Best S&P 500 Stocks Daily:
American Express[6.23%], Fifth Third[5.93%], Walgreens Boots[3.70%], Kinder Morgan[3.46%], Bank of America[3.35%], Citizens Financial[3.31%], J. M.[3.29%], Truist Financial[3.05%], PNC Financial[2.98%], M&T Bank[2.93%], Entergy [2.91%]