
 Login Sign Up


| |||||
 |  | ||||

| 12Stocks.com Market Intelligence |
Best S&P 500 Stocks
|
On this page, you will find the most comprehensive analysis of S&P 500 stocks and ETFs - from latest trends to performances to charts ➞. First, here are the year-to-date (YTD) performances of the most requested S&P 500 stocks at 12Stocks.com (click stock for review):
| NVIDIA 66% | ||
| Caterpillar 23% | ||
| Amazon.com 17% | ||
| Merck 17% | ||
| Google 13% | ||
| JPMorgan Chase 13% | ||
| Walmart 12% | ||
| Goldman Sachs 9% | ||
| Chevron 8% | ||
| Microsoft 8% | ||
| Johnson & Johnson -5% | ||
| McDonald s -7% | ||
| Starbucks -8% | ||
| Apple -13% | ||
| Gilead -17% | ||
| Intel -31% | ||
| Boeing -35% | ||
| Quick: S&P 500 Stocks Lists: Performances & Trends, S&P 500 Stock Charts
Sort S&P 500 stocks: Daily, Weekly, Year-to-Date, Market Cap & Trends. Filter S&P 500 stocks list by sector: Show all, Tech, Finance, Energy, Staples, Retail, Industrial, Materials, Utilities and HealthCare |
| 12Stocks.com S&P 500 Stocks Performances & Trends Daily Report | |||||||||
|
| 
The overall Smart Investing & Trading Score is 58 (0-bearish to 100-bullish) which puts S&P 500 index in short term neutral trend. The Smart Investing & Trading Score from previous trading session is 51 and hence an improvement of trend. | ||||||||
Here are the Smart Investing & Trading Scores of the most requested S&P 500 stocks at 12Stocks.com (click stock name for detailed review):
|


| 12Stocks.com: Top Performing S&P 500 Index Stocks | ||||||||||||||||||||||||||||||||||||||||||||||||
 The top performing S&P 500 Index stocks year to date are
Now, more recently, over last week, the top performing S&P 500 Index stocks on the move are


|
||||||||||||||||||||||||||||||||||||||||||||||||
| 12Stocks.com: Investing in S&P 500 Index with Stocks | |
|
The following table helps investors and traders sort through current performance and trends (as measured by Smart Investing & Trading Score) of various
stocks in the S&P 500 Index. Quick View: Move mouse or cursor over stock symbol (ticker) to view short-term technical chart and over stock name to view long term chart. Click on  to add stock symbol to your watchlist and to add stock symbol to your watchlist and  to view watchlist. Click on any ticker or stock name for detailed market intelligence report for that stock. to view watchlist. Click on any ticker or stock name for detailed market intelligence report for that stock. |
12Stocks.com Performance of Stocks in S&P 500 Index
| Ticker | Stock Name | Watchlist | Category | Recent Price | Smart Investing & Trading Score | Change % | YTD Change% |
| TRMB | Trimble |   | Technology | 59.66 | 68 | 1.22 | 12.14% |
| CPRT | Copart | | Services & Goods | 53.95 | 58 | 1.21 | 10.09% |
| TXN | Texas Instruments | | Technology | 165.41 | 68 | 1.21 | -2.96% |
| TDY | Teledyne Technologies | | Technology | 408.93 | 49 | 1.20 | -8.37% |
| DLR | Digital Realty | | Financials | 137.49 | 18 | 1.20 | 2.16% |
| GRMN | Garmin | | Technology | 142.68 | 63 | 1.18 | 11.00% |
| SPG | Simon Property | | Financials | 144.07 | 58 | 1.17 | 1.00% |
| EFX | Equifax | | Financials | 221.49 | 32 | 1.17 | -10.43% |
| JBL | Jabil | | Technology | 120.52 | 17 | 1.17 | -5.40% |
| DOV | Dover | | Industrials | 172.28 | 68 | 1.17 | 12.01% |
| IR | Ingersoll Rand | | Industrials | 89.67 | 58 | 1.17 | 15.94% |
| ZION | Zions Ban | | Financials | 41.80 | 80 | 1.16 | -4.72% |
| NTRS | Northern Trust | | Financials | 84.50 | 68 | 1.15 | 0.14% |
| HOLX | Hologic | | Health Care | 77.10 | 68 | 1.15 | 7.91% |
| MAS | Masco | | Industrials | 72.85 | 58 | 1.15 | 8.76% |
| EQT | EQT | | Energy | 38.41 | 100 | 1.15 | -0.66% |
| IBM | Business | | Technology | 184.00 | 45 | 1.15 | 12.50% |
| DFS | Discover Financial | | Financials | 128.13 | 90 | 1.15 | 14.00% |
| ESS | Essex Property | | Financials | 242.63 | 100 | 1.14 | -2.14% |
| JKHY | Jack Henry | | Technology | 166.70 | 55 | 1.13 | 2.01% |
| AME | AMETEK | | Industrials | 179.86 | 63 | 1.12 | 9.08% |
| ALLE | Allegion | | Services & Goods | 126.82 | 58 | 1.12 | 0.10% |
| JPM | JPMorgan Chase | | Financials | 191.50 | 70 | 1.10 | 12.58% |
| FITB | Fifth Third | | Financials | 36.95 | 100 | 1.09 | 7.13% |
| IRM | Iron Mountain | | Technology | 76.66 | 70 | 1.07 | 9.55% |
| For chart view version of above stock list: Chart View ➞ 0 - 25 , 25 - 50 , 50 - 75 , 75 - 100 , 100 - 125 , 125 - 150 , 150 - 175 , 175 - 200 , 200 - 225 , 225 - 250 , 250 - 275 , 275 - 300 , 300 - 325 , 325 - 350 , 350 - 375 , 375 - 400 , 400 - 425 , 425 - 450 , 450 - 475 | ||
 | Click To Change The Sort Order: By Market Cap or Company Size Performance: Year-to-date, Week and Day |  |
|
Get the most comprehensive stock market coverage daily at 12Stocks.com ➞ Best Stocks Today ➞ Best Stocks Weekly ➞ Best Stocks Year-to-Date ➞ Best Stocks Trends ➞  Best Stocks Today 12Stocks.com Best Nasdaq Stocks ➞ Best S&P 500 Stocks ➞ Best Tech Stocks ➞ Best Biotech Stocks ➞ |
| Detailed Overview of S&P 500 Stocks |
| S&P 500 Technical Overview, Leaders & Laggards, Top S&P 500 ETF Funds & Detailed S&P 500 Stocks List, Charts, Trends & More |
| S&P 500: Technical Analysis, Trends & YTD Performance | |
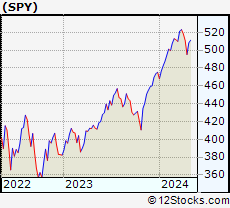
| S&P 500 index as represented by
SPY, an exchange-traded fund [ETF], holds basket of five hundred (mostly largecap) stocks from across all major sectors of the US stock market. The S&P 500 index (contains stocks like Apple and Exxon) is up by 6.12% and is currently outperforming the overall market by 0.63% year-to-date. Below is a quick view of technical charts and trends: | |
 SPY Weekly Chart |
|
| Long Term Trend: Good | |
| Medium Term Trend: Not Good | |
 SPY Daily Chart |
|
| Short Term Trend: Very Good | |
| Overall Trend Score: 58 | |
| YTD Performance: 6.12% | |
| **Trend Scores & Views Are Only For Educational Purposes And Not For Investing | |
| 12Stocks.com: Investing in S&P 500 Index using Exchange Traded Funds | |
|
The following table shows list of key exchange traded funds (ETF) that
help investors track S&P 500 index. The following list also includes leveraged ETF funds that track twice or thrice the daily returns of S&P 500 indices. Short or inverse ETF funds move in the opposite direction to the index they track and are useful during market pullbacks or during bear markets. Quick View: Move mouse or cursor over ETF symbol (ticker) to view short-term technical chart and over ETF name to view long term chart. Click on ticker or stock name for detailed view. Click on to add stock symbol to your watchlist and to view watchlist. |
12Stocks.com List of ETFs that track S&P 500 Index
| Ticker | ETF Name | Watchlist | Recent Price | Smart Investing & Trading Score | Change % | Week % | Year-to-date % |
| SPY | SPDR S&P 500 ETF | | 504.40 | 58 | 0.94 | 1.87 | 6.12% |
| IVV | iShares Core S&P 500 ETF | | 506.60 | 58 | 1.69 | 1.82 | 6.06% |
| VOO | Vanguard 500 ETF | | 463.37 | 58 | 1.70 | 1.82 | 6.08% |
| OEF | iShares S&P 100 | | 239.30 | 51 | 1.05 | 1.97 | 7.12% |
| SSO | ProShares Ultra S&P500 | | 71.67 | 58 | 1.91 | 3.7 | 10.14% |
| UPRO | ProShares UltraPro S&P500 | | 62.46 | 58 | 2.81 | 5.58 | 14.1% |
| SPXL | Direxion Daily S&P500 Bull 3X ETF | | 118.62 | 58 | 2.75 | 5.39 | 14.07% |
| SH | ProShares Short S&P500 | | 12.35 | 42 | -1.12 | -1.91 | -4.93% |
| SDS | ProShares UltraShort S&P500 | | 26.81 | 37 | -2.19 | -3.91 | -10.39% |
| SPXU | ProShares UltraPro Short S&P500 | | 36.10 | 42 | -3.31 | -5.8 | -16.03% |
| SPXS | Direxion Daily S&P 500 Bear 3X ETF | | 9.82 | 32 | -4.75 | -5.21 | -14.98% |
| 12Stocks.com: Charts, Trends, Fundamental Data and Performances of S&P 500 Stocks | |
|
We now take in-depth look at all S&P 500 stocks including charts, multi-period performances and overall trends (as measured by Smart Investing & Trading Score). One can sort S&P 500 stocks (click link to choose) by Daily, Weekly and by Year-to-Date performances. Also, one can sort by size of the company or by market capitalization. |
| Select Your Default Chart Type: | |||||
| |||||
| Click on stock symbol or name for detailed view. Click on to add stock symbol to your watchlist and to view watchlist. Quick View: Move mouse or cursor over "Daily" to quickly view daily technical stock chart and over "Weekly" to view weekly technical stock chart. | |||||

 | TRMB Trimble Inc. |
| Sector: Technology | |
| SubSector: Scientific & Technical Instruments | |
| MarketCap: 7990.33 Millions | |
| Recent Price: 59.66 Smart Investing & Trading Score: 68 | |
| Day Percent Change: 1.22% Day Change: 0.72 | |
| Week Change: 2.92% Year-to-date Change: 12.1% | |
| TRMB Links: Profile News Message Board | |
| Charts:- Daily , Weekly | |
| Add TRMB to Watchlist: View: Get TRMB Trend Analysis ➞ | |
 | CPRT Copart, Inc. |
| Sector: Services & Goods | |
| SubSector: Auto Dealerships | |
| MarketCap: 15462.1 Millions | |
| Recent Price: 53.95 Smart Investing & Trading Score: 58 | |
| Day Percent Change: 1.21% Day Change: 0.65 | |
| Week Change: 2.01% Year-to-date Change: 10.1% | |
| CPRT Links: Profile News Message Board | |
| Charts:- Daily , Weekly | |
| Add CPRT to Watchlist: View: Get CPRT Trend Analysis ➞ | |
 | TXN Texas Instruments Incorporated |
| Sector: Technology | |
| SubSector: Semiconductor - Broad Line | |
| MarketCap: 99509.1 Millions | |
| Recent Price: 165.41 Smart Investing & Trading Score: 68 | |
| Day Percent Change: 1.21% Day Change: 1.98 | |
| Week Change: 3.59% Year-to-date Change: -3.0% | |
| TXN Links: Profile News Message Board | |
| Charts:- Daily , Weekly | |
| Add TXN to Watchlist: View: Get TXN Trend Analysis ➞ | |
 | TDY Teledyne Technologies Incorporated |
| Sector: Technology | |
| SubSector: Scientific & Technical Instruments | |
| MarketCap: 9360.43 Millions | |
| Recent Price: 408.93 Smart Investing & Trading Score: 49 | |
| Day Percent Change: 1.20% Day Change: 4.85 | |
| Week Change: 1.89% Year-to-date Change: -8.4% | |
| TDY Links: Profile News Message Board | |
| Charts:- Daily , Weekly | |
| Add TDY to Watchlist: View: Get TDY Trend Analysis ➞ | |
 | DLR Digital Realty Trust, Inc. |
| Sector: Financials | |
| SubSector: REIT - Office | |
| MarketCap: 27038.6 Millions | |
| Recent Price: 137.49 Smart Investing & Trading Score: 18 | |
| Day Percent Change: 1.20% Day Change: 1.63 | |
| Week Change: 0.48% Year-to-date Change: 2.2% | |
| DLR Links: Profile News Message Board | |
| Charts:- Daily , Weekly | |
| Add DLR to Watchlist: View: Get DLR Trend Analysis ➞ | |
 | GRMN Garmin Ltd. |
| Sector: Technology | |
| SubSector: Scientific & Technical Instruments | |
| MarketCap: 13909.3 Millions | |
| Recent Price: 142.68 Smart Investing & Trading Score: 63 | |
| Day Percent Change: 1.18% Day Change: 1.66 | |
| Week Change: 2.26% Year-to-date Change: 11.0% | |
| GRMN Links: Profile News Message Board | |
| Charts:- Daily , Weekly | |
| Add GRMN to Watchlist: View: Get GRMN Trend Analysis ➞ | |
 | SPG Simon Property Group, Inc. |
| Sector: Financials | |
| SubSector: REIT - Retail | |
| MarketCap: 17959.6 Millions | |
| Recent Price: 144.07 Smart Investing & Trading Score: 58 | |
| Day Percent Change: 1.17% Day Change: 1.66 | |
| Week Change: 2.58% Year-to-date Change: 1.0% | |
| SPG Links: Profile News Message Board | |
| Charts:- Daily , Weekly | |
| Add SPG to Watchlist: View: Get SPG Trend Analysis ➞ | |
 | EFX Equifax Inc. |
| Sector: Financials | |
| SubSector: Credit Services | |
| MarketCap: 13754.6 Millions | |
| Recent Price: 221.49 Smart Investing & Trading Score: 32 | |
| Day Percent Change: 1.17% Day Change: 2.56 | |
| Week Change: 2.45% Year-to-date Change: -10.4% | |
| EFX Links: Profile News Message Board | |
| Charts:- Daily , Weekly | |
| Add EFX to Watchlist: View: Get EFX Trend Analysis ➞ | |
 | JBL Jabil Inc. |
| Sector: Technology | |
| SubSector: Printed Circuit Boards | |
| MarketCap: 3272.15 Millions | |
| Recent Price: 120.52 Smart Investing & Trading Score: 17 | |
| Day Percent Change: 1.17% Day Change: 1.39 | |
| Week Change: 1.49% Year-to-date Change: -5.4% | |
| JBL Links: Profile News Message Board | |
| Charts:- Daily , Weekly | |
| Add JBL to Watchlist: View: Get JBL Trend Analysis ➞ | |
 | DOV Dover Corporation |
| Sector: Industrials | |
| SubSector: Diversified Machinery | |
| MarketCap: 10725.6 Millions | |
| Recent Price: 172.28 Smart Investing & Trading Score: 68 | |
| Day Percent Change: 1.17% Day Change: 2.00 | |
| Week Change: 1.44% Year-to-date Change: 12.0% | |
| DOV Links: Profile News Message Board | |
| Charts:- Daily , Weekly | |
| Add DOV to Watchlist: View: Get DOV Trend Analysis ➞ | |
 | IR Ingersoll Rand Inc. |
| Sector: Industrials | |
| SubSector: Diversified Machinery | |
| MarketCap: 8970.56 Millions | |
| Recent Price: 89.67 Smart Investing & Trading Score: 58 | |
| Day Percent Change: 1.17% Day Change: 1.04 | |
| Week Change: 1.44% Year-to-date Change: 15.9% | |
| IR Links: Profile News Message Board | |
| Charts:- Daily , Weekly | |
| Add IR to Watchlist: View: Get IR Trend Analysis ➞ | |
 | ZION Zions Bancorporation, National Association |
| Sector: Financials | |
| SubSector: Regional - Pacific Banks | |
| MarketCap: 4577.89 Millions | |
| Recent Price: 41.80 Smart Investing & Trading Score: 80 | |
| Day Percent Change: 1.16% Day Change: 0.48 | |
| Week Change: 4.71% Year-to-date Change: -4.7% | |
| ZION Links: Profile News Message Board | |
| Charts:- Daily , Weekly | |
| Add ZION to Watchlist: View: Get ZION Trend Analysis ➞ | |
 | NTRS Northern Trust Corporation |
| Sector: Financials | |
| SubSector: Asset Management | |
| MarketCap: 15316.8 Millions | |
| Recent Price: 84.50 Smart Investing & Trading Score: 68 | |
| Day Percent Change: 1.15% Day Change: 0.96 | |
| Week Change: 3.74% Year-to-date Change: 0.1% | |
| NTRS Links: Profile News Message Board | |
| Charts:- Daily , Weekly | |
| Add NTRS to Watchlist: View: Get NTRS Trend Analysis ➞ | |
 | HOLX Hologic, Inc. |
| Sector: Health Care | |
| SubSector: Medical Instruments & Supplies | |
| MarketCap: 9075.2 Millions | |
| Recent Price: 77.10 Smart Investing & Trading Score: 68 | |
| Day Percent Change: 1.15% Day Change: 0.88 | |
| Week Change: 2.28% Year-to-date Change: 7.9% | |
| HOLX Links: Profile News Message Board | |
| Charts:- Daily , Weekly | |
| Add HOLX to Watchlist: View: Get HOLX Trend Analysis ➞ | |
 | MAS Masco Corporation |
| Sector: Industrials | |
| SubSector: General Building Materials | |
| MarketCap: 8655.63 Millions | |
| Recent Price: 72.85 Smart Investing & Trading Score: 58 | |
| Day Percent Change: 1.15% Day Change: 0.83 | |
| Week Change: 1.31% Year-to-date Change: 8.8% | |
| MAS Links: Profile News Message Board | |
| Charts:- Daily , Weekly | |
| Add MAS to Watchlist: View: Get MAS Trend Analysis ➞ | |
 | EQT EQT Corporation |
| Sector: Energy | |
| SubSector: Independent Oil & Gas | |
| MarketCap: 1886.63 Millions | |
| Recent Price: 38.41 Smart Investing & Trading Score: 100 | |
| Day Percent Change: 1.15% Day Change: 0.44 | |
| Week Change: 4.79% Year-to-date Change: -0.7% | |
| EQT Links: Profile News Message Board | |
| Charts:- Daily , Weekly | |
| Add EQT to Watchlist: View: Get EQT Trend Analysis ➞ | |
 | IBM International Business Machines Corporation |
| Sector: Technology | |
| SubSector: Information Technology Services | |
| MarketCap: 97241.6 Millions | |
| Recent Price: 184.00 Smart Investing & Trading Score: 45 | |
| Day Percent Change: 1.15% Day Change: 2.10 | |
| Week Change: 1.33% Year-to-date Change: 12.5% | |
| IBM Links: Profile News Message Board | |
| Charts:- Daily , Weekly | |
| Add IBM to Watchlist: View: Get IBM Trend Analysis ➞ | |
 | DFS Discover Financial Services |
| Sector: Financials | |
| SubSector: Credit Services | |
| MarketCap: 9228.88 Millions | |
| Recent Price: 128.13 Smart Investing & Trading Score: 90 | |
| Day Percent Change: 1.15% Day Change: 1.45 | |
| Week Change: 2.22% Year-to-date Change: 14.0% | |
| DFS Links: Profile News Message Board | |
| Charts:- Daily , Weekly | |
| Add DFS to Watchlist: View: Get DFS Trend Analysis ➞ | |
 | ESS Essex Property Trust, Inc. |
| Sector: Financials | |
| SubSector: REIT - Residential | |
| MarketCap: 13725.5 Millions | |
| Recent Price: 242.63 Smart Investing & Trading Score: 100 | |
| Day Percent Change: 1.14% Day Change: 2.74 | |
| Week Change: 3.17% Year-to-date Change: -2.1% | |
| ESS Links: Profile News Message Board | |
| Charts:- Daily , Weekly | |
| Add ESS to Watchlist: View: Get ESS Trend Analysis ➞ | |
 | JKHY Jack Henry & Associates, Inc. |
| Sector: Technology | |
| SubSector: Information Technology Services | |
| MarketCap: 10695.4 Millions | |
| Recent Price: 166.70 Smart Investing & Trading Score: 55 | |
| Day Percent Change: 1.13% Day Change: 1.86 | |
| Week Change: 0.66% Year-to-date Change: 2.0% | |
| JKHY Links: Profile News Message Board | |
| Charts:- Daily , Weekly | |
| Add JKHY to Watchlist: View: Get JKHY Trend Analysis ➞ | |
 | AME AMETEK, Inc. |
| Sector: Industrials | |
| SubSector: Diversified Machinery | |
| MarketCap: 16611.8 Millions | |
| Recent Price: 179.86 Smart Investing & Trading Score: 63 | |
| Day Percent Change: 1.12% Day Change: 2.00 | |
| Week Change: 1.22% Year-to-date Change: 9.1% | |
| AME Links: Profile News Message Board | |
| Charts:- Daily , Weekly | |
| Add AME to Watchlist: View: Get AME Trend Analysis ➞ | |
 | ALLE Allegion plc |
| Sector: Services & Goods | |
| SubSector: Security & Protection Services | |
| MarketCap: 8515.93 Millions | |
| Recent Price: 126.82 Smart Investing & Trading Score: 58 | |
| Day Percent Change: 1.12% Day Change: 1.40 | |
| Week Change: 1.29% Year-to-date Change: 0.1% | |
| ALLE Links: Profile News Message Board | |
| Charts:- Daily , Weekly | |
| Add ALLE to Watchlist: View: Get ALLE Trend Analysis ➞ | |
 | JPM JPMorgan Chase & Co. |
| Sector: Financials | |
| SubSector: Money Center Banks | |
| MarketCap: 279736 Millions | |
| Recent Price: 191.50 Smart Investing & Trading Score: 70 | |
| Day Percent Change: 1.10% Day Change: 2.09 | |
| Week Change: 3.07% Year-to-date Change: 12.6% | |
| JPM Links: Profile News Message Board | |
| Charts:- Daily , Weekly | |
| Add JPM to Watchlist: View: Get JPM Trend Analysis ➞ | |
 | FITB Fifth Third Bancorp |
| Sector: Financials | |
| SubSector: Regional - Midwest Banks | |
| MarketCap: 10197 Millions | |
| Recent Price: 36.95 Smart Investing & Trading Score: 100 | |
| Day Percent Change: 1.09% Day Change: 0.40 | |
| Week Change: 1.93% Year-to-date Change: 7.1% | |
| FITB Links: Profile News Message Board | |
| Charts:- Daily , Weekly | |
| Add FITB to Watchlist: View: Get FITB Trend Analysis ➞ | |
 | IRM Iron Mountain Incorporated |
| Sector: Technology | |
| SubSector: Business Software & Services | |
| MarketCap: 7339.18 Millions | |
| Recent Price: 76.66 Smart Investing & Trading Score: 70 | |
| Day Percent Change: 1.07% Day Change: 0.81 | |
| Week Change: 2.08% Year-to-date Change: 9.6% | |
| IRM Links: Profile News Message Board | |
| Charts:- Daily , Weekly | |
| Add IRM to Watchlist: View: Get IRM Trend Analysis ➞ | |
| For tabular summary view of above stock list: Summary View ➞ 0 - 25 , 25 - 50 , 50 - 75 , 75 - 100 , 100 - 125 , 125 - 150 , 150 - 175 , 175 - 200 , 200 - 225 , 225 - 250 , 250 - 275 , 275 - 300 , 300 - 325 , 325 - 350 , 350 - 375 , 375 - 400 , 400 - 425 , 425 - 450 , 450 - 475 | ||
| Click To Change The Sort Order: By Market Cap or Company Size Performance: Year-to-date, Week and Day | |
| Select Chart Type: | ||
|
Best Stocks Today 12Stocks.com |
© 2024 12Stocks.com Terms & Conditions Privacy Contact Us
All Information Provided Only For Education And Not To Be Used For Investing or Trading. See Terms & Conditions


One More Thing ... Get Best Stocks Delivered Daily!
Never Ever Miss A Move With Our Top Ten Stocks Lists
Find Best Stocks In Any Market - Bull or Bear Market
Take A Peek At Our Top Ten Stocks Lists: Daily, Weekly, Year-to-Date & Top Trends
Find Best Stocks In Any Market - Bull or Bear Market
Take A Peek At Our Top Ten Stocks Lists: Daily, Weekly, Year-to-Date & Top Trends
S&P 500 Stocks With Best Up Trends [0-bearish to 100-bullish]: Danaher [100], Kimberly-Clark [100], Quest Diagnostics[100], Philip Morris[100], NextEra [100], Generac Holdings[100], American Express[100], Equity Residential[100], Bank of America[100], EQT [100], Essex Property[100]
Best S&P 500 Stocks Year-to-Date:
NVIDIA [65.78%], Constellation [59.81%], Meta Platforms[38.84%], NRG [37.53%], Progressive [33.94%], Marathon [32.82%], Targa Resources[31.85%], Western Digital[31.75%], Micron [30.88%], United Airlines[30.85%], Diamondback [30.11%] Best S&P 500 Stocks This Week:
NVIDIA [7.74%], General Electric[7.36%], Enphase [7.28%], Kimberly-Clark [7.12%], Danaher [7.03%], General Motors[6.87%], Ford Motor[6.63%], Quest Diagnostics[6.08%], Pulte [5.96%], Charles River[5.72%], Illumina [5.69%] Best S&P 500 Stocks Daily:
Danaher [6.77%], General Electric[5.83%], Kimberly-Clark [5.38%], General Motors[4.79%], Quest Diagnostics[4.74%], United Rentals[4.51%], Waters [4.22%], Thermo Fisher[4.00%], Builders FirstSource[3.92%], Norwegian Cruise[3.75%], Bio-Rad [3.61%]