
 Login Sign Up


| |||||
 |  | ||||

| 12Stocks.com Market Intelligence |
Best S&P 500 Stocks
|
On this page, you will find the most comprehensive analysis of S&P 500 stocks and ETFs - from latest trends to performances to charts ➞. First, here are the year-to-date (YTD) performances of the most requested S&P 500 stocks at 12Stocks.com (click stock for review):
| NVIDIA 66% | ||
| Caterpillar 23% | ||
| Amazon.com 18% | ||
| Merck 16% | ||
| Google 13% | ||
| JPMorgan Chase 13% | ||
| Walmart 12% | ||
| Goldman Sachs 10% | ||
| Chevron 9% | ||
| Microsoft 8% | ||
| Johnson & Johnson -5% | ||
| McDonald s -7% | ||
| Starbucks -8% | ||
| Apple -13% | ||
| Gilead -17% | ||
| Intel -32% | ||
| Boeing -35% | ||
| Quick: S&P 500 Stocks Lists: Performances & Trends, S&P 500 Stock Charts
Sort S&P 500 stocks: Daily, Weekly, Year-to-Date, Market Cap & Trends. Filter S&P 500 stocks list by sector: Show all, Tech, Finance, Energy, Staples, Retail, Industrial, Materials, Utilities and HealthCare |
| 12Stocks.com S&P 500 Stocks Performances & Trends Daily Report | |||||||||
|
| 
The overall Smart Investing & Trading Score is 58 (0-bearish to 100-bullish) which puts S&P 500 index in short term neutral trend. The Smart Investing & Trading Score from previous trading session is 51 and hence an improvement of trend. | ||||||||
Here are the Smart Investing & Trading Scores of the most requested S&P 500 stocks at 12Stocks.com (click stock name for detailed review):
|


| 12Stocks.com: Top Performing S&P 500 Index Stocks | ||||||||||||||||||||||||||||||||||||||||||||||||
 The top performing S&P 500 Index stocks year to date are
Now, more recently, over last week, the top performing S&P 500 Index stocks on the move are


|
||||||||||||||||||||||||||||||||||||||||||||||||
| 12Stocks.com: Investing in S&P 500 Index with Stocks | |
|
The following table helps investors and traders sort through current performance and trends (as measured by Smart Investing & Trading Score) of various
stocks in the S&P 500 Index. Quick View: Move mouse or cursor over stock symbol (ticker) to view short-term technical chart and over stock name to view long term chart. Click on  to add stock symbol to your watchlist and to add stock symbol to your watchlist and  to view watchlist. Click on any ticker or stock name for detailed market intelligence report for that stock. to view watchlist. Click on any ticker or stock name for detailed market intelligence report for that stock. |
12Stocks.com Performance of Stocks in S&P 500 Index
| Ticker | Stock Name | Watchlist | Category | Recent Price | Smart Investing & Trading Score | Change % | YTD Change% |
| HLT | Hilton Worldwide |   | Services & Goods | 197.04 | 43 | 0.97 | 8.21% |
| AVB | AvalonBay Communities | | Financials | 188.66 | 100 | 0.96 | 0.77% |
| SPG | Simon Property | | Financials | 143.78 | 58 | 0.96 | 0.80% |
| MAR | Marriott | | Services & Goods | 239.69 | 45 | 0.96 | 6.29% |
| EQIX | Equinix | | Financials | 761.90 | 42 | 0.95 | -5.40% |
| ESS | Essex Property | | Financials | 242.15 | 100 | 0.94 | -2.34% |
| EW | Edwards Life | | Health Care | 87.75 | 68 | 0.91 | 15.08% |
| RF | Regions Financial | | Financials | 19.35 | 68 | 0.89 | -0.15% |
| MDT | Medtronic | | Health Care | 81.29 | 42 | 0.89 | -1.32% |
| MCK | McKesson | | Services & Goods | 532.00 | 65 | 0.89 | 14.91% |
| EQR | Equity Residential | | Financials | 63.09 | 100 | 0.88 | 3.16% |
| FANG | Diamondback | | Energy | 204.37 | 76 | 0.88 | 31.78% |
| DRI | Darden Restaurants | | Services & Goods | 155.90 | 57 | 0.87 | -5.11% |
| AKAM | Akamai Technologies | | Technology | 101.76 | 42 | 0.87 | -14.02% |
| HD | Home Depot | | Services & Goods | 339.00 | 32 | 0.86 | -2.18% |
| BLK | BlackRock | | Financials | 766.62 | 32 | 0.86 | -5.57% |
| BR | Broadridge Financial | | Technology | 195.91 | 32 | 0.86 | -4.78% |
| DVN | Devon | | Energy | 52.57 | 68 | 0.84 | 16.05% |
| FIS | Fidelity National | | Technology | 71.90 | 68 | 0.84 | 19.69% |
| HUM | Humana | | Health Care | 327.98 | 57 | 0.82 | -28.36% |
| JCI | Johnson Controls | | Consumer Staples | 65.17 | 68 | 0.82 | 13.06% |
| MTB | M&T Bank | | Financials | 146.86 | 100 | 0.81 | 7.13% |
| REGN | Regeneron | | Health Care | 907.32 | 32 | 0.80 | 3.31% |
| LULU | Lululemon Athletica | | Consumer Staples | 364.68 | 64 | 0.80 | -28.67% |
| QRVO | Qorvo | | Technology | 107.98 | 56 | 0.80 | -4.11% |
| For chart view version of above stock list: Chart View ➞ 0 - 25 , 25 - 50 , 50 - 75 , 75 - 100 , 100 - 125 , 125 - 150 , 150 - 175 , 175 - 200 , 200 - 225 , 225 - 250 , 250 - 275 , 275 - 300 , 300 - 325 , 325 - 350 , 350 - 375 , 375 - 400 , 400 - 425 , 425 - 450 , 450 - 475 , 475 - 500 | ||
 | Click To Change The Sort Order: By Market Cap or Company Size Performance: Year-to-date, Week and Day |  |
|
Get the most comprehensive stock market coverage daily at 12Stocks.com ➞ Best Stocks Today ➞ Best Stocks Weekly ➞ Best Stocks Year-to-Date ➞ Best Stocks Trends ➞  Best Stocks Today 12Stocks.com Best Nasdaq Stocks ➞ Best S&P 500 Stocks ➞ Best Tech Stocks ➞ Best Biotech Stocks ➞ |
| Detailed Overview of S&P 500 Stocks |
| S&P 500 Technical Overview, Leaders & Laggards, Top S&P 500 ETF Funds & Detailed S&P 500 Stocks List, Charts, Trends & More |
| S&P 500: Technical Analysis, Trends & YTD Performance | |
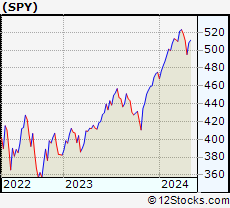
| S&P 500 index as represented by
SPY, an exchange-traded fund [ETF], holds basket of five hundred (mostly largecap) stocks from across all major sectors of the US stock market. The S&P 500 index (contains stocks like Apple and Exxon) is up by 6.38% and is currently outperforming the overall market by 0.74% year-to-date. Below is a quick view of technical charts and trends: | |
 SPY Weekly Chart |
|
| Long Term Trend: Good | |
| Medium Term Trend: Not Good | |
 SPY Daily Chart |
|
| Short Term Trend: Very Good | |
| Overall Trend Score: 58 | |
| YTD Performance: 6.38% | |
| **Trend Scores & Views Are Only For Educational Purposes And Not For Investing | |
| 12Stocks.com: Investing in S&P 500 Index using Exchange Traded Funds | |
|
The following table shows list of key exchange traded funds (ETF) that
help investors track S&P 500 index. The following list also includes leveraged ETF funds that track twice or thrice the daily returns of S&P 500 indices. Short or inverse ETF funds move in the opposite direction to the index they track and are useful during market pullbacks or during bear markets. Quick View: Move mouse or cursor over ETF symbol (ticker) to view short-term technical chart and over ETF name to view long term chart. Click on ticker or stock name for detailed view. Click on to add stock symbol to your watchlist and to view watchlist. |
12Stocks.com List of ETFs that track S&P 500 Index
| Ticker | ETF Name | Watchlist | Recent Price | Smart Investing & Trading Score | Change % | Week % | Year-to-date % |
| SPY | SPDR S&P 500 ETF | | 505.65 | 58 | 1.19 | 2.12 | 6.38% |
| IVV | iShares Core S&P 500 ETF | | 508.17 | 63 | 2.00 | 2.14 | 6.39% |
| VOO | Vanguard 500 ETF | | 464.84 | 63 | 2.03 | 2.14 | 6.42% |
| OEF | iShares S&P 100 | | 239.95 | 58 | 1.33 | 2.25 | 7.41% |
| SSO | ProShares Ultra S&P500 | | 72.04 | 58 | 2.43 | 4.24 | 10.71% |
| UPRO | ProShares UltraPro S&P500 | | 62.93 | 58 | 3.59 | 6.37 | 14.96% |
| SPXL | Direxion Daily S&P500 Bull 3X ETF | | 119.51 | 63 | 3.52 | 6.18 | 14.92% |
| SH | ProShares Short S&P500 | | 12.34 | 42 | -1.20 | -1.99 | -5% |
| SDS | ProShares UltraShort S&P500 | | 26.78 | 37 | -2.30 | -4.01 | -10.49% |
| SPXU | ProShares UltraPro Short S&P500 | | 35.99 | 42 | -3.62 | -6.1 | -16.3% |
| SPXS | Direxion Daily S&P 500 Bear 3X ETF | | 9.75 | 32 | -5.43 | -5.89 | -15.58% |
| 12Stocks.com: Charts, Trends, Fundamental Data and Performances of S&P 500 Stocks | |
|
We now take in-depth look at all S&P 500 stocks including charts, multi-period performances and overall trends (as measured by Smart Investing & Trading Score). One can sort S&P 500 stocks (click link to choose) by Daily, Weekly and by Year-to-Date performances. Also, one can sort by size of the company or by market capitalization. |
| Select Your Default Chart Type: | |||||
| |||||
| Click on stock symbol or name for detailed view. Click on to add stock symbol to your watchlist and to view watchlist. Quick View: Move mouse or cursor over "Daily" to quickly view daily technical stock chart and over "Weekly" to view weekly technical stock chart. | |||||

 | HLT Hilton Worldwide Holdings Inc. |
| Sector: Services & Goods | |
| SubSector: Lodging | |
| MarketCap: 18064.6 Millions | |
| Recent Price: 197.04 Smart Investing & Trading Score: 43 | |
| Day Percent Change: 0.97% Day Change: 1.90 | |
| Week Change: 1.32% Year-to-date Change: 8.2% | |
| HLT Links: Profile News Message Board | |
| Charts:- Daily , Weekly | |
| Add HLT to Watchlist: View: Get HLT Trend Analysis ➞ | |
 | AVB AvalonBay Communities, Inc. |
| Sector: Financials | |
| SubSector: REIT - Residential | |
| MarketCap: 19921.9 Millions | |
| Recent Price: 188.66 Smart Investing & Trading Score: 100 | |
| Day Percent Change: 0.96% Day Change: 1.79 | |
| Week Change: 2.46% Year-to-date Change: 0.8% | |
| AVB Links: Profile News Message Board | |
| Charts:- Daily , Weekly | |
| Add AVB to Watchlist: View: Get AVB Trend Analysis ➞ | |
 | SPG Simon Property Group, Inc. |
| Sector: Financials | |
| SubSector: REIT - Retail | |
| MarketCap: 17959.6 Millions | |
| Recent Price: 143.78 Smart Investing & Trading Score: 58 | |
| Day Percent Change: 0.96% Day Change: 1.37 | |
| Week Change: 2.38% Year-to-date Change: 0.8% | |
| SPG Links: Profile News Message Board | |
| Charts:- Daily , Weekly | |
| Add SPG to Watchlist: View: Get SPG Trend Analysis ➞ | |
 | MAR Marriott International, Inc. |
| Sector: Services & Goods | |
| SubSector: Lodging | |
| MarketCap: 25831.6 Millions | |
| Recent Price: 239.69 Smart Investing & Trading Score: 45 | |
| Day Percent Change: 0.96% Day Change: 2.28 | |
| Week Change: 1.56% Year-to-date Change: 6.3% | |
| MAR Links: Profile News Message Board | |
| Charts:- Daily , Weekly | |
| Add MAR to Watchlist: View: Get MAR Trend Analysis ➞ | |
 | EQIX Equinix, Inc. (REIT) |
| Sector: Financials | |
| SubSector: REIT - Diversified | |
| MarketCap: 45855.3 Millions | |
| Recent Price: 761.90 Smart Investing & Trading Score: 42 | |
| Day Percent Change: 0.95% Day Change: 7.16 | |
| Week Change: 1.86% Year-to-date Change: -5.4% | |
| EQIX Links: Profile News Message Board | |
| Charts:- Daily , Weekly | |
| Add EQIX to Watchlist: View: Get EQIX Trend Analysis ➞ | |
 | ESS Essex Property Trust, Inc. |
| Sector: Financials | |
| SubSector: REIT - Residential | |
| MarketCap: 13725.5 Millions | |
| Recent Price: 242.15 Smart Investing & Trading Score: 100 | |
| Day Percent Change: 0.94% Day Change: 2.26 | |
| Week Change: 2.97% Year-to-date Change: -2.3% | |
| ESS Links: Profile News Message Board | |
| Charts:- Daily , Weekly | |
| Add ESS to Watchlist: View: Get ESS Trend Analysis ➞ | |
 | EW Edwards Lifesciences Corporation |
| Sector: Health Care | |
| SubSector: Medical Appliances & Equipment | |
| MarketCap: 36735.5 Millions | |
| Recent Price: 87.75 Smart Investing & Trading Score: 68 | |
| Day Percent Change: 0.91% Day Change: 0.79 | |
| Week Change: 2.11% Year-to-date Change: 15.1% | |
| EW Links: Profile News Message Board | |
| Charts:- Daily , Weekly | |
| Add EW to Watchlist: View: Get EW Trend Analysis ➞ | |
 | RF Regions Financial Corporation |
| Sector: Financials | |
| SubSector: Regional - Southeast Banks | |
| MarketCap: 8936.25 Millions | |
| Recent Price: 19.35 Smart Investing & Trading Score: 68 | |
| Day Percent Change: 0.89% Day Change: 0.17 | |
| Week Change: 2.38% Year-to-date Change: -0.2% | |
| RF Links: Profile News Message Board | |
| Charts:- Daily , Weekly | |
| Add RF to Watchlist: View: Get RF Trend Analysis ➞ | |
 | MDT Medtronic plc |
| Sector: Health Care | |
| SubSector: Medical Appliances & Equipment | |
| MarketCap: 113698 Millions | |
| Recent Price: 81.29 Smart Investing & Trading Score: 42 | |
| Day Percent Change: 0.89% Day Change: 0.72 | |
| Week Change: 2.28% Year-to-date Change: -1.3% | |
| MDT Links: Profile News Message Board | |
| Charts:- Daily , Weekly | |
| Add MDT to Watchlist: View: Get MDT Trend Analysis ➞ | |
 | MCK McKesson Corporation |
| Sector: Services & Goods | |
| SubSector: Drugs Wholesale | |
| MarketCap: 24096.7 Millions | |
| Recent Price: 532.00 Smart Investing & Trading Score: 65 | |
| Day Percent Change: 0.89% Day Change: 4.68 | |
| Week Change: 1.37% Year-to-date Change: 14.9% | |
| MCK Links: Profile News Message Board | |
| Charts:- Daily , Weekly | |
| Add MCK to Watchlist: View: Get MCK Trend Analysis ➞ | |
 | EQR Equity Residential |
| Sector: Financials | |
| SubSector: REIT - Residential | |
| MarketCap: 22061.9 Millions | |
| Recent Price: 63.09 Smart Investing & Trading Score: 100 | |
| Day Percent Change: 0.88% Day Change: 0.55 | |
| Week Change: 2.52% Year-to-date Change: 3.2% | |
| EQR Links: Profile News Message Board | |
| Charts:- Daily , Weekly | |
| Add EQR to Watchlist: View: Get EQR Trend Analysis ➞ | |
 | FANG Diamondback Energy, Inc. |
| Sector: Energy | |
| SubSector: Independent Oil & Gas | |
| MarketCap: 3009.13 Millions | |
| Recent Price: 204.37 Smart Investing & Trading Score: 76 | |
| Day Percent Change: 0.88% Day Change: 1.79 | |
| Week Change: 1.81% Year-to-date Change: 31.8% | |
| FANG Links: Profile News Message Board | |
| Charts:- Daily , Weekly | |
| Add FANG to Watchlist: View: Get FANG Trend Analysis ➞ | |
 | DRI Darden Restaurants, Inc. |
| Sector: Services & Goods | |
| SubSector: Restaurants | |
| MarketCap: 5623.1 Millions | |
| Recent Price: 155.90 Smart Investing & Trading Score: 57 | |
| Day Percent Change: 0.87% Day Change: 1.35 | |
| Week Change: 2.23% Year-to-date Change: -5.1% | |
| DRI Links: Profile News Message Board | |
| Charts:- Daily , Weekly | |
| Add DRI to Watchlist: View: Get DRI Trend Analysis ➞ | |
 | AKAM Akamai Technologies, Inc. |
| Sector: Technology | |
| SubSector: Internet Information Providers | |
| MarketCap: 14495.5 Millions | |
| Recent Price: 101.76 Smart Investing & Trading Score: 42 | |
| Day Percent Change: 0.87% Day Change: 0.88 | |
| Week Change: 0.26% Year-to-date Change: -14.0% | |
| AKAM Links: Profile News Message Board | |
| Charts:- Daily , Weekly | |
| Add AKAM to Watchlist: View: Get AKAM Trend Analysis ➞ | |
 | HD The Home Depot, Inc. |
| Sector: Services & Goods | |
| SubSector: Home Improvement Stores | |
| MarketCap: 185389 Millions | |
| Recent Price: 339.00 Smart Investing & Trading Score: 32 | |
| Day Percent Change: 0.86% Day Change: 2.89 | |
| Week Change: 1.09% Year-to-date Change: -2.2% | |
| HD Links: Profile News Message Board | |
| Charts:- Daily , Weekly | |
| Add HD to Watchlist: View: Get HD Trend Analysis ➞ | |
 | BLK BlackRock, Inc. |
| Sector: Financials | |
| SubSector: Asset Management | |
| MarketCap: 61284.9 Millions | |
| Recent Price: 766.62 Smart Investing & Trading Score: 32 | |
| Day Percent Change: 0.86% Day Change: 6.51 | |
| Week Change: 2.22% Year-to-date Change: -5.6% | |
| BLK Links: Profile News Message Board | |
| Charts:- Daily , Weekly | |
| Add BLK to Watchlist: View: Get BLK Trend Analysis ➞ | |
 | BR Broadridge Financial Solutions, Inc. |
| Sector: Technology | |
| SubSector: Information Technology Services | |
| MarketCap: 10633.8 Millions | |
| Recent Price: 195.91 Smart Investing & Trading Score: 32 | |
| Day Percent Change: 0.86% Day Change: 1.68 | |
| Week Change: 1.31% Year-to-date Change: -4.8% | |
| BR Links: Profile News Message Board | |
| Charts:- Daily , Weekly | |
| Add BR to Watchlist: View: Get BR Trend Analysis ➞ | |
 | DVN Devon Energy Corporation |
| Sector: Energy | |
| SubSector: Independent Oil & Gas | |
| MarketCap: 2693.03 Millions | |
| Recent Price: 52.57 Smart Investing & Trading Score: 68 | |
| Day Percent Change: 0.84% Day Change: 0.44 | |
| Week Change: 1.43% Year-to-date Change: 16.1% | |
| DVN Links: Profile News Message Board | |
| Charts:- Daily , Weekly | |
| Add DVN to Watchlist: View: Get DVN Trend Analysis ➞ | |
 | FIS Fidelity National Information Services, Inc. |
| Sector: Technology | |
| SubSector: Information Technology Services | |
| MarketCap: 71126.8 Millions | |
| Recent Price: 71.90 Smart Investing & Trading Score: 68 | |
| Day Percent Change: 0.84% Day Change: 0.60 | |
| Week Change: 1.65% Year-to-date Change: 19.7% | |
| FIS Links: Profile News Message Board | |
| Charts:- Daily , Weekly | |
| Add FIS to Watchlist: View: Get FIS Trend Analysis ➞ | |
 | HUM Humana Inc. |
| Sector: Health Care | |
| SubSector: Health Care Plans | |
| MarketCap: 34125.6 Millions | |
| Recent Price: 327.98 Smart Investing & Trading Score: 57 | |
| Day Percent Change: 0.82% Day Change: 2.68 | |
| Week Change: -0.11% Year-to-date Change: -28.4% | |
| HUM Links: Profile News Message Board | |
| Charts:- Daily , Weekly | |
| Add HUM to Watchlist: View: Get HUM Trend Analysis ➞ | |
 | JCI Johnson Controls International plc |
| Sector: Consumer Staples | |
| SubSector: Auto Parts | |
| MarketCap: 21950.7 Millions | |
| Recent Price: 65.17 Smart Investing & Trading Score: 68 | |
| Day Percent Change: 0.82% Day Change: 0.53 | |
| Week Change: 2.37% Year-to-date Change: 13.1% | |
| JCI Links: Profile News Message Board | |
| Charts:- Daily , Weekly | |
| Add JCI to Watchlist: View: Get JCI Trend Analysis ➞ | |
 | MTB M&T Bank Corporation |
| Sector: Financials | |
| SubSector: Regional - Northeast Banks | |
| MarketCap: 13950.9 Millions | |
| Recent Price: 146.86 Smart Investing & Trading Score: 100 | |
| Day Percent Change: 0.81% Day Change: 1.18 | |
| Week Change: 2.43% Year-to-date Change: 7.1% | |
| MTB Links: Profile News Message Board | |
| Charts:- Daily , Weekly | |
| Add MTB to Watchlist: View: Get MTB Trend Analysis ➞ | |
 | REGN Regeneron Pharmaceuticals, Inc. |
| Sector: Health Care | |
| SubSector: Biotechnology | |
| MarketCap: 51903.7 Millions | |
| Recent Price: 907.32 Smart Investing & Trading Score: 32 | |
| Day Percent Change: 0.80% Day Change: 7.16 | |
| Week Change: 1.17% Year-to-date Change: 3.3% | |
| REGN Links: Profile News Message Board | |
| Charts:- Daily , Weekly | |
| Add REGN to Watchlist: View: Get REGN Trend Analysis ➞ | |
 | LULU Lululemon Athletica Inc. |
| Sector: Consumer Staples | |
| SubSector: Textile - Apparel Clothing | |
| MarketCap: 24627.8 Millions | |
| Recent Price: 364.68 Smart Investing & Trading Score: 64 | |
| Day Percent Change: 0.80% Day Change: 2.89 | |
| Week Change: 3.46% Year-to-date Change: -28.7% | |
| LULU Links: Profile News Message Board | |
| Charts:- Daily , Weekly | |
| Add LULU to Watchlist: View: Get LULU Trend Analysis ➞ | |
 | QRVO Qorvo, Inc. |
| Sector: Technology | |
| SubSector: Semiconductor - Broad Line | |
| MarketCap: 9524.32 Millions | |
| Recent Price: 107.98 Smart Investing & Trading Score: 56 | |
| Day Percent Change: 0.80% Day Change: 0.86 | |
| Week Change: 2.96% Year-to-date Change: -4.1% | |
| QRVO Links: Profile News Message Board | |
| Charts:- Daily , Weekly | |
| Add QRVO to Watchlist: View: Get QRVO Trend Analysis ➞ | |
| For tabular summary view of above stock list: Summary View ➞ 0 - 25 , 25 - 50 , 50 - 75 , 75 - 100 , 100 - 125 , 125 - 150 , 150 - 175 , 175 - 200 , 200 - 225 , 225 - 250 , 250 - 275 , 275 - 300 , 300 - 325 , 325 - 350 , 350 - 375 , 375 - 400 , 400 - 425 , 425 - 450 , 450 - 475 , 475 - 500 | ||
| Click To Change The Sort Order: By Market Cap or Company Size Performance: Year-to-date, Week and Day | |
| Select Chart Type: | ||
|
Best Stocks Today 12Stocks.com |
© 2024 12Stocks.com Terms & Conditions Privacy Contact Us
All Information Provided Only For Education And Not To Be Used For Investing or Trading. See Terms & Conditions


One More Thing ... Get Best Stocks Delivered Daily!
Never Ever Miss A Move With Our Top Ten Stocks Lists
Find Best Stocks In Any Market - Bull or Bear Market
Take A Peek At Our Top Ten Stocks Lists: Daily, Weekly, Year-to-Date & Top Trends
Find Best Stocks In Any Market - Bull or Bear Market
Take A Peek At Our Top Ten Stocks Lists: Daily, Weekly, Year-to-Date & Top Trends
S&P 500 Stocks With Best Up Trends [0-bearish to 100-bullish]: Danaher [100], Kimberly-Clark [100], Quest Diagnostics[100], Hasbro [100], Philip Morris[100], Citi [100], American Express[100], Truist Financial[100], Morgan Stanley[100], Federal Realty[100], Bank of America[100]
Best S&P 500 Stocks Year-to-Date:
NVIDIA [66.44%], Constellation [60.75%], Meta Platforms[40.09%], NRG [38.28%], Marathon [34.57%], Progressive [34.37%], Targa Resources[33.54%], Western Digital[33.51%], Micron [31.78%], Diamondback [31.78%], United Airlines[30.95%] Best S&P 500 Stocks This Week:
Globe Life[13.52%], General Electric[9.83%], NVIDIA [8.17%], Danaher [7.47%], Kimberly-Clark [7.26%], Pulte [6.95%], Norwegian Cruise[6.83%], Ford Motor[6.59%], Enphase [6.57%], General Motors[6.44%], Quest Diagnostics[6.43%] Best S&P 500 Stocks Daily:
Globe Life[14.11%], General Electric[8.28%], Danaher [7.21%], Kimberly-Clark [5.51%], Norwegian Cruise[5.39%], United Rentals[5.09%], Quest Diagnostics[5.08%], Builders FirstSource[5.07%], Thermo Fisher[4.78%], Waters [4.70%], Pulte [4.57%]