
 Login Sign Up


| |||||
 |  | ||||

| 12Stocks.com Market Intelligence |
Best S&P 500 Stocks
|
On this page, you will find the most comprehensive analysis of S&P 500 stocks and ETFs - from latest trends to performances to charts ➞. First, here are the year-to-date (YTD) performances of the most requested S&P 500 stocks at 12Stocks.com (click stock for review):
| NVIDIA 65% | ||
| Merck 19% | ||
| Caterpillar 15% | ||
| Walmart 14% | ||
| JPMorgan Chase 13% | ||
| Amazon.com 13% | ||
| Google 11% | ||
| Chevron 10% | ||
| Goldman Sachs 8% | ||
| Microsoft 4% | ||
| Johnson & Johnson -6% | ||
| McDonald s -7% | ||
| Starbucks -8% | ||
| Apple -12% | ||
| Gilead -19% | ||
| Intel -31% | ||
| Boeing -38% | ||
| Quick: S&P 500 Stocks Lists: Performances & Trends, S&P 500 Stock Charts
Sort S&P 500 stocks: Daily, Weekly, Year-to-Date, Market Cap & Trends. Filter S&P 500 stocks list by sector: Show all, Tech, Finance, Energy, Staples, Retail, Industrial, Materials, Utilities and HealthCare |
| 12Stocks.com S&P 500 Stocks Performances & Trends Daily Report | |||||||||
|
| 
The overall Smart Investing & Trading Score is 44 (0-bearish to 100-bullish) which puts S&P 500 index in short term neutral trend. The Smart Investing & Trading Score from previous trading session is 58 and hence a deterioration of trend. | ||||||||
Here are the Smart Investing & Trading Scores of the most requested S&P 500 stocks at 12Stocks.com (click stock name for detailed review):
|


| 12Stocks.com: Top Performing S&P 500 Index Stocks | ||||||||||||||||||||||||||||||||||||||||||||||||
 The top performing S&P 500 Index stocks year to date are
Now, more recently, over last week, the top performing S&P 500 Index stocks on the move are


|
||||||||||||||||||||||||||||||||||||||||||||||||
| 12Stocks.com: Investing in S&P 500 Index with Stocks | |
|
The following table helps investors and traders sort through current performance and trends (as measured by Smart Investing & Trading Score) of various
stocks in the S&P 500 Index. Quick View: Move mouse or cursor over stock symbol (ticker) to view short-term technical chart and over stock name to view long term chart. Click on  to add stock symbol to your watchlist and to add stock symbol to your watchlist and  to view watchlist. Click on any ticker or stock name for detailed market intelligence report for that stock. to view watchlist. Click on any ticker or stock name for detailed market intelligence report for that stock. |
12Stocks.com Performance of Stocks in S&P 500 Index
| Ticker | Stock Name | Watchlist | Category | Recent Price | Smart Investing & Trading Score | Change % | YTD Change% |
| NEM | Newmont |   | Materials | 41.88 | 100 | 8.50% | 1.18% |
| DOV | Dover | | Industrials | 178.89 | 100 | 4.35% | 16.31% |
| CMG | Chipotle Mexican | | Services & Goods | 3028.70 | 100 | 3.48% | 32.43% |
| MRK | Merck | | Health Care | 129.22 | 100 | 1.75% | 18.53% |
| NOC | Northrop Grumman | | Industrials | 478.20 | 100 | 0.76% | 2.15% |
| EQT | EQT | | Energy | 39.62 | 100 | 0.48% | 2.48% |
| BSX | Boston Scientific | | Health Care | 73.25 | 100 | 0.46% | 26.70% |
| KO | Coca-Cola | | Consumer Staples | 61.82 | 100 | 0.44% | 4.90% |
| MO | Altria | | Consumer Staples | 43.08 | 100 | 0.37% | 6.79% |
| HES | Hess | | Energy | 159.49 | 100 | 0.23% | 10.63% |
| CPB | Campbell Soup | | Consumer Staples | 45.63 | 100 | 0.20% | 5.55% |
| SYF | Synchrony Financial | | Financials | 44.20 | 100 | -1.83% | 15.72% |
| CFG | Citizens Financial | | Financials | 34.89 | 100 | -1.77% | 5.28% |
| DGX | Quest Diagnostics | | Health Care | 135.16 | 100 | -1.74% | -1.97% |
| FRT | Federal Realty | | Financials | 102.22 | 100 | -1.34% | -0.81% |
| KHC | Kraft Heinz | | Consumer Staples | 38.17 | 100 | -1.04% | 3.22% |
| ES | Eversource | | Utilities | 60.24 | 100 | -0.99% | -2.40% |
| AVB | AvalonBay Communities | | Financials | 189.54 | 100 | -0.94% | 1.24% |
| ESS | Essex Property | | Financials | 245.51 | 100 | -0.90% | -0.98% |
| TXN | Texas Instruments | | Technology | 173.41 | 100 | -0.80% | 1.73% |
| TMUS | T-Mobile US | | Technology | 162.89 | 100 | -0.79% | 1.60% |
| YUM | Yum! Brands | | Services & Goods | 140.72 | 100 | -0.77% | 7.70% |
| KMB | Kimberly-Clark | | Consumer Staples | 136.96 | 100 | -0.60% | 12.72% |
| LNT | Alliant | | Utilities | 50.07 | 100 | -0.60% | -2.40% |
| AEP | American Electric | | Utilities | 85.92 | 100 | -0.52% | 5.79% |
| For chart view version of above stock list: Chart View ➞ 0 - 25 , 25 - 50 , 50 - 75 , 75 - 100 , 100 - 125 , 125 - 150 , 150 - 175 , 175 - 200 , 200 - 225 , 225 - 250 , 250 - 275 , 275 - 300 , 300 - 325 , 325 - 350 , 350 - 375 , 375 - 400 , 400 - 425 , 425 - 450 , 450 - 475 , 475 - 500 | ||
 | Click To Change The Sort Order: By Market Cap or Company Size Performance: Year-to-date, Week and Day |  |
|
Get the most comprehensive stock market coverage daily at 12Stocks.com ➞ Best Stocks Today ➞ Best Stocks Weekly ➞ Best Stocks Year-to-Date ➞ Best Stocks Trends ➞  Best Stocks Today 12Stocks.com Best Nasdaq Stocks ➞ Best S&P 500 Stocks ➞ Best Tech Stocks ➞ Best Biotech Stocks ➞ |
| Detailed Overview of S&P 500 Stocks |
| S&P 500 Technical Overview, Leaders & Laggards, Top S&P 500 ETF Funds & Detailed S&P 500 Stocks List, Charts, Trends & More |
| S&P 500: Technical Analysis, Trends & YTD Performance | |
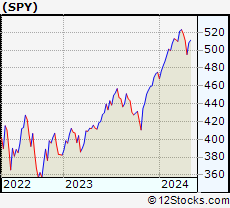
| S&P 500 index as represented by
SPY, an exchange-traded fund [ETF], holds basket of five hundred (mostly largecap) stocks from across all major sectors of the US stock market. The S&P 500 index (contains stocks like Apple and Exxon) is up by 4.99% and is currently outperforming the overall market by 0.74% year-to-date. Below is a quick view of technical charts and trends: | |
 SPY Weekly Chart |
|
| Long Term Trend: Good | |
| Medium Term Trend: Not Good | |
 SPY Daily Chart |
|
| Short Term Trend: Not Good | |
| Overall Trend Score: 44 | |
| YTD Performance: 4.99% | |
| **Trend Scores & Views Are Only For Educational Purposes And Not For Investing | |
| 12Stocks.com: Investing in S&P 500 Index using Exchange Traded Funds | |
|
The following table shows list of key exchange traded funds (ETF) that
help investors track S&P 500 index. The following list also includes leveraged ETF funds that track twice or thrice the daily returns of S&P 500 indices. Short or inverse ETF funds move in the opposite direction to the index they track and are useful during market pullbacks or during bear markets. Quick View: Move mouse or cursor over ETF symbol (ticker) to view short-term technical chart and over ETF name to view long term chart. Click on ticker or stock name for detailed view. Click on to add stock symbol to your watchlist and to view watchlist. |
12Stocks.com List of ETFs that track S&P 500 Index
| Ticker | ETF Name | Watchlist | Recent Price | Smart Investing & Trading Score | Change % | Week % | Year-to-date % |
| SPY | SPDR S&P 500 ETF | | 499.05 | 44 | -1.26 | 0.78 | 4.99% |
| OEF | iShares S&P 100 | | 235.81 | 34 | -1.66 | 0.48 | 5.56% |
| SSO | ProShares Ultra S&P500 | | 70.09 | 44 | -2.59 | 1.42 | 7.71% |
| UPRO | ProShares UltraPro S&P500 | | 60.43 | 36 | -3.90 | 2.15 | 10.39% |
| SH | ProShares Short S&P500 | | 12.52 | 62 | 1.54 | -0.56 | -3.62% |
| SDS | ProShares UltraShort S&P500 | | 27.50 | 62 | 2.61 | -1.43 | -8.09% |
| SPXU | ProShares UltraPro Short S&P500 | | 37.50 | 69 | 4.05 | -2.17 | -12.79% |
| 12Stocks.com: Charts, Trends, Fundamental Data and Performances of S&P 500 Stocks | |
|
We now take in-depth look at all S&P 500 stocks including charts, multi-period performances and overall trends (as measured by Smart Investing & Trading Score). One can sort S&P 500 stocks (click link to choose) by Daily, Weekly and by Year-to-Date performances. Also, one can sort by size of the company or by market capitalization. |
| Select Your Default Chart Type: | |||||
| |||||
| Click on stock symbol or name for detailed view. Click on to add stock symbol to your watchlist and to view watchlist. Quick View: Move mouse or cursor over "Daily" to quickly view daily technical stock chart and over "Weekly" to view weekly technical stock chart. | |||||

 | NEM Newmont Corporation |
| Sector: Materials | |
| SubSector: Gold | |
| MarketCap: 33928.8 Millions | |
| Recent Price: 41.88 Smart Investing & Trading Score: 100 | |
| Day Percent Change: 8.50% Day Change: 3.28 | |
| Week Change: 7.33% Year-to-date Change: 1.2% | |
| NEM Links: Profile News Message Board | |
| Charts:- Daily , Weekly | |
| Add NEM to Watchlist: View: Get NEM Trend Analysis ➞ | |
 | DOV Dover Corporation |
| Sector: Industrials | |
| SubSector: Diversified Machinery | |
| MarketCap: 10725.6 Millions | |
| Recent Price: 178.89 Smart Investing & Trading Score: 100 | |
| Day Percent Change: 4.35% Day Change: 7.45 | |
| Week Change: 5.33% Year-to-date Change: 16.3% | |
| DOV Links: Profile News Message Board | |
| Charts:- Daily , Weekly | |
| Add DOV to Watchlist: View: Get DOV Trend Analysis ➞ | |
 | CMG Chipotle Mexican Grill, Inc. |
| Sector: Services & Goods | |
| SubSector: Restaurants | |
| MarketCap: 16849.9 Millions | |
| Recent Price: 3028.70 Smart Investing & Trading Score: 100 | |
| Day Percent Change: 3.48% Day Change: 101.94 | |
| Week Change: 5.56% Year-to-date Change: 32.4% | |
| CMG Links: Profile News Message Board | |
| Charts:- Daily , Weekly | |
| Add CMG to Watchlist: View: Get CMG Trend Analysis ➞ | |
 | MRK Merck & Co., Inc. |
| Sector: Health Care | |
| SubSector: Drug Manufacturers - Major | |
| MarketCap: 192657 Millions | |
| Recent Price: 129.22 Smart Investing & Trading Score: 100 | |
| Day Percent Change: 1.75% Day Change: 2.22 | |
| Week Change: 2.74% Year-to-date Change: 18.5% | |
| MRK Links: Profile News Message Board | |
| Charts:- Daily , Weekly | |
| Add MRK to Watchlist: View: Get MRK Trend Analysis ➞ | |
 | NOC Northrop Grumman Corporation |
| Sector: Industrials | |
| SubSector: Aerospace/Defense - Major Diversified | |
| MarketCap: 52094.9 Millions | |
| Recent Price: 478.20 Smart Investing & Trading Score: 100 | |
| Day Percent Change: 0.76% Day Change: 3.63 | |
| Week Change: 3.38% Year-to-date Change: 2.2% | |
| NOC Links: Profile News Message Board | |
| Charts:- Daily , Weekly | |
| Add NOC to Watchlist: View: Get NOC Trend Analysis ➞ | |
 | EQT EQT Corporation |
| Sector: Energy | |
| SubSector: Independent Oil & Gas | |
| MarketCap: 1886.63 Millions | |
| Recent Price: 39.62 Smart Investing & Trading Score: 100 | |
| Day Percent Change: 0.48% Day Change: 0.19 | |
| Week Change: 8.1% Year-to-date Change: 2.5% | |
| EQT Links: Profile News Message Board | |
| Charts:- Daily , Weekly | |
| Add EQT to Watchlist: View: Get EQT Trend Analysis ➞ | |
 | BSX Boston Scientific Corporation |
| Sector: Health Care | |
| SubSector: Medical Appliances & Equipment | |
| MarketCap: 41541.2 Millions | |
| Recent Price: 73.25 Smart Investing & Trading Score: 100 | |
| Day Percent Change: 0.46% Day Change: 0.34 | |
| Week Change: 8.79% Year-to-date Change: 26.7% | |
| BSX Links: Profile News Message Board | |
| Charts:- Daily , Weekly | |
| Add BSX to Watchlist: View: Get BSX Trend Analysis ➞ | |
 | KO The Coca-Cola Company |
| Sector: Consumer Staples | |
| SubSector: Beverages - Soft Drinks | |
| MarketCap: 182046 Millions | |
| Recent Price: 61.82 Smart Investing & Trading Score: 100 | |
| Day Percent Change: 0.44% Day Change: 0.27 | |
| Week Change: 2.74% Year-to-date Change: 4.9% | |
| KO Links: Profile News Message Board | |
| Charts:- Daily , Weekly | |
| Add KO to Watchlist: View: Get KO Trend Analysis ➞ | |
 | MO Altria Group, Inc. |
| Sector: Consumer Staples | |
| SubSector: Cigarettes | |
| MarketCap: 70806.3 Millions | |
| Recent Price: 43.08 Smart Investing & Trading Score: 100 | |
| Day Percent Change: 0.37% Day Change: 0.16 | |
| Week Change: 2.35% Year-to-date Change: 6.8% | |
| MO Links: Profile News Message Board | |
| Charts:- Daily , Weekly | |
| Add MO to Watchlist: View: Get MO Trend Analysis ➞ | |
 | HES Hess Corporation |
| Sector: Energy | |
| SubSector: Independent Oil & Gas | |
| MarketCap: 10465.3 Millions | |
| Recent Price: 159.49 Smart Investing & Trading Score: 100 | |
| Day Percent Change: 0.23% Day Change: 0.36 | |
| Week Change: 3.33% Year-to-date Change: 10.6% | |
| HES Links: Profile News Message Board | |
| Charts:- Daily , Weekly | |
| Add HES to Watchlist: View: Get HES Trend Analysis ➞ | |
 | CPB Campbell Soup Company |
| Sector: Consumer Staples | |
| SubSector: Processed & Packaged Goods | |
| MarketCap: 14468.8 Millions | |
| Recent Price: 45.63 Smart Investing & Trading Score: 100 | |
| Day Percent Change: 0.20% Day Change: 0.09 | |
| Week Change: 3.24% Year-to-date Change: 5.6% | |
| CPB Links: Profile News Message Board | |
| Charts:- Daily , Weekly | |
| Add CPB to Watchlist: View: Get CPB Trend Analysis ➞ | |
 | SYF Synchrony Financial |
| Sector: Financials | |
| SubSector: Credit Services | |
| MarketCap: 9297.28 Millions | |
| Recent Price: 44.20 Smart Investing & Trading Score: 100 | |
| Day Percent Change: -1.83% Day Change: -0.83 | |
| Week Change: 6.31% Year-to-date Change: 15.7% | |
| SYF Links: Profile News Message Board | |
| Charts:- Daily , Weekly | |
| Add SYF to Watchlist: View: Get SYF Trend Analysis ➞ | |
 | CFG Citizens Financial Group, Inc. |
| Sector: Financials | |
| SubSector: Regional - Mid-Atlantic Banks | |
| MarketCap: 8225.19 Millions | |
| Recent Price: 34.89 Smart Investing & Trading Score: 100 | |
| Day Percent Change: -1.77% Day Change: -0.63 | |
| Week Change: 2.65% Year-to-date Change: 5.3% | |
| CFG Links: Profile News Message Board | |
| Charts:- Daily , Weekly | |
| Add CFG to Watchlist: View: Get CFG Trend Analysis ➞ | |
 | DGX Quest Diagnostics Incorporated |
| Sector: Health Care | |
| SubSector: Medical Laboratories & Research | |
| MarketCap: 11076.1 Millions | |
| Recent Price: 135.16 Smart Investing & Trading Score: 100 | |
| Day Percent Change: -1.74% Day Change: -2.39 | |
| Week Change: 5.23% Year-to-date Change: -2.0% | |
| DGX Links: Profile News Message Board | |
| Charts:- Daily , Weekly | |
| Add DGX to Watchlist: View: Get DGX Trend Analysis ➞ | |
 | FRT Federal Realty Investment Trust |
| Sector: Financials | |
| SubSector: REIT - Retail | |
| MarketCap: 5878.64 Millions | |
| Recent Price: 102.22 Smart Investing & Trading Score: 100 | |
| Day Percent Change: -1.34% Day Change: -1.38 | |
| Week Change: 2.45% Year-to-date Change: -0.8% | |
| FRT Links: Profile News Message Board | |
| Charts:- Daily , Weekly | |
| Add FRT to Watchlist: View: Get FRT Trend Analysis ➞ | |
 | KHC The Kraft Heinz Company |
| Sector: Consumer Staples | |
| SubSector: Food - Major Diversified | |
| MarketCap: 32096.3 Millions | |
| Recent Price: 38.17 Smart Investing & Trading Score: 100 | |
| Day Percent Change: -1.04% Day Change: -0.40 | |
| Week Change: 1.03% Year-to-date Change: 3.2% | |
| KHC Links: Profile News Message Board | |
| Charts:- Daily , Weekly | |
| Add KHC to Watchlist: View: Get KHC Trend Analysis ➞ | |
 | ES Eversource Energy |
| Sector: Utilities | |
| SubSector: Diversified Utilities | |
| MarketCap: 23963.4 Millions | |
| Recent Price: 60.24 Smart Investing & Trading Score: 100 | |
| Day Percent Change: -0.99% Day Change: -0.60 | |
| Week Change: 0.92% Year-to-date Change: -2.4% | |
| ES Links: Profile News Message Board | |
| Charts:- Daily , Weekly | |
| Add ES to Watchlist: View: Get ES Trend Analysis ➞ | |
 | AVB AvalonBay Communities, Inc. |
| Sector: Financials | |
| SubSector: REIT - Residential | |
| MarketCap: 19921.9 Millions | |
| Recent Price: 189.54 Smart Investing & Trading Score: 100 | |
| Day Percent Change: -0.94% Day Change: -1.81 | |
| Week Change: 2.94% Year-to-date Change: 1.2% | |
| AVB Links: Profile News Message Board | |
| Charts:- Daily , Weekly | |
| Add AVB to Watchlist: View: Get AVB Trend Analysis ➞ | |
 | ESS Essex Property Trust, Inc. |
| Sector: Financials | |
| SubSector: REIT - Residential | |
| MarketCap: 13725.5 Millions | |
| Recent Price: 245.51 Smart Investing & Trading Score: 100 | |
| Day Percent Change: -0.90% Day Change: -2.23 | |
| Week Change: 4.4% Year-to-date Change: -1.0% | |
| ESS Links: Profile News Message Board | |
| Charts:- Daily , Weekly | |
| Add ESS to Watchlist: View: Get ESS Trend Analysis ➞ | |
 | TXN Texas Instruments Incorporated |
| Sector: Technology | |
| SubSector: Semiconductor - Broad Line | |
| MarketCap: 99509.1 Millions | |
| Recent Price: 173.41 Smart Investing & Trading Score: 100 | |
| Day Percent Change: -0.80% Day Change: -1.40 | |
| Week Change: 8.6% Year-to-date Change: 1.7% | |
| TXN Links: Profile News Message Board | |
| Charts:- Daily , Weekly | |
| Add TXN to Watchlist: View: Get TXN Trend Analysis ➞ | |
 | TMUS T-Mobile US, Inc. |
| Sector: Technology | |
| SubSector: Wireless Communications | |
| MarketCap: 71949 Millions | |
| Recent Price: 162.89 Smart Investing & Trading Score: 100 | |
| Day Percent Change: -0.79% Day Change: -1.29 | |
| Week Change: 0.34% Year-to-date Change: 1.6% | |
| TMUS Links: Profile News Message Board | |
| Charts:- Daily , Weekly | |
| Add TMUS to Watchlist: View: Get TMUS Trend Analysis ➞ | |
 | YUM Yum! Brands, Inc. |
| Sector: Services & Goods | |
| SubSector: Restaurants | |
| MarketCap: 18033.3 Millions | |
| Recent Price: 140.72 Smart Investing & Trading Score: 100 | |
| Day Percent Change: -0.77% Day Change: -1.09 | |
| Week Change: 1.6% Year-to-date Change: 7.7% | |
| YUM Links: Profile News Message Board | |
| Charts:- Daily , Weekly | |
| Add YUM to Watchlist: View: Get YUM Trend Analysis ➞ | |
 | KMB Kimberly-Clark Corporation |
| Sector: Consumer Staples | |
| SubSector: Personal Products | |
| MarketCap: 44300.5 Millions | |
| Recent Price: 136.96 Smart Investing & Trading Score: 100 | |
| Day Percent Change: -0.60% Day Change: -0.82 | |
| Week Change: 7.99% Year-to-date Change: 12.7% | |
| KMB Links: Profile News Message Board | |
| Charts:- Daily , Weekly | |
| Add KMB to Watchlist: View: Get KMB Trend Analysis ➞ | |
 | LNT Alliant Energy Corporation |
| Sector: Utilities | |
| SubSector: Electric Utilities | |
| MarketCap: 10678.4 Millions | |
| Recent Price: 50.07 Smart Investing & Trading Score: 100 | |
| Day Percent Change: -0.60% Day Change: -0.30 | |
| Week Change: 0.5% Year-to-date Change: -2.4% | |
| LNT Links: Profile News Message Board | |
| Charts:- Daily , Weekly | |
| Add LNT to Watchlist: View: Get LNT Trend Analysis ➞ | |
 | AEP American Electric Power Company, Inc. |
| Sector: Utilities | |
| SubSector: Electric Utilities | |
| MarketCap: 38380 Millions | |
| Recent Price: 85.92 Smart Investing & Trading Score: 100 | |
| Day Percent Change: -0.52% Day Change: -0.45 | |
| Week Change: 2.05% Year-to-date Change: 5.8% | |
| AEP Links: Profile News Message Board | |
| Charts:- Daily , Weekly | |
| Add AEP to Watchlist: View: Get AEP Trend Analysis ➞ | |
| For tabular summary view of above stock list: Summary View ➞ 0 - 25 , 25 - 50 , 50 - 75 , 75 - 100 , 100 - 125 , 125 - 150 , 150 - 175 , 175 - 200 , 200 - 225 , 225 - 250 , 250 - 275 , 275 - 300 , 300 - 325 , 325 - 350 , 350 - 375 , 375 - 400 , 400 - 425 , 425 - 450 , 450 - 475 , 475 - 500 | ||
| Click To Change The Sort Order: By Market Cap or Company Size Performance: Year-to-date, Week and Day | |
| Select Chart Type: | ||
|
Best Stocks Today 12Stocks.com |
© 2024 12Stocks.com Terms & Conditions Privacy Contact Us
All Information Provided Only For Education And Not To Be Used For Investing or Trading. See Terms & Conditions


One More Thing ... Get Best Stocks Delivered Daily!
Never Ever Miss A Move With Our Top Ten Stocks Lists
Find Best Stocks In Any Market - Bull or Bear Market
Take A Peek At Our Top Ten Stocks Lists: Daily, Weekly, Year-to-Date & Top Trends
Find Best Stocks In Any Market - Bull or Bear Market
Take A Peek At Our Top Ten Stocks Lists: Daily, Weekly, Year-to-Date & Top Trends
S&P 500 Stocks With Best Up Trends [0-bearish to 100-bullish]: Newmont [100], Dover [100], Chipotle Mexican[100], Merck [100], Northrop Grumman[100], EQT [100], Boston Scientific[100], Coca-Cola [100], Altria [100], Hess [100], Campbell Soup[100]
Best S&P 500 Stocks Year-to-Date:
NVIDIA [65.24%], Constellation [60.24%], NRG [39.81%], Targa Resources[34.22%], Marathon [33.86%], Chipotle Mexican[32.43%], Diamondback [32.2%], Progressive [31.71%], Eaton [30.97%], Western Digital[30.89%], Micron [30.34%] Best S&P 500 Stocks This Week:
Hasbro [17.46%], Globe Life[14.66%], Tesla [13.26%], Wabtec [12.29%], Teradyne [12.18%], Microchip [10.53%], Tyler Technologies[10.37%], Monolithic Power[10.19%], NXP Semiconductors[9.67%], ON Semiconductor[8.85%], Boston Scientific[8.79%] Best S&P 500 Stocks Daily:
Newmont [8.50%], Carrier Global[7.19%], Teradyne [6.91%], Tyler Technologies[6.24%], Dover [4.35%], ProShares UltraPro[4.05%], Keurig Dr[3.77%], United Rentals[3.69%], Union Pacific[3.50%], Chipotle Mexican[3.48%], Rollins [3.34%]