
 Login Sign Up


| |||||
 |  | ||||

| 12Stocks.com Market Intelligence |
Best S&P 500 Stocks
|
On this page, you will find the most comprehensive analysis of S&P 500 stocks and ETFs - from latest trends to performances to charts ➞. First, here are the year-to-date (YTD) performances of the most requested S&P 500 stocks at 12Stocks.com (click stock for review):
| NVIDIA 61% | ||
| Caterpillar 23% | ||
| Merck 16% | ||
| Amazon.com 16% | ||
| Walmart 14% | ||
| Google 14% | ||
| JPMorgan Chase 14% | ||
| Chevron 10% | ||
| Goldman Sachs 10% | ||
| Microsoft 9% | ||
| Johnson & Johnson -5% | ||
| McDonald s -7% | ||
| Starbucks -8% | ||
| Apple -12% | ||
| Gilead -17% | ||
| Intel -31% | ||
| Boeing -37% | ||
| Quick: S&P 500 Stocks Lists: Performances & Trends, S&P 500 Stock Charts
Sort S&P 500 stocks: Daily, Weekly, Year-to-Date, Market Cap & Trends. Filter S&P 500 stocks list by sector: Show all, Tech, Finance, Energy, Staples, Retail, Industrial, Materials, Utilities and HealthCare |
| 12Stocks.com S&P 500 Stocks Performances & Trends Daily Report | |||||||||
|
| 
The overall Smart Investing & Trading Score is 58 (0-bearish to 100-bullish) which puts S&P 500 index in short term neutral trend. The Smart Investing & Trading Score from previous trading session is 51 and an improvement of trend continues. | ||||||||
Here are the Smart Investing & Trading Scores of the most requested S&P 500 stocks at 12Stocks.com (click stock name for detailed review):
|


| 12Stocks.com: Top Performing S&P 500 Index Stocks | ||||||||||||||||||||||||||||||||||||||||||||||||
 The top performing S&P 500 Index stocks year to date are
Now, more recently, over last week, the top performing S&P 500 Index stocks on the move are


|
||||||||||||||||||||||||||||||||||||||||||||||||
| 12Stocks.com: Investing in S&P 500 Index with Stocks | |
|
The following table helps investors and traders sort through current performance and trends (as measured by Smart Investing & Trading Score) of various
stocks in the S&P 500 Index. Quick View: Move mouse or cursor over stock symbol (ticker) to view short-term technical chart and over stock name to view long term chart. Click on  to add stock symbol to your watchlist and to add stock symbol to your watchlist and  to view watchlist. Click on any ticker or stock name for detailed market intelligence report for that stock. to view watchlist. Click on any ticker or stock name for detailed market intelligence report for that stock. |
12Stocks.com Performance of Stocks in S&P 500 Index
| Ticker | Stock Name | Watchlist | Category | Recent Price | Smart Investing & Trading Score | Change % | YTD Change% |
| ORCL | Oracle |   | Technology | 115.34 | 44 | 0.22 | 9.40% |
| GEHC | GE HealthCare | | Health Care | 86.44 | 68 | 0.22 | 11.77% |
| HST | Host Hotels | | Financials | 19.33 | 45 | 0.21 | -0.72% |
| GRMN | Garmin | | Technology | 142.79 | 63 | 0.20 | 11.09% |
| XRAY | DENTSPLY SIRONA | | Health Care | 30.92 | 32 | 0.19 | -13.12% |
| ICE | Intercontinental Exchange | | Financials | 132.57 | 58 | 0.18 | 3.22% |
| DIS | Walt Disney | | Services & Goods | 113.92 | 68 | 0.18 | 26.17% |
| IT | Gartner | | Technology | 451.06 | 32 | 0.18 | -0.01% |
| COST | Costco Wholesale | | Services & Goods | 723.89 | 80 | 0.17 | 9.67% |
| INCY | Incyte | | Health Care | 51.74 | 10 | 0.17 | -17.60% |
| LDOS | Leidos Holdings | | Technology | 128.90 | 78 | 0.17 | 19.09% |
| CAH | Cardinal Health | | Services & Goods | 103.54 | 17 | 0.16 | 2.72% |
| NTRS | Northern Trust | | Financials | 84.30 | 68 | 0.14 | -0.09% |
| SPXU | ProShares UltraPro | | Utilities | 36.04 | 42 | 0.14 | -16.19% |
| HUBB | Hubbell | | Technology | 398.55 | 63 | 0.14 | 21.17% |
| ARE | Alexandria Real | | Financials | 119.65 | 35 | 0.13 | -5.62% |
| TYL | Tyler Technologies | | Technology | 419.00 | 57 | 0.13 | 0.21% |
| MO | Altria | | Consumer Staples | 42.92 | 93 | 0.12 | 6.40% |
| L | Loews | | Financials | 76.81 | 71 | 0.12 | 10.38% |
| VTR | Ventas | | Financials | 43.61 | 67 | 0.11 | -12.50% |
| PXD | Pioneer Natural | | Energy | 275.52 | 88 | 0.11 | 22.52% |
| XEL | Xcel | | Utilities | 55.33 | 74 | 0.11 | -10.63% |
| PANW | Palo Alto | | Technology | 293.82 | 64 | 0.11 | -0.36% |
| MS | Morgan Stanley | | Financials | 93.85 | 100 | 0.10 | 0.64% |
| MRK | Merck | | Health Care | 127.00 | 76 | 0.09 | 16.49% |
| For chart view version of above stock list: Chart View ➞ 0 - 25 , 25 - 50 , 50 - 75 , 75 - 100 , 100 - 125 , 125 - 150 , 150 - 175 , 175 - 200 , 200 - 225 , 225 - 250 , 250 - 275 , 275 - 300 , 300 - 325 , 325 - 350 , 350 - 375 , 375 - 400 , 400 - 425 , 425 - 450 , 450 - 475 , 475 - 500 | ||
 | Click To Change The Sort Order: By Market Cap or Company Size Performance: Year-to-date, Week and Day |  |
|
Get the most comprehensive stock market coverage daily at 12Stocks.com ➞ Best Stocks Today ➞ Best Stocks Weekly ➞ Best Stocks Year-to-Date ➞ Best Stocks Trends ➞  Best Stocks Today 12Stocks.com Best Nasdaq Stocks ➞ Best S&P 500 Stocks ➞ Best Tech Stocks ➞ Best Biotech Stocks ➞ |
| Detailed Overview of S&P 500 Stocks |
| S&P 500 Technical Overview, Leaders & Laggards, Top S&P 500 ETF Funds & Detailed S&P 500 Stocks List, Charts, Trends & More |
| S&P 500: Technical Analysis, Trends & YTD Performance | |
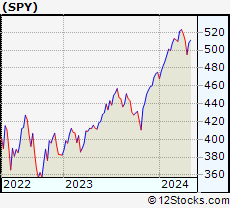
| S&P 500 index as represented by
SPY, an exchange-traded fund [ETF], holds basket of five hundred (mostly largecap) stocks from across all major sectors of the US stock market. The S&P 500 index (contains stocks like Apple and Exxon) is up by 6.33% and is currently outperforming the overall market by 0.67% year-to-date. Below is a quick view of technical charts and trends: | |
 SPY Weekly Chart |
|
| Long Term Trend: Good | |
| Medium Term Trend: Not Good | |
 SPY Daily Chart |
|
| Short Term Trend: Very Good | |
| Overall Trend Score: 58 | |
| YTD Performance: 6.33% | |
| **Trend Scores & Views Are Only For Educational Purposes And Not For Investing | |
| 12Stocks.com: Investing in S&P 500 Index using Exchange Traded Funds | |
|
The following table shows list of key exchange traded funds (ETF) that
help investors track S&P 500 index. The following list also includes leveraged ETF funds that track twice or thrice the daily returns of S&P 500 indices. Short or inverse ETF funds move in the opposite direction to the index they track and are useful during market pullbacks or during bear markets. Quick View: Move mouse or cursor over ETF symbol (ticker) to view short-term technical chart and over ETF name to view long term chart. Click on ticker or stock name for detailed view. Click on to add stock symbol to your watchlist and to view watchlist. |
12Stocks.com List of ETFs that track S&P 500 Index
| Ticker | ETF Name | Watchlist | Recent Price | Smart Investing & Trading Score | Change % | Week % | Year-to-date % |
| SPY | SPDR S&P 500 ETF | | 505.41 | 58 | -0.05 | 2.07 | 6.33% |
| IVV | iShares Core S&P 500 ETF | | 507.97 | 63 | -0.04 | 2.1 | 6.35% |
| VOO | Vanguard 500 ETF | | 464.50 | 63 | -0.07 | 2.07 | 6.34% |
| OEF | iShares S&P 100 | | 239.79 | 58 | -0.07 | 2.18 | 7.34% |
| SSO | ProShares Ultra S&P500 | | 71.95 | 58 | -0.12 | 4.11 | 10.57% |
| UPRO | ProShares UltraPro S&P500 | | 62.88 | 58 | -0.08 | 6.29 | 14.87% |
| SPXL | Direxion Daily S&P500 Bull 3X ETF | | 119.35 | 63 | -0.13 | 6.04 | 14.77% |
| SH | ProShares Short S&P500 | | 12.33 | 42 | -0.08 | -2.07 | -5.08% |
| SDS | ProShares UltraShort S&P500 | | 26.80 | 42 | 0.07 | -3.94 | -10.43% |
| SPXU | ProShares UltraPro Short S&P500 | | 36.04 | 42 | 0.14 | -5.97 | -16.19% |
| SPXS | Direxion Daily S&P 500 Bear 3X ETF | | 9.75 | 32 | 0.00 | -5.89 | -15.58% |
| 12Stocks.com: Charts, Trends, Fundamental Data and Performances of S&P 500 Stocks | |
|
We now take in-depth look at all S&P 500 stocks including charts, multi-period performances and overall trends (as measured by Smart Investing & Trading Score). One can sort S&P 500 stocks (click link to choose) by Daily, Weekly and by Year-to-Date performances. Also, one can sort by size of the company or by market capitalization. |
| Select Your Default Chart Type: | |||||
| |||||
| Click on stock symbol or name for detailed view. Click on to add stock symbol to your watchlist and to view watchlist. Quick View: Move mouse or cursor over "Daily" to quickly view daily technical stock chart and over "Weekly" to view weekly technical stock chart. | |||||

 | ORCL Oracle Corporation |
| Sector: Technology | |
| SubSector: Application Software | |
| MarketCap: 164530 Millions | |
| Recent Price: 115.34 Smart Investing & Trading Score: 44 | |
| Day Percent Change: 0.22% Day Change: 0.25 | |
| Week Change: 0.4% Year-to-date Change: 9.4% | |
| ORCL Links: Profile News Message Board | |
| Charts:- Daily , Weekly | |
| Add ORCL to Watchlist: View: Get ORCL Trend Analysis ➞ | |
 | GEHC GE HealthCare Technologies Inc. |
| Sector: Health Care | |
| SubSector: Health Information Services | |
| MarketCap: 36240 Millions | |
| Recent Price: 86.44 Smart Investing & Trading Score: 68 | |
| Day Percent Change: 0.22% Day Change: 0.19 | |
| Week Change: 2.31% Year-to-date Change: 11.8% | |
| GEHC Links: Profile News Message Board | |
| Charts:- Daily , Weekly | |
| Add GEHC to Watchlist: View: Get GEHC Trend Analysis ➞ | |
 | HST Host Hotels & Resorts, Inc. |
| Sector: Financials | |
| SubSector: REIT - Hotel/Motel | |
| MarketCap: 8253.74 Millions | |
| Recent Price: 19.33 Smart Investing & Trading Score: 45 | |
| Day Percent Change: 0.21% Day Change: 0.04 | |
| Week Change: 3.31% Year-to-date Change: -0.7% | |
| HST Links: Profile News Message Board | |
| Charts:- Daily , Weekly | |
| Add HST to Watchlist: View: Get HST Trend Analysis ➞ | |
 | GRMN Garmin Ltd. |
| Sector: Technology | |
| SubSector: Scientific & Technical Instruments | |
| MarketCap: 13909.3 Millions | |
| Recent Price: 142.79 Smart Investing & Trading Score: 63 | |
| Day Percent Change: 0.20% Day Change: 0.28 | |
| Week Change: 2.34% Year-to-date Change: 11.1% | |
| GRMN Links: Profile News Message Board | |
| Charts:- Daily , Weekly | |
| Add GRMN to Watchlist: View: Get GRMN Trend Analysis ➞ | |
 | XRAY DENTSPLY SIRONA Inc. |
| Sector: Health Care | |
| SubSector: Medical Instruments & Supplies | |
| MarketCap: 7746.1 Millions | |
| Recent Price: 30.92 Smart Investing & Trading Score: 32 | |
| Day Percent Change: 0.19% Day Change: 0.06 | |
| Week Change: 1.38% Year-to-date Change: -13.1% | |
| XRAY Links: Profile News Message Board | |
| Charts:- Daily , Weekly | |
| Add XRAY to Watchlist: View: Get XRAY Trend Analysis ➞ | |
 | ICE Intercontinental Exchange, Inc. |
| Sector: Financials | |
| SubSector: Diversified Investments | |
| MarketCap: 46054.6 Millions | |
| Recent Price: 132.57 Smart Investing & Trading Score: 58 | |
| Day Percent Change: 0.18% Day Change: 0.24 | |
| Week Change: 1.04% Year-to-date Change: 3.2% | |
| ICE Links: Profile News Message Board | |
| Charts:- Daily , Weekly | |
| Add ICE to Watchlist: View: Get ICE Trend Analysis ➞ | |
 | DIS The Walt Disney Company |
| Sector: Services & Goods | |
| SubSector: Entertainment - Diversified | |
| MarketCap: 178396 Millions | |
| Recent Price: 113.92 Smart Investing & Trading Score: 68 | |
| Day Percent Change: 0.18% Day Change: 0.21 | |
| Week Change: 1.16% Year-to-date Change: 26.2% | |
| DIS Links: Profile News Message Board | |
| Charts:- Daily , Weekly | |
| Add DIS to Watchlist: View: Get DIS Trend Analysis ➞ | |
 | IT Gartner, Inc. |
| Sector: Technology | |
| SubSector: Information Technology Services | |
| MarketCap: 7767.98 Millions | |
| Recent Price: 451.06 Smart Investing & Trading Score: 32 | |
| Day Percent Change: 0.18% Day Change: 0.80 | |
| Week Change: 2.43% Year-to-date Change: 0.0% | |
| IT Links: Profile News Message Board | |
| Charts:- Daily , Weekly | |
| Add IT to Watchlist: View: Get IT Trend Analysis ➞ | |
 | COST Costco Wholesale Corporation |
| Sector: Services & Goods | |
| SubSector: Discount, Variety Stores | |
| MarketCap: 136355 Millions | |
| Recent Price: 723.89 Smart Investing & Trading Score: 80 | |
| Day Percent Change: 0.17% Day Change: 1.21 | |
| Week Change: 2.03% Year-to-date Change: 9.7% | |
| COST Links: Profile News Message Board | |
| Charts:- Daily , Weekly | |
| Add COST to Watchlist: View: Get COST Trend Analysis ➞ | |
 | INCY Incyte Corporation |
| Sector: Health Care | |
| SubSector: Biotechnology | |
| MarketCap: 15343.2 Millions | |
| Recent Price: 51.74 Smart Investing & Trading Score: 10 | |
| Day Percent Change: 0.17% Day Change: 0.09 | |
| Week Change: -1.17% Year-to-date Change: -17.6% | |
| INCY Links: Profile News Message Board | |
| Charts:- Daily , Weekly | |
| Add INCY to Watchlist: View: Get INCY Trend Analysis ➞ | |
 | LDOS Leidos Holdings, Inc. |
| Sector: Technology | |
| SubSector: Information Technology Services | |
| MarketCap: 11707.5 Millions | |
| Recent Price: 128.90 Smart Investing & Trading Score: 78 | |
| Day Percent Change: 0.17% Day Change: 0.22 | |
| Week Change: 3.19% Year-to-date Change: 19.1% | |
| LDOS Links: Profile News Message Board | |
| Charts:- Daily , Weekly | |
| Add LDOS to Watchlist: View: Get LDOS Trend Analysis ➞ | |
 | CAH Cardinal Health, Inc. |
| Sector: Services & Goods | |
| SubSector: Drugs Wholesale | |
| MarketCap: 14509.9 Millions | |
| Recent Price: 103.54 Smart Investing & Trading Score: 17 | |
| Day Percent Change: 0.16% Day Change: 0.17 | |
| Week Change: -4.3% Year-to-date Change: 2.7% | |
| CAH Links: Profile News Message Board | |
| Charts:- Daily , Weekly | |
| Add CAH to Watchlist: View: Get CAH Trend Analysis ➞ | |
 | NTRS Northern Trust Corporation |
| Sector: Financials | |
| SubSector: Asset Management | |
| MarketCap: 15316.8 Millions | |
| Recent Price: 84.30 Smart Investing & Trading Score: 68 | |
| Day Percent Change: 0.14% Day Change: 0.12 | |
| Week Change: 3.5% Year-to-date Change: -0.1% | |
| NTRS Links: Profile News Message Board | |
| Charts:- Daily , Weekly | |
| Add NTRS to Watchlist: View: Get NTRS Trend Analysis ➞ | |
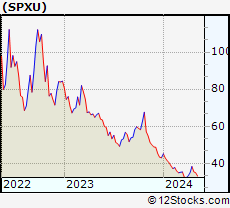 | SPXU ProShares UltraPro Short S&P500 |
| Sector: Utilities | |
| SubSector: Exchange Traded Fund | |
| MarketCap: 0 Millions | |
| Recent Price: 36.04 Smart Investing & Trading Score: 42 | |
| Day Percent Change: 0.14% Day Change: 0.05 | |
| Week Change: -5.97% Year-to-date Change: -16.2% | |
| SPXU Links: Profile News Message Board | |
| Charts:- Daily , Weekly | |
| Add SPXU to Watchlist: View: Get SPXU Trend Analysis ➞ | |
 | HUBB Hubbell Incorporated |
| Sector: Technology | |
| SubSector: Diversified Electronics | |
| MarketCap: 6002.46 Millions | |
| Recent Price: 398.55 Smart Investing & Trading Score: 63 | |
| Day Percent Change: 0.14% Day Change: 0.55 | |
| Week Change: 2.71% Year-to-date Change: 21.2% | |
| HUBB Links: Profile News Message Board | |
| Charts:- Daily , Weekly | |
| Add HUBB to Watchlist: View: Get HUBB Trend Analysis ➞ | |
 | ARE Alexandria Real Estate Equities, Inc. |
| Sector: Financials | |
| SubSector: REIT - Office | |
| MarketCap: 16793.6 Millions | |
| Recent Price: 119.65 Smart Investing & Trading Score: 35 | |
| Day Percent Change: 0.13% Day Change: 0.16 | |
| Week Change: 3.42% Year-to-date Change: -5.6% | |
| ARE Links: Profile News Message Board | |
| Charts:- Daily , Weekly | |
| Add ARE to Watchlist: View: Get ARE Trend Analysis ➞ | |
 | TYL Tyler Technologies, Inc. |
| Sector: Technology | |
| SubSector: Technical & System Software | |
| MarketCap: 10785 Millions | |
| Recent Price: 419.00 Smart Investing & Trading Score: 57 | |
| Day Percent Change: 0.13% Day Change: 0.56 | |
| Week Change: 3.88% Year-to-date Change: 0.2% | |
| TYL Links: Profile News Message Board | |
| Charts:- Daily , Weekly | |
| Add TYL to Watchlist: View: Get TYL Trend Analysis ➞ | |
 | MO Altria Group, Inc. |
| Sector: Consumer Staples | |
| SubSector: Cigarettes | |
| MarketCap: 70806.3 Millions | |
| Recent Price: 42.92 Smart Investing & Trading Score: 93 | |
| Day Percent Change: 0.12% Day Change: 0.05 | |
| Week Change: 1.97% Year-to-date Change: 6.4% | |
| MO Links: Profile News Message Board | |
| Charts:- Daily , Weekly | |
| Add MO to Watchlist: View: Get MO Trend Analysis ➞ | |
 | L Loews Corporation |
| Sector: Financials | |
| SubSector: Property & Casualty Insurance | |
| MarketCap: 10768.2 Millions | |
| Recent Price: 76.81 Smart Investing & Trading Score: 71 | |
| Day Percent Change: 0.12% Day Change: 0.09 | |
| Week Change: 1.55% Year-to-date Change: 10.4% | |
| L Links: Profile News Message Board | |
| Charts:- Daily , Weekly | |
| Add L to Watchlist: View: Get L Trend Analysis ➞ | |
 | VTR Ventas, Inc. |
| Sector: Financials | |
| SubSector: REIT - Healthcare Facilities | |
| MarketCap: 11180.4 Millions | |
| Recent Price: 43.61 Smart Investing & Trading Score: 67 | |
| Day Percent Change: 0.11% Day Change: 0.05 | |
| Week Change: 1.11% Year-to-date Change: -12.5% | |
| VTR Links: Profile News Message Board | |
| Charts:- Daily , Weekly | |
| Add VTR to Watchlist: View: Get VTR Trend Analysis ➞ | |
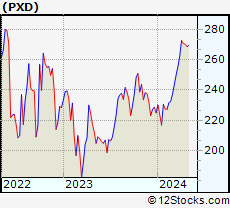 | PXD Pioneer Natural Resources Company |
| Sector: Energy | |
| SubSector: Independent Oil & Gas | |
| MarketCap: 11846.2 Millions | |
| Recent Price: 275.52 Smart Investing & Trading Score: 88 | |
| Day Percent Change: 0.11% Day Change: 0.29 | |
| Week Change: 1.93% Year-to-date Change: 22.5% | |
| PXD Links: Profile News Message Board | |
| Charts:- Daily , Weekly | |
| Add PXD to Watchlist: View: Get PXD Trend Analysis ➞ | |
 | XEL Xcel Energy Inc. |
| Sector: Utilities | |
| SubSector: Electric Utilities | |
| MarketCap: 28960.8 Millions | |
| Recent Price: 55.33 Smart Investing & Trading Score: 74 | |
| Day Percent Change: 0.11% Day Change: 0.06 | |
| Week Change: 1.11% Year-to-date Change: -10.6% | |
| XEL Links: Profile News Message Board | |
| Charts:- Daily , Weekly | |
| Add XEL to Watchlist: View: Get XEL Trend Analysis ➞ | |
 | PANW Palo Alto Networks, Inc. |
| Sector: Technology | |
| SubSector: Networking & Communication Devices | |
| MarketCap: 16039.4 Millions | |
| Recent Price: 293.82 Smart Investing & Trading Score: 64 | |
| Day Percent Change: 0.11% Day Change: 0.33 | |
| Week Change: 5.8% Year-to-date Change: -0.4% | |
| PANW Links: Profile News Message Board | |
| Charts:- Daily , Weekly | |
| Add PANW to Watchlist: View: Get PANW Trend Analysis ➞ | |
 | MS Morgan Stanley |
| Sector: Financials | |
| SubSector: Investment Brokerage - National | |
| MarketCap: 55876.7 Millions | |
| Recent Price: 93.85 Smart Investing & Trading Score: 100 | |
| Day Percent Change: 0.10% Day Change: 0.09 | |
| Week Change: 3.52% Year-to-date Change: 0.6% | |
| MS Links: Profile News Message Board | |
| Charts:- Daily , Weekly | |
| Add MS to Watchlist: View: Get MS Trend Analysis ➞ | |
 | MRK Merck & Co., Inc. |
| Sector: Health Care | |
| SubSector: Drug Manufacturers - Major | |
| MarketCap: 192657 Millions | |
| Recent Price: 127.00 Smart Investing & Trading Score: 76 | |
| Day Percent Change: 0.09% Day Change: 0.12 | |
| Week Change: 0.97% Year-to-date Change: 16.5% | |
| MRK Links: Profile News Message Board | |
| Charts:- Daily , Weekly | |
| Add MRK to Watchlist: View: Get MRK Trend Analysis ➞ | |
| For tabular summary view of above stock list: Summary View ➞ 0 - 25 , 25 - 50 , 50 - 75 , 75 - 100 , 100 - 125 , 125 - 150 , 150 - 175 , 175 - 200 , 200 - 225 , 225 - 250 , 250 - 275 , 275 - 300 , 300 - 325 , 325 - 350 , 350 - 375 , 375 - 400 , 400 - 425 , 425 - 450 , 450 - 475 , 475 - 500 | ||
| Click To Change The Sort Order: By Market Cap or Company Size Performance: Year-to-date, Week and Day | |
| Select Chart Type: | ||
|
Best Stocks Today 12Stocks.com |
© 2024 12Stocks.com Terms & Conditions Privacy Contact Us
All Information Provided Only For Education And Not To Be Used For Investing or Trading. See Terms & Conditions


One More Thing ... Get Best Stocks Delivered Daily!
Never Ever Miss A Move With Our Top Ten Stocks Lists
Find Best Stocks In Any Market - Bull or Bear Market
Take A Peek At Our Top Ten Stocks Lists: Daily, Weekly, Year-to-Date & Top Trends
Find Best Stocks In Any Market - Bull or Bear Market
Take A Peek At Our Top Ten Stocks Lists: Daily, Weekly, Year-to-Date & Top Trends
S&P 500 Stocks With Best Up Trends [0-bearish to 100-bullish]: Hasbro [100], Wabtec [100], Boston Scientific[100], Texas Instruments[100], Microchip [100], Synchrony Financial[100], EQT [100], PepsiCo [100], Analog Devices[100], Equity Residential[100], Essex Property[100]
Best S&P 500 Stocks Year-to-Date:
NVIDIA [60.89%], Constellation [59.4%], NRG [40.44%], Meta Platforms[39.4%], Targa Resources[34.57%], Marathon [34.23%], Progressive [33.22%], Western Digital[32.81%], Eaton [32.38%], Diamondback [32.34%], Micron [30.98%] Best S&P 500 Stocks This Week:
Globe Life[17.77%], Hasbro [17.66%], Wabtec [13.32%], Microchip [11.02%], Tesla [10.26%], Texas Instruments[9.48%], NXP Semiconductors[9.26%], CoStar [9.13%], Kimberly-Clark [8.63%], Monolithic Power[8.57%], Synchrony Financial[8.3%] Best S&P 500 Stocks Daily:
Tesla [12.06%], Hasbro [11.85%], Wabtec [10.04%], CoStar [8.66%], ON Semiconductor[6.24%], Boston Scientific[5.68%], Texas Instruments[5.64%], Microchip [5.21%], Monolithic Power[5.04%], Synchrony Financial[5.04%], Biogen [4.56%]