
 Login Sign Up


| |||||
 |  | ||||

| 12Stocks.com Market Intelligence |
Best S&P 500 Stocks
|
On this page, you will find the most comprehensive analysis of S&P 500 stocks and ETFs - from latest trends to performances to charts ➞. First, here are the year-to-date (YTD) performances of the most requested S&P 500 stocks at 12Stocks.com (click stock for review):
| NVIDIA 67% | ||
| Merck 19% | ||
| Caterpillar 15% | ||
| Walmart 14% | ||
| Amazon.com 13% | ||
| JPMorgan Chase 13% | ||
| Google 11% | ||
| Chevron 10% | ||
| Goldman Sachs 8% | ||
| Microsoft 5% | ||
| Johnson & Johnson -6% | ||
| McDonald s -7% | ||
| Starbucks -9% | ||
| Apple -12% | ||
| Gilead -19% | ||
| Intel -30% | ||
| Boeing -36% | ||
| Quick: S&P 500 Stocks Lists: Performances & Trends, S&P 500 Stock Charts
Sort S&P 500 stocks: Daily, Weekly, Year-to-Date, Market Cap & Trends. Filter S&P 500 stocks list by sector: Show all, Tech, Finance, Energy, Staples, Retail, Industrial, Materials, Utilities and HealthCare |
| 12Stocks.com S&P 500 Stocks Performances & Trends Daily Report | |||||||||
|
| 
The overall Smart Investing & Trading Score is 44 (0-bearish to 100-bullish) which puts S&P 500 index in short term neutral trend. The Smart Investing & Trading Score from previous trading session is 58 and hence a deterioration of trend. | ||||||||
Here are the Smart Investing & Trading Scores of the most requested S&P 500 stocks at 12Stocks.com (click stock name for detailed review):
|


| 12Stocks.com: Top Performing S&P 500 Index Stocks | ||||||||||||||||||||||||||||||||||||||||||||||||
 The top performing S&P 500 Index stocks year to date are
Now, more recently, over last week, the top performing S&P 500 Index stocks on the move are


|
||||||||||||||||||||||||||||||||||||||||||||||||
| 12Stocks.com: Investing in S&P 500 Index with Stocks | |
|
The following table helps investors and traders sort through current performance and trends (as measured by Smart Investing & Trading Score) of various
stocks in the S&P 500 Index. Quick View: Move mouse or cursor over stock symbol (ticker) to view short-term technical chart and over stock name to view long term chart. Click on  to add stock symbol to your watchlist and to add stock symbol to your watchlist and  to view watchlist. Click on any ticker or stock name for detailed market intelligence report for that stock. to view watchlist. Click on any ticker or stock name for detailed market intelligence report for that stock. |
12Stocks.com Performance of Stocks in S&P 500 Index
| Ticker | Stock Name | Watchlist | Category | Recent Price | Smart Investing & Trading Score | Change % | YTD Change% |
| TXN | Texas Instruments |   | Technology | 175.18 | 93 | 0.21 | 2.77% |
| EFX | Equifax | | Financials | 226.14 | 25 | 0.19 | -8.55% |
| CTAS | Cintas | | Services & Goods | 665.33 | 44 | 0.18 | 10.40% |
| XOM | Exxon Mobil | | Energy | 121.25 | 80 | 0.16 | 21.27% |
| HII | Huntington Ingalls | | Industrials | 276.29 | 51 | 0.16 | 6.41% |
| DLR | Digital Realty | | Financials | 140.82 | 48 | 0.15 | 4.64% |
| EMR | Emerson Electric | | Industrials | 109.77 | 61 | 0.14 | 12.78% |
| WDC | Western Digital | | Technology | 69.65 | 61 | 0.14 | 33.00% |
| AAL | American Airlines | | Transports | 13.94 | 22 | 0.14 | 1.46% |
| XYL | Xylem | | Industrials | 130.84 | 83 | 0.13 | 14.41% |
| EBAY | eBay | | Services & Goods | 51.24 | 54 | 0.12 | 17.47% |
| BR | Broadridge Financial | | Technology | 195.31 | 18 | 0.12 | -5.07% |
| NDSN | Nordson | | Industrials | 260.34 | 44 | 0.11 | -1.45% |
| EIX | Edison | | Utilities | 70.90 | 78 | 0.11 | -0.83% |
| CDNS | Cadence Design | | Technology | 277.93 | 10 | 0.10 | 2.04% |
| MCHP | Microchip | | Technology | 90.77 | 100 | 0.10 | 0.65% |
| KEYS | Keysight Technologies | | Technology | 146.75 | 35 | 0.10 | -7.76% |
| CMS | CMS | | Utilities | 60.34 | 93 | 0.09 | 3.90% |
| DUK | Duke | | Utilities | 99.04 | 100 | 0.08 | 2.06% |
| KMI | Kinder Morgan | | Energy | 18.82 | 93 | 0.08 | 6.72% |
| GLW | Corning | | Technology | 31.55 | 28 | 0.08 | 3.60% |
| DXCM | DexCom | | Health Care | 137.97 | 80 | 0.07 | 11.18% |
| V | Visa | | Financials | 275.22 | 53 | 0.07 | 5.71% |
| MMC | Marsh & McLennan | | Financials | 201.07 | 44 | 0.06 | 6.12% |
| NRG | NRG | | Utilities | 72.66 | 69 | 0.06 | 40.53% |
| For chart view version of above stock list: Chart View ➞ 0 - 25 , 25 - 50 , 50 - 75 , 75 - 100 , 100 - 125 , 125 - 150 , 150 - 175 , 175 - 200 , 200 - 225 , 225 - 250 , 250 - 275 , 275 - 300 , 300 - 325 , 325 - 350 , 350 - 375 , 375 - 400 , 400 - 425 , 425 - 450 , 450 - 475 , 475 - 500 | ||
 | Click To Change The Sort Order: By Market Cap or Company Size Performance: Year-to-date, Week and Day |  |
|
Get the most comprehensive stock market coverage daily at 12Stocks.com ➞ Best Stocks Today ➞ Best Stocks Weekly ➞ Best Stocks Year-to-Date ➞ Best Stocks Trends ➞  Best Stocks Today 12Stocks.com Best Nasdaq Stocks ➞ Best S&P 500 Stocks ➞ Best Tech Stocks ➞ Best Biotech Stocks ➞ |
| Detailed Overview of S&P 500 Stocks |
| S&P 500 Technical Overview, Leaders & Laggards, Top S&P 500 ETF Funds & Detailed S&P 500 Stocks List, Charts, Trends & More |
| S&P 500: Technical Analysis, Trends & YTD Performance | |
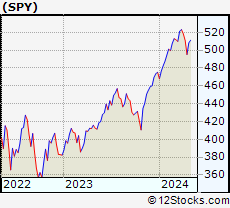
| S&P 500 index as represented by
SPY, an exchange-traded fund [ETF], holds basket of five hundred (mostly largecap) stocks from across all major sectors of the US stock market. The S&P 500 index (contains stocks like Apple and Exxon) is up by 5.58% and is currently outperforming the overall market by 0.73% year-to-date. Below is a quick view of technical charts and trends: | |
 SPY Weekly Chart |
|
| Long Term Trend: Good | |
| Medium Term Trend: Not Good | |
 SPY Daily Chart |
|
| Short Term Trend: Very Good | |
| Overall Trend Score: 44 | |
| YTD Performance: 5.58% | |
| **Trend Scores & Views Are Only For Educational Purposes And Not For Investing | |
| 12Stocks.com: Investing in S&P 500 Index using Exchange Traded Funds | |
|
The following table shows list of key exchange traded funds (ETF) that
help investors track S&P 500 index. The following list also includes leveraged ETF funds that track twice or thrice the daily returns of S&P 500 indices. Short or inverse ETF funds move in the opposite direction to the index they track and are useful during market pullbacks or during bear markets. Quick View: Move mouse or cursor over ETF symbol (ticker) to view short-term technical chart and over ETF name to view long term chart. Click on ticker or stock name for detailed view. Click on to add stock symbol to your watchlist and to view watchlist. |
12Stocks.com List of ETFs that track S&P 500 Index
| Ticker | ETF Name | Watchlist | Recent Price | Smart Investing & Trading Score | Change % | Week % | Year-to-date % |
| SPY | SPDR S&P 500 ETF | | 501.85 | 44 | -0.70 | 1.35 | 5.58% |
| IVV | iShares Core S&P 500 ETF | | 504.31 | 56 | -0.72 | 1.36 | 5.59% |
| VOO | Vanguard 500 ETF | | 461.49 | 56 | -0.65 | 1.4 | 5.65% |
| OEF | iShares S&P 100 | | 237.51 | 44 | -0.95 | 1.21 | 6.32% |
| SSO | ProShares Ultra S&P500 | | 70.96 | 51 | -1.38 | 2.68 | 9.05% |
| UPRO | ProShares UltraPro S&P500 | | 61.44 | 51 | -2.29 | 3.85 | 12.24% |
| SPXL | Direxion Daily S&P500 Bull 3X ETF | | 116.75 | 56 | -2.18 | 3.73 | 12.27% |
| SH | ProShares Short S&P500 | | 12.43 | 57 | 0.81 | -1.27 | -4.31% |
| SDS | ProShares UltraShort S&P500 | | 27.20 | 49 | 1.49 | -2.51 | -9.09% |
| SPXU | ProShares UltraPro Short S&P500 | | 36.82 | 49 | 2.16 | -3.94 | -14.37% |
| SPXS | Direxion Daily S&P 500 Bear 3X ETF | | 9.98 | 32 | 2.36 | -3.67 | -13.59% |
| 12Stocks.com: Charts, Trends, Fundamental Data and Performances of S&P 500 Stocks | |
|
We now take in-depth look at all S&P 500 stocks including charts, multi-period performances and overall trends (as measured by Smart Investing & Trading Score). One can sort S&P 500 stocks (click link to choose) by Daily, Weekly and by Year-to-Date performances. Also, one can sort by size of the company or by market capitalization. |
| Select Your Default Chart Type: | |||||
| |||||
| Click on stock symbol or name for detailed view. Click on to add stock symbol to your watchlist and to view watchlist. Quick View: Move mouse or cursor over "Daily" to quickly view daily technical stock chart and over "Weekly" to view weekly technical stock chart. | |||||

 | TXN Texas Instruments Incorporated |
| Sector: Technology | |
| SubSector: Semiconductor - Broad Line | |
| MarketCap: 99509.1 Millions | |
| Recent Price: 175.18 Smart Investing & Trading Score: 93 | |
| Day Percent Change: 0.21% Day Change: 0.37 | |
| Week Change: 9.71% Year-to-date Change: 2.8% | |
| TXN Links: Profile News Message Board | |
| Charts:- Daily , Weekly | |
| Add TXN to Watchlist: View: Get TXN Trend Analysis ➞ | |
 | EFX Equifax Inc. |
| Sector: Financials | |
| SubSector: Credit Services | |
| MarketCap: 13754.6 Millions | |
| Recent Price: 226.14 Smart Investing & Trading Score: 25 | |
| Day Percent Change: 0.19% Day Change: 0.43 | |
| Week Change: 4.6% Year-to-date Change: -8.6% | |
| EFX Links: Profile News Message Board | |
| Charts:- Daily , Weekly | |
| Add EFX to Watchlist: View: Get EFX Trend Analysis ➞ | |
 | CTAS Cintas Corporation |
| Sector: Services & Goods | |
| SubSector: Business Services | |
| MarketCap: 20154.6 Millions | |
| Recent Price: 665.33 Smart Investing & Trading Score: 44 | |
| Day Percent Change: 0.18% Day Change: 1.20 | |
| Week Change: 0.61% Year-to-date Change: 10.4% | |
| CTAS Links: Profile News Message Board | |
| Charts:- Daily , Weekly | |
| Add CTAS to Watchlist: View: Get CTAS Trend Analysis ➞ | |
 | XOM Exxon Mobil Corporation |
| Sector: Energy | |
| SubSector: Major Integrated Oil & Gas | |
| MarketCap: 156450 Millions | |
| Recent Price: 121.25 Smart Investing & Trading Score: 80 | |
| Day Percent Change: 0.16% Day Change: 0.20 | |
| Week Change: 1.14% Year-to-date Change: 21.3% | |
| XOM Links: Profile News Message Board | |
| Charts:- Daily , Weekly | |
| Add XOM to Watchlist: View: Get XOM Trend Analysis ➞ | |
 | HII Huntington Ingalls Industries, Inc. |
| Sector: Industrials | |
| SubSector: Aerospace/Defense Products & Services | |
| MarketCap: 7276.11 Millions | |
| Recent Price: 276.29 Smart Investing & Trading Score: 51 | |
| Day Percent Change: 0.16% Day Change: 0.45 | |
| Week Change: 1.7% Year-to-date Change: 6.4% | |
| HII Links: Profile News Message Board | |
| Charts:- Daily , Weekly | |
| Add HII to Watchlist: View: Get HII Trend Analysis ➞ | |
 | DLR Digital Realty Trust, Inc. |
| Sector: Financials | |
| SubSector: REIT - Office | |
| MarketCap: 27038.6 Millions | |
| Recent Price: 140.82 Smart Investing & Trading Score: 48 | |
| Day Percent Change: 0.15% Day Change: 0.21 | |
| Week Change: 2.92% Year-to-date Change: 4.6% | |
| DLR Links: Profile News Message Board | |
| Charts:- Daily , Weekly | |
| Add DLR to Watchlist: View: Get DLR Trend Analysis ➞ | |
 | EMR Emerson Electric Co. |
| Sector: Industrials | |
| SubSector: Industrial Electrical Equipment | |
| MarketCap: 30457.9 Millions | |
| Recent Price: 109.77 Smart Investing & Trading Score: 61 | |
| Day Percent Change: 0.14% Day Change: 0.15 | |
| Week Change: 1.1% Year-to-date Change: 12.8% | |
| EMR Links: Profile News Message Board | |
| Charts:- Daily , Weekly | |
| Add EMR to Watchlist: View: Get EMR Trend Analysis ➞ | |
 | WDC Western Digital Corporation |
| Sector: Technology | |
| SubSector: Data Storage Devices | |
| MarketCap: 10712.9 Millions | |
| Recent Price: 69.65 Smart Investing & Trading Score: 61 | |
| Day Percent Change: 0.14% Day Change: 0.10 | |
| Week Change: 5.45% Year-to-date Change: 33.0% | |
| WDC Links: Profile News Message Board | |
| Charts:- Daily , Weekly | |
| Add WDC to Watchlist: View: Get WDC Trend Analysis ➞ | |
 | AAL American Airlines Group Inc. |
| Sector: Transports | |
| SubSector: Major Airlines | |
| MarketCap: 5346.45 Millions | |
| Recent Price: 13.94 Smart Investing & Trading Score: 22 | |
| Day Percent Change: 0.14% Day Change: 0.02 | |
| Week Change: -1.2% Year-to-date Change: 1.5% | |
| AAL Links: Profile News Message Board | |
| Charts:- Daily , Weekly | |
| Add AAL to Watchlist: View: Get AAL Trend Analysis ➞ | |
 | XYL Xylem Inc. |
| Sector: Industrials | |
| SubSector: Diversified Machinery | |
| MarketCap: 12195.1 Millions | |
| Recent Price: 130.84 Smart Investing & Trading Score: 83 | |
| Day Percent Change: 0.13% Day Change: 0.17 | |
| Week Change: 2.35% Year-to-date Change: 14.4% | |
| XYL Links: Profile News Message Board | |
| Charts:- Daily , Weekly | |
| Add XYL to Watchlist: View: Get XYL Trend Analysis ➞ | |
 | EBAY eBay Inc. |
| Sector: Services & Goods | |
| SubSector: Specialty Retail, Other | |
| MarketCap: 23152.3 Millions | |
| Recent Price: 51.24 Smart Investing & Trading Score: 54 | |
| Day Percent Change: 0.12% Day Change: 0.06 | |
| Week Change: 1.69% Year-to-date Change: 17.5% | |
| EBAY Links: Profile News Message Board | |
| Charts:- Daily , Weekly | |
| Add EBAY to Watchlist: View: Get EBAY Trend Analysis ➞ | |
 | BR Broadridge Financial Solutions, Inc. |
| Sector: Technology | |
| SubSector: Information Technology Services | |
| MarketCap: 10633.8 Millions | |
| Recent Price: 195.31 Smart Investing & Trading Score: 18 | |
| Day Percent Change: 0.12% Day Change: 0.23 | |
| Week Change: 1% Year-to-date Change: -5.1% | |
| BR Links: Profile News Message Board | |
| Charts:- Daily , Weekly | |
| Add BR to Watchlist: View: Get BR Trend Analysis ➞ | |
 | NDSN Nordson Corporation |
| Sector: Industrials | |
| SubSector: Diversified Machinery | |
| MarketCap: 7117.56 Millions | |
| Recent Price: 260.34 Smart Investing & Trading Score: 44 | |
| Day Percent Change: 0.11% Day Change: 0.28 | |
| Week Change: 0.29% Year-to-date Change: -1.5% | |
| NDSN Links: Profile News Message Board | |
| Charts:- Daily , Weekly | |
| Add NDSN to Watchlist: View: Get NDSN Trend Analysis ➞ | |
 | EIX Edison International |
| Sector: Utilities | |
| SubSector: Electric Utilities | |
| MarketCap: 19358.1 Millions | |
| Recent Price: 70.90 Smart Investing & Trading Score: 78 | |
| Day Percent Change: 0.11% Day Change: 0.08 | |
| Week Change: 1.39% Year-to-date Change: -0.8% | |
| EIX Links: Profile News Message Board | |
| Charts:- Daily , Weekly | |
| Add EIX to Watchlist: View: Get EIX Trend Analysis ➞ | |
 | CDNS Cadence Design Systems, Inc. |
| Sector: Technology | |
| SubSector: Application Software | |
| MarketCap: 16865.8 Millions | |
| Recent Price: 277.93 Smart Investing & Trading Score: 10 | |
| Day Percent Change: 0.10% Day Change: 0.26 | |
| Week Change: -0.83% Year-to-date Change: 2.0% | |
| CDNS Links: Profile News Message Board | |
| Charts:- Daily , Weekly | |
| Add CDNS to Watchlist: View: Get CDNS Trend Analysis ➞ | |
 | MCHP Microchip Technology Incorporated |
| Sector: Technology | |
| SubSector: Semiconductor - Broad Line | |
| MarketCap: 16826.3 Millions | |
| Recent Price: 90.77 Smart Investing & Trading Score: 100 | |
| Day Percent Change: 0.10% Day Change: 0.09 | |
| Week Change: 11.13% Year-to-date Change: 0.7% | |
| MCHP Links: Profile News Message Board | |
| Charts:- Daily , Weekly | |
| Add MCHP to Watchlist: View: Get MCHP Trend Analysis ➞ | |
 | KEYS Keysight Technologies, Inc. |
| Sector: Technology | |
| SubSector: Scientific & Technical Instruments | |
| MarketCap: 17355.1 Millions | |
| Recent Price: 146.75 Smart Investing & Trading Score: 35 | |
| Day Percent Change: 0.10% Day Change: 0.15 | |
| Week Change: 1.12% Year-to-date Change: -7.8% | |
| KEYS Links: Profile News Message Board | |
| Charts:- Daily , Weekly | |
| Add KEYS to Watchlist: View: Get KEYS Trend Analysis ➞ | |
 | CMS CMS Energy Corporation |
| Sector: Utilities | |
| SubSector: Electric Utilities | |
| MarketCap: 15105.8 Millions | |
| Recent Price: 60.34 Smart Investing & Trading Score: 93 | |
| Day Percent Change: 0.09% Day Change: 0.05 | |
| Week Change: 1.32% Year-to-date Change: 3.9% | |
| CMS Links: Profile News Message Board | |
| Charts:- Daily , Weekly | |
| Add CMS to Watchlist: View: Get CMS Trend Analysis ➞ | |
 | DUK Duke Energy Corporation |
| Sector: Utilities | |
| SubSector: Electric Utilities | |
| MarketCap: 56678.2 Millions | |
| Recent Price: 99.04 Smart Investing & Trading Score: 100 | |
| Day Percent Change: 0.08% Day Change: 0.08 | |
| Week Change: 0.81% Year-to-date Change: 2.1% | |
| DUK Links: Profile News Message Board | |
| Charts:- Daily , Weekly | |
| Add DUK to Watchlist: View: Get DUK Trend Analysis ➞ | |
 | KMI Kinder Morgan, Inc. |
| Sector: Energy | |
| SubSector: Oil & Gas Pipelines | |
| MarketCap: 31283.5 Millions | |
| Recent Price: 18.82 Smart Investing & Trading Score: 93 | |
| Day Percent Change: 0.08% Day Change: 0.02 | |
| Week Change: -0.08% Year-to-date Change: 6.7% | |
| KMI Links: Profile News Message Board | |
| Charts:- Daily , Weekly | |
| Add KMI to Watchlist: View: Get KMI Trend Analysis ➞ | |
 | GLW Corning Incorporated |
| Sector: Technology | |
| SubSector: Diversified Electronics | |
| MarketCap: 16287.6 Millions | |
| Recent Price: 31.55 Smart Investing & Trading Score: 28 | |
| Day Percent Change: 0.08% Day Change: 0.03 | |
| Week Change: 0.88% Year-to-date Change: 3.6% | |
| GLW Links: Profile News Message Board | |
| Charts:- Daily , Weekly | |
| Add GLW to Watchlist: View: Get GLW Trend Analysis ➞ | |
 | DXCM DexCom, Inc. |
| Sector: Health Care | |
| SubSector: Medical Laboratories & Research | |
| MarketCap: 19559 Millions | |
| Recent Price: 137.97 Smart Investing & Trading Score: 80 | |
| Day Percent Change: 0.07% Day Change: 0.09 | |
| Week Change: 5.55% Year-to-date Change: 11.2% | |
| DXCM Links: Profile News Message Board | |
| Charts:- Daily , Weekly | |
| Add DXCM to Watchlist: View: Get DXCM Trend Analysis ➞ | |
 | V Visa Inc. |
| Sector: Financials | |
| SubSector: Credit Services | |
| MarketCap: 340798 Millions | |
| Recent Price: 275.22 Smart Investing & Trading Score: 53 | |
| Day Percent Change: 0.07% Day Change: 0.20 | |
| Week Change: 2.02% Year-to-date Change: 5.7% | |
| V Links: Profile News Message Board | |
| Charts:- Daily , Weekly | |
| Add V to Watchlist: View: Get V Trend Analysis ➞ | |
 | MMC Marsh & McLennan Companies, Inc. |
| Sector: Financials | |
| SubSector: Insurance Brokers | |
| MarketCap: 42821.8 Millions | |
| Recent Price: 201.07 Smart Investing & Trading Score: 44 | |
| Day Percent Change: 0.06% Day Change: 0.12 | |
| Week Change: -0.66% Year-to-date Change: 6.1% | |
| MMC Links: Profile News Message Board | |
| Charts:- Daily , Weekly | |
| Add MMC to Watchlist: View: Get MMC Trend Analysis ➞ | |
 | NRG NRG Energy, Inc. |
| Sector: Utilities | |
| SubSector: Diversified Utilities | |
| MarketCap: 6510.7 Millions | |
| Recent Price: 72.66 Smart Investing & Trading Score: 69 | |
| Day Percent Change: 0.06% Day Change: 0.05 | |
| Week Change: 3.84% Year-to-date Change: 40.5% | |
| NRG Links: Profile News Message Board | |
| Charts:- Daily , Weekly | |
| Add NRG to Watchlist: View: Get NRG Trend Analysis ➞ | |
| For tabular summary view of above stock list: Summary View ➞ 0 - 25 , 25 - 50 , 50 - 75 , 75 - 100 , 100 - 125 , 125 - 150 , 150 - 175 , 175 - 200 , 200 - 225 , 225 - 250 , 250 - 275 , 275 - 300 , 300 - 325 , 325 - 350 , 350 - 375 , 375 - 400 , 400 - 425 , 425 - 450 , 450 - 475 , 475 - 500 | ||
| Click To Change The Sort Order: By Market Cap or Company Size Performance: Year-to-date, Week and Day | |
| Select Chart Type: | ||
|
Best Stocks Today 12Stocks.com |
© 2024 12Stocks.com Terms & Conditions Privacy Contact Us
All Information Provided Only For Education And Not To Be Used For Investing or Trading. See Terms & Conditions


One More Thing ... Get Best Stocks Delivered Daily!
Never Ever Miss A Move With Our Top Ten Stocks Lists
Find Best Stocks In Any Market - Bull or Bear Market
Take A Peek At Our Top Ten Stocks Lists: Daily, Weekly, Year-to-Date & Top Trends
Find Best Stocks In Any Market - Bull or Bear Market
Take A Peek At Our Top Ten Stocks Lists: Daily, Weekly, Year-to-Date & Top Trends
S&P 500 Stocks With Best Up Trends [0-bearish to 100-bullish]: Newmont [100], Teradyne [100], Chipotle Mexican[100], Dover [100], Northrop Grumman[100], EQT [100], Merck [100], Tractor Supply[100], Hess [100], General Motors[100], Omnicom [100]
Best S&P 500 Stocks Year-to-Date:
NVIDIA [66.63%], Constellation [61.56%], NRG [40.53%], Chipotle Mexican[36.47%], Targa Resources[35.12%], Marathon [34.21%], Diamondback [33.54%], Western Digital[33%], Progressive [31.85%], Eaton [31.52%], Micron [30.9%] Best S&P 500 Stocks This Week:
Hasbro [17.19%], Tesla [13.13%], Teradyne [13.08%], Wabtec [12.67%], Tyler Technologies[12.33%], Newmont [11.94%], Globe Life[11.9%], Monolithic Power[11.78%], Microchip [11.13%], NXP Semiconductors[10.44%], EQT [10.33%] Best S&P 500 Stocks Daily:
Newmont [13.16%], Tyler Technologies[8.13%], Teradyne [7.77%], Carrier Global[7.19%], Chipotle Mexican[6.63%], United Rentals[5.72%], Dover [5.14%], Arista Networks[4.92%], Union Pacific[4.73%], Keurig Dr[4.07%], Zebra Technologies[3.90%]