
 Login Sign Up


| |||||
 |  | ||||

| 12Stocks.com Market Intelligence |
Best S&P 500 Stocks
|
On this page, you will find the most comprehensive analysis of S&P 500 stocks and ETFs - from latest trends to performances to charts ➞. First, here are the year-to-date (YTD) performances of the most requested S&P 500 stocks at 12Stocks.com (click stock for review):
| NVIDIA 72% | ||
| Caterpillar 23% | ||
| Amazon.com 20% | ||
| Merck 15% | ||
| Walmart 13% | ||
| Google 12% | ||
| Microsoft 9% | ||
| JPMorgan Chase 8% | ||
| Chevron 6% | ||
| Goldman Sachs 5% | ||
| Johnson & Johnson -7% | ||
| McDonald s -9% | ||
| Starbucks -10% | ||
| Apple -13% | ||
| Gilead -18% | ||
| Intel -29% | ||
| Boeing -34% | ||
| Quick: S&P 500 Stocks Lists: Performances & Trends, S&P 500 Stock Charts
Sort S&P 500 stocks: Daily, Weekly, Year-to-Date, Market Cap & Trends. Filter S&P 500 stocks list by sector: Show all, Tech, Finance, Energy, Staples, Retail, Industrial, Materials, Utilities and HealthCare |
| 12Stocks.com S&P 500 Stocks Performances & Trends Daily Report | |||||||||
|
| 
The overall Smart Investing & Trading Score is 44 (0-bearish to 100-bullish) which puts S&P 500 index in short term neutral trend. The Smart Investing & Trading Score from previous trading session is 26 and hence an improvement of trend. | ||||||||
Here are the Smart Investing & Trading Scores of the most requested S&P 500 stocks at 12Stocks.com (click stock name for detailed review):
|


| 12Stocks.com: Top Performing S&P 500 Index Stocks | ||||||||||||||||||||||||||||||||||||||||||||||||
 The top performing S&P 500 Index stocks year to date are
Now, more recently, over last week, the top performing S&P 500 Index stocks on the move are


|
||||||||||||||||||||||||||||||||||||||||||||||||
| 12Stocks.com: Investing in S&P 500 Index with Stocks | |
|
The following table helps investors and traders sort through current performance and trends (as measured by Smart Investing & Trading Score) of various
stocks in the S&P 500 Index. Quick View: Move mouse or cursor over stock symbol (ticker) to view short-term technical chart and over stock name to view long term chart. Click on  to add stock symbol to your watchlist and to add stock symbol to your watchlist and  to view watchlist. Click on any ticker or stock name for detailed market intelligence report for that stock. to view watchlist. Click on any ticker or stock name for detailed market intelligence report for that stock. |
12Stocks.com Performance of Stocks in S&P 500 Index
| Ticker | Stock Name | Watchlist | Category | Recent Price | Smart Investing & Trading Score | Change % | YTD Change% |
| GPN | Global Payments |   | Services & Goods | 123.45 | 18 | 0.41 | -2.80% |
| SJM | J. M. | | Consumer Staples | 110.25 | 25 | 0.41 | -12.76% |
| ECL | Ecolab | | Materials | 220.14 | 49 | 0.41 | 10.99% |
| MCHP | Microchip | | Technology | 85.42 | 31 | 0.41 | -5.28% |
| GOOGL | | Technology | 156.11 | 90 | 0.41 | 11.75% | |
| ICE | Intercontinental Exchange | | Financials | 131.26 | 51 | 0.40 | 2.20% |
| AIZ | Assurant | | Financials | 170.76 | 43 | 0.40 | 1.34% |
| ZTS | Zoetis | | Health Care | 152.55 | 25 | 0.40 | -22.71% |
| NDAQ | Nasdaq | | Financials | 60.24 | 61 | 0.39 | 3.62% |
| DG | Dollar General | | Services & Goods | 145.06 | 54 | 0.39 | 6.70% |
| LDOS | Leidos Holdings | | Technology | 124.85 | 56 | 0.39 | 15.35% |
| TMUS | T-Mobile US | | Technology | 160.72 | 38 | 0.39 | 0.24% |
| GRMN | Garmin | | Technology | 141.61 | 56 | 0.38 | 10.17% |
| HPE | Hewlett Packard | | Technology | 17.09 | 46 | 0.38 | 0.68% |
| MCD | McDonald s | | Services & Goods | 270.95 | 49 | 0.37 | -8.62% |
| AVGO | Broadcom | | Technology | 1287.35 | 26 | 0.37 | 15.33% |
| GEHC | GE HealthCare | | Health Care | 85.50 | 56 | 0.37 | 10.54% |
| GIS | General Mills | | Consumer Staples | 68.76 | 73 | 0.36 | 5.56% |
| CLX | Clorox | | Consumer Staples | 142.85 | 32 | 0.36 | 0.18% |
| CPB | Campbell Soup | | Consumer Staples | 43.46 | 52 | 0.35 | 0.53% |
| NOW | ServiceNow | | Technology | 739.06 | 18 | 0.35 | 4.61% |
| EA | Electronic Arts | | Technology | 126.75 | 18 | 0.35 | -7.35% |
| IT | Gartner | | Technology | 450.86 | 0 | 0.34 | -0.06% |
| NWSA | News | | Services & Goods | 24.23 | 25 | 0.33 | -1.30% |
| TJX | TJX | | Services & Goods | 93.42 | 18 | 0.32 | -0.41% |
| For chart view version of above stock list: Chart View ➞ 0 - 25 , 25 - 50 , 50 - 75 , 75 - 100 , 100 - 125 , 125 - 150 , 150 - 175 , 175 - 200 , 200 - 225 , 225 - 250 , 250 - 275 , 275 - 300 , 300 - 325 , 325 - 350 , 350 - 375 , 375 - 400 , 400 - 425 , 425 - 450 , 450 - 475 | ||
 | Click To Change The Sort Order: By Market Cap or Company Size Performance: Year-to-date, Week and Day |  |
|
Get the most comprehensive stock market coverage daily at 12Stocks.com ➞ Best Stocks Today ➞ Best Stocks Weekly ➞ Best Stocks Year-to-Date ➞ Best Stocks Trends ➞  Best Stocks Today 12Stocks.com Best Nasdaq Stocks ➞ Best S&P 500 Stocks ➞ Best Tech Stocks ➞ Best Biotech Stocks ➞ |
| Detailed Overview of S&P 500 Stocks |
| S&P 500 Technical Overview, Leaders & Laggards, Top S&P 500 ETF Funds & Detailed S&P 500 Stocks List, Charts, Trends & More |
| S&P 500: Technical Analysis, Trends & YTD Performance | |
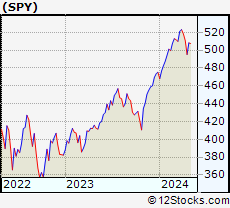
| S&P 500 index as represented by
SPY, an exchange-traded fund [ETF], holds basket of five hundred (mostly largecap) stocks from across all major sectors of the US stock market. The S&P 500 index (contains stocks like Apple and Exxon) is up by 5.9% and is currently outperforming the overall market by 0.85% year-to-date. Below is a quick view of technical charts and trends: | |
 SPY Weekly Chart |
|
| Long Term Trend: Good | |
| Medium Term Trend: Not Good | |
 SPY Daily Chart |
|
| Short Term Trend: Deteriorating | |
| Overall Trend Score: 44 | |
| YTD Performance: 5.9% | |
| **Trend Scores & Views Are Only For Educational Purposes And Not For Investing | |
| 12Stocks.com: Investing in S&P 500 Index using Exchange Traded Funds | |
|
The following table shows list of key exchange traded funds (ETF) that
help investors track S&P 500 index. The following list also includes leveraged ETF funds that track twice or thrice the daily returns of S&P 500 indices. Short or inverse ETF funds move in the opposite direction to the index they track and are useful during market pullbacks or during bear markets. Quick View: Move mouse or cursor over ETF symbol (ticker) to view short-term technical chart and over ETF name to view long term chart. Click on ticker or stock name for detailed view. Click on to add stock symbol to your watchlist and to view watchlist. |
12Stocks.com List of ETFs that track S&P 500 Index
| Ticker | ETF Name | Watchlist | Recent Price | Smart Investing & Trading Score | Change % | Week % | Year-to-date % |
| SPY | SPDR S&P 500 ETF | | 503.38 | 44 | 0.56 | -1.46 | 5.9% |
| IVV | iShares Core S&P 500 ETF | | 505.72 | 44 | 0.53 | -1.48 | 5.88% |
| VOO | Vanguard 500 ETF | | 462.63 | 44 | 0.57 | -1.48 | 5.91% |
| OEF | iShares S&P 100 | | 239.19 | 44 | 0.53 | -1.62 | 7.07% |
| SSO | ProShares Ultra S&P500 | | 71.43 | 44 | 1.09 | -3.03 | 9.77% |
| UPRO | ProShares UltraPro S&P500 | | 62.23 | 36 | 1.58 | -4.56 | 13.68% |
| SPXL | Direxion Daily S&P500 Bull 3X ETF | | 116.55 | 36 | 0.17 | -5.89 | 12.08% |
| SH | ProShares Short S&P500 | | 12.38 | 62 | -0.48 | 1.56 | -4.7% |
| SDS | ProShares UltraShort S&P500 | | 26.99 | 62 | -1.03 | 3.13 | -9.79% |
| SPXU | ProShares UltraPro Short S&P500 | | 36.49 | 69 | -1.56 | 4.68 | -15.14% |
| SPXS | Direxion Daily S&P 500 Bear 3X ETF | | 9.87 | 59 | -1.40 | 4.78 | -14.55% |
| 12Stocks.com: Charts, Trends, Fundamental Data and Performances of S&P 500 Stocks | |
|
We now take in-depth look at all S&P 500 stocks including charts, multi-period performances and overall trends (as measured by Smart Investing & Trading Score). One can sort S&P 500 stocks (click link to choose) by Daily, Weekly and by Year-to-Date performances. Also, one can sort by size of the company or by market capitalization. |
| Select Your Default Chart Type: | |||||
| |||||
| Click on stock symbol or name for detailed view. Click on to add stock symbol to your watchlist and to view watchlist. Quick View: Move mouse or cursor over "Daily" to quickly view daily technical stock chart and over "Weekly" to view weekly technical stock chart. | |||||

 | GPN Global Payments Inc. |
| Sector: Services & Goods | |
| SubSector: Business Services | |
| MarketCap: 39068.8 Millions | |
| Recent Price: 123.45 Smart Investing & Trading Score: 18 | |
| Day Percent Change: 0.41% Day Change: 0.50 | |
| Week Change: -0.23% Year-to-date Change: -2.8% | |
| GPN Links: Profile News Message Board | |
| Charts:- Daily , Weekly | |
| Add GPN to Watchlist: View: Get GPN Trend Analysis ➞ | |
 | SJM The J. M. Smucker Company |
| Sector: Consumer Staples | |
| SubSector: Processed & Packaged Goods | |
| MarketCap: 12635.8 Millions | |
| Recent Price: 110.25 Smart Investing & Trading Score: 25 | |
| Day Percent Change: 0.41% Day Change: 0.45 | |
| Week Change: 0.58% Year-to-date Change: -12.8% | |
| SJM Links: Profile News Message Board | |
| Charts:- Daily , Weekly | |
| Add SJM to Watchlist: View: Get SJM Trend Analysis ➞ | |
 | ECL Ecolab Inc. |
| Sector: Materials | |
| SubSector: Specialty Chemicals | |
| MarketCap: 46215.9 Millions | |
| Recent Price: 220.14 Smart Investing & Trading Score: 49 | |
| Day Percent Change: 0.41% Day Change: 0.89 | |
| Week Change: -0.7% Year-to-date Change: 11.0% | |
| ECL Links: Profile News Message Board | |
| Charts:- Daily , Weekly | |
| Add ECL to Watchlist: View: Get ECL Trend Analysis ➞ | |
 | MCHP Microchip Technology Incorporated |
| Sector: Technology | |
| SubSector: Semiconductor - Broad Line | |
| MarketCap: 16826.3 Millions | |
| Recent Price: 85.42 Smart Investing & Trading Score: 31 | |
| Day Percent Change: 0.41% Day Change: 0.35 | |
| Week Change: -0.26% Year-to-date Change: -5.3% | |
| MCHP Links: Profile News Message Board | |
| Charts:- Daily , Weekly | |
| Add MCHP to Watchlist: View: Get MCHP Trend Analysis ➞ | |
 | GOOGL Alphabet Inc. |
| Sector: Technology | |
| SubSector: Internet Information Providers | |
| MarketCap: 801264 Millions | |
| Recent Price: 156.11 Smart Investing & Trading Score: 90 | |
| Day Percent Change: 0.41% Day Change: 0.64 | |
| Week Change: -1.03% Year-to-date Change: 11.8% | |
| GOOGL Links: Profile News Message Board | |
| Charts:- Daily , Weekly | |
| Add GOOGL to Watchlist: View: Get GOOGL Trend Analysis ➞ | |
 | ICE Intercontinental Exchange, Inc. |
| Sector: Financials | |
| SubSector: Diversified Investments | |
| MarketCap: 46054.6 Millions | |
| Recent Price: 131.26 Smart Investing & Trading Score: 51 | |
| Day Percent Change: 0.40% Day Change: 0.52 | |
| Week Change: -1.71% Year-to-date Change: 2.2% | |
| ICE Links: Profile News Message Board | |
| Charts:- Daily , Weekly | |
| Add ICE to Watchlist: View: Get ICE Trend Analysis ➞ | |
 | AIZ Assurant, Inc. |
| Sector: Financials | |
| SubSector: Accident & Health Insurance | |
| MarketCap: 6110.3 Millions | |
| Recent Price: 170.76 Smart Investing & Trading Score: 43 | |
| Day Percent Change: 0.40% Day Change: 0.67 | |
| Week Change: -1.97% Year-to-date Change: 1.3% | |
| AIZ Links: Profile News Message Board | |
| Charts:- Daily , Weekly | |
| Add AIZ to Watchlist: View: Get AIZ Trend Analysis ➞ | |
 | ZTS Zoetis Inc. |
| Sector: Health Care | |
| SubSector: Drugs - Generic | |
| MarketCap: 51921.5 Millions | |
| Recent Price: 152.55 Smart Investing & Trading Score: 25 | |
| Day Percent Change: 0.40% Day Change: 0.61 | |
| Week Change: 1.71% Year-to-date Change: -22.7% | |
| ZTS Links: Profile News Message Board | |
| Charts:- Daily , Weekly | |
| Add ZTS to Watchlist: View: Get ZTS Trend Analysis ➞ | |
 | NDAQ Nasdaq, Inc. |
| Sector: Financials | |
| SubSector: Diversified Investments | |
| MarketCap: 14885.2 Millions | |
| Recent Price: 60.24 Smart Investing & Trading Score: 61 | |
| Day Percent Change: 0.39% Day Change: 0.23 | |
| Week Change: -2.07% Year-to-date Change: 3.6% | |
| NDAQ Links: Profile News Message Board | |
| Charts:- Daily , Weekly | |
| Add NDAQ to Watchlist: View: Get NDAQ Trend Analysis ➞ | |
 | DG Dollar General Corporation |
| Sector: Services & Goods | |
| SubSector: Discount, Variety Stores | |
| MarketCap: 39611.9 Millions | |
| Recent Price: 145.06 Smart Investing & Trading Score: 54 | |
| Day Percent Change: 0.39% Day Change: 0.57 | |
| Week Change: -1.84% Year-to-date Change: 6.7% | |
| DG Links: Profile News Message Board | |
| Charts:- Daily , Weekly | |
| Add DG to Watchlist: View: Get DG Trend Analysis ➞ | |
 | LDOS Leidos Holdings, Inc. |
| Sector: Technology | |
| SubSector: Information Technology Services | |
| MarketCap: 11707.5 Millions | |
| Recent Price: 124.85 Smart Investing & Trading Score: 56 | |
| Day Percent Change: 0.39% Day Change: 0.49 | |
| Week Change: -0.7% Year-to-date Change: 15.4% | |
| LDOS Links: Profile News Message Board | |
| Charts:- Daily , Weekly | |
| Add LDOS to Watchlist: View: Get LDOS Trend Analysis ➞ | |
 | TMUS T-Mobile US, Inc. |
| Sector: Technology | |
| SubSector: Wireless Communications | |
| MarketCap: 71949 Millions | |
| Recent Price: 160.72 Smart Investing & Trading Score: 38 | |
| Day Percent Change: 0.39% Day Change: 0.63 | |
| Week Change: 0.42% Year-to-date Change: 0.2% | |
| TMUS Links: Profile News Message Board | |
| Charts:- Daily , Weekly | |
| Add TMUS to Watchlist: View: Get TMUS Trend Analysis ➞ | |
 | GRMN Garmin Ltd. |
| Sector: Technology | |
| SubSector: Scientific & Technical Instruments | |
| MarketCap: 13909.3 Millions | |
| Recent Price: 141.61 Smart Investing & Trading Score: 56 | |
| Day Percent Change: 0.38% Day Change: 0.54 | |
| Week Change: -1.05% Year-to-date Change: 10.2% | |
| GRMN Links: Profile News Message Board | |
| Charts:- Daily , Weekly | |
| Add GRMN to Watchlist: View: Get GRMN Trend Analysis ➞ | |
 | HPE Hewlett Packard Enterprise Company |
| Sector: Technology | |
| SubSector: Communication Equipment | |
| MarketCap: 12886.1 Millions | |
| Recent Price: 17.09 Smart Investing & Trading Score: 46 | |
| Day Percent Change: 0.38% Day Change: 0.06 | |
| Week Change: -1.87% Year-to-date Change: 0.7% | |
| HPE Links: Profile News Message Board | |
| Charts:- Daily , Weekly | |
| Add HPE to Watchlist: View: Get HPE Trend Analysis ➞ | |
 | MCD McDonald s Corporation |
| Sector: Services & Goods | |
| SubSector: Restaurants | |
| MarketCap: 122481 Millions | |
| Recent Price: 270.95 Smart Investing & Trading Score: 49 | |
| Day Percent Change: 0.37% Day Change: 1.00 | |
| Week Change: 1.33% Year-to-date Change: -8.6% | |
| MCD Links: Profile News Message Board | |
| Charts:- Daily , Weekly | |
| Add MCD to Watchlist: View: Get MCD Trend Analysis ➞ | |
 | AVGO Broadcom Inc. |
| Sector: Technology | |
| SubSector: Semiconductor - Broad Line | |
| MarketCap: 86329.1 Millions | |
| Recent Price: 1287.35 Smart Investing & Trading Score: 26 | |
| Day Percent Change: 0.37% Day Change: 4.72 | |
| Week Change: -4.22% Year-to-date Change: 15.3% | |
| AVGO Links: Profile News Message Board | |
| Charts:- Daily , Weekly | |
| Add AVGO to Watchlist: View: Get AVGO Trend Analysis ➞ | |
 | GEHC GE HealthCare Technologies Inc. |
| Sector: Health Care | |
| SubSector: Health Information Services | |
| MarketCap: 36240 Millions | |
| Recent Price: 85.50 Smart Investing & Trading Score: 56 | |
| Day Percent Change: 0.37% Day Change: 0.31 | |
| Week Change: -3.08% Year-to-date Change: 10.5% | |
| GEHC Links: Profile News Message Board | |
| Charts:- Daily , Weekly | |
| Add GEHC to Watchlist: View: Get GEHC Trend Analysis ➞ | |
 | GIS General Mills, Inc. |
| Sector: Consumer Staples | |
| SubSector: Processed & Packaged Goods | |
| MarketCap: 34131.7 Millions | |
| Recent Price: 68.76 Smart Investing & Trading Score: 73 | |
| Day Percent Change: 0.36% Day Change: 0.25 | |
| Week Change: 3.87% Year-to-date Change: 5.6% | |
| GIS Links: Profile News Message Board | |
| Charts:- Daily , Weekly | |
| Add GIS to Watchlist: View: Get GIS Trend Analysis ➞ | |
 | CLX The Clorox Company |
| Sector: Consumer Staples | |
| SubSector: Housewares & Accessories | |
| MarketCap: 23688.3 Millions | |
| Recent Price: 142.85 Smart Investing & Trading Score: 32 | |
| Day Percent Change: 0.36% Day Change: 0.51 | |
| Week Change: 0.61% Year-to-date Change: 0.2% | |
| CLX Links: Profile News Message Board | |
| Charts:- Daily , Weekly | |
| Add CLX to Watchlist: View: Get CLX Trend Analysis ➞ | |
 | CPB Campbell Soup Company |
| Sector: Consumer Staples | |
| SubSector: Processed & Packaged Goods | |
| MarketCap: 14468.8 Millions | |
| Recent Price: 43.46 Smart Investing & Trading Score: 52 | |
| Day Percent Change: 0.35% Day Change: 0.15 | |
| Week Change: 2.72% Year-to-date Change: 0.5% | |
| CPB Links: Profile News Message Board | |
| Charts:- Daily , Weekly | |
| Add CPB to Watchlist: View: Get CPB Trend Analysis ➞ | |
 | NOW ServiceNow, Inc. |
| Sector: Technology | |
| SubSector: Information Technology Services | |
| MarketCap: 53599.1 Millions | |
| Recent Price: 739.06 Smart Investing & Trading Score: 18 | |
| Day Percent Change: 0.35% Day Change: 2.61 | |
| Week Change: -3.86% Year-to-date Change: 4.6% | |
| NOW Links: Profile News Message Board | |
| Charts:- Daily , Weekly | |
| Add NOW to Watchlist: View: Get NOW Trend Analysis ➞ | |
 | EA Electronic Arts Inc. |
| Sector: Technology | |
| SubSector: Multimedia & Graphics Software | |
| MarketCap: 27296.5 Millions | |
| Recent Price: 126.75 Smart Investing & Trading Score: 18 | |
| Day Percent Change: 0.35% Day Change: 0.44 | |
| Week Change: -0.89% Year-to-date Change: -7.4% | |
| EA Links: Profile News Message Board | |
| Charts:- Daily , Weekly | |
| Add EA to Watchlist: View: Get EA Trend Analysis ➞ | |
 | IT Gartner, Inc. |
| Sector: Technology | |
| SubSector: Information Technology Services | |
| MarketCap: 7767.98 Millions | |
| Recent Price: 450.86 Smart Investing & Trading Score: 0 | |
| Day Percent Change: 0.34% Day Change: 1.55 | |
| Week Change: -3.13% Year-to-date Change: -0.1% | |
| IT Links: Profile News Message Board | |
| Charts:- Daily , Weekly | |
| Add IT to Watchlist: View: Get IT Trend Analysis ➞ | |
 | NWSA News Corporation |
| Sector: Services & Goods | |
| SubSector: Broadcasting - TV | |
| MarketCap: 5857.53 Millions | |
| Recent Price: 24.23 Smart Investing & Trading Score: 25 | |
| Day Percent Change: 0.33% Day Change: 0.08 | |
| Week Change: -0.53% Year-to-date Change: -1.3% | |
| NWSA Links: Profile News Message Board | |
| Charts:- Daily , Weekly | |
| Add NWSA to Watchlist: View: Get NWSA Trend Analysis ➞ | |
 | TJX The TJX Companies, Inc. |
| Sector: Services & Goods | |
| SubSector: Department Stores | |
| MarketCap: 50656.2 Millions | |
| Recent Price: 93.42 Smart Investing & Trading Score: 18 | |
| Day Percent Change: 0.32% Day Change: 0.30 | |
| Week Change: -1.05% Year-to-date Change: -0.4% | |
| TJX Links: Profile News Message Board | |
| Charts:- Daily , Weekly | |
| Add TJX to Watchlist: View: Get TJX Trend Analysis ➞ | |
| For tabular summary view of above stock list: Summary View ➞ 0 - 25 , 25 - 50 , 50 - 75 , 75 - 100 , 100 - 125 , 125 - 150 , 150 - 175 , 175 - 200 , 200 - 225 , 225 - 250 , 250 - 275 , 275 - 300 , 300 - 325 , 325 - 350 , 350 - 375 , 375 - 400 , 400 - 425 , 425 - 450 , 450 - 475 | ||
| Click To Change The Sort Order: By Market Cap or Company Size Performance: Year-to-date, Week and Day | |
| Select Chart Type: | ||
|
Best Stocks Today 12Stocks.com |
© 2024 12Stocks.com Terms & Conditions Privacy Contact Us
All Information Provided Only For Education And Not To Be Used For Investing or Trading. See Terms & Conditions


One More Thing ... Get Best Stocks Delivered Daily!
Never Ever Miss A Move With Our Top Ten Stocks Lists
Find Best Stocks In Any Market - Bull or Bear Market
Take A Peek At Our Top Ten Stocks Lists: Daily, Weekly, Year-to-Date & Top Trends
Find Best Stocks In Any Market - Bull or Bear Market
Take A Peek At Our Top Ten Stocks Lists: Daily, Weekly, Year-to-Date & Top Trends
S&P 500 Stocks With Best Up Trends [0-bearish to 100-bullish]: Genuine Parts[100], United Airlines[100], Generac Holdings[93], Delta Air[93], Charles Schwab[93], Bunge [93], Lockheed Martin[93], Wells Fargo[90], Google [90], Google [90], Freeport-McMoRan [88]
Best S&P 500 Stocks Year-to-Date:
NVIDIA [72.44%], Constellation [59.78%], Meta Platforms[44.17%], NRG [40.48%], Micron [35.16%], Western Digital[34.81%], Marathon [33.15%], Progressive [31.69%], Eaton [30.68%], Diamondback [29.89%], Targa Resources[29.2%] Best S&P 500 Stocks This Week:
United Airlines[21.81%], UnitedHealth [13.06%], Genuine Parts[10.85%], American Airlines[7.91%], Southwest Airlines[6.57%], Morgan Stanley[5.34%], Charles Schwab[4.84%], Norwegian Cruise[4.7%], ProShares UltraPro[4.68%], Centene [4.64%], Humana [4.57%] Best S&P 500 Stocks Daily:
Genuine Parts[11.86%], United Airlines[4.46%], Capital One[4.24%], Discover Financial[3.95%], Fair Isaac[3.70%], UnitedHealth [3.67%], Marsh & McLennan[3.63%], Allstate [3.62%], Builders FirstSource[3.39%], Synchrony Financial[3.35%], D.R. Horton[3.31%]