
 Login Sign Up


| |||||
 |  | ||||

| 12Stocks.com Market Intelligence |
Best S&P 500 Stocks
|
On this page, you will find the most comprehensive analysis of S&P 500 stocks and ETFs - from latest trends to performances to charts ➞. First, here are the year-to-date (YTD) performances of the most requested S&P 500 stocks at 12Stocks.com (click stock for review):
| NVIDIA 61% | ||
| Caterpillar 23% | ||
| Merck 17% | ||
| Amazon.com 16% | ||
| Walmart 14% | ||
| Google 13% | ||
| JPMorgan Chase 13% | ||
| Goldman Sachs 10% | ||
| Chevron 9% | ||
| Microsoft 9% | ||
| Johnson & Johnson -5% | ||
| McDonald s -7% | ||
| Starbucks -8% | ||
| Apple -13% | ||
| Gilead -17% | ||
| Intel -31% | ||
| Boeing -37% | ||
| Quick: S&P 500 Stocks Lists: Performances & Trends, S&P 500 Stock Charts
Sort S&P 500 stocks: Daily, Weekly, Year-to-Date, Market Cap & Trends. Filter S&P 500 stocks list by sector: Show all, Tech, Finance, Energy, Staples, Retail, Industrial, Materials, Utilities and HealthCare |
| 12Stocks.com S&P 500 Stocks Performances & Trends Daily Report | |||||||||
|
| 
The overall Smart Investing & Trading Score is 58 (0-bearish to 100-bullish) which puts S&P 500 index in short term neutral trend. The Smart Investing & Trading Score from previous trading session is 51 and an improvement of trend continues. | ||||||||
Here are the Smart Investing & Trading Scores of the most requested S&P 500 stocks at 12Stocks.com (click stock name for detailed review):
|


| 12Stocks.com: Top Performing S&P 500 Index Stocks | ||||||||||||||||||||||||||||||||||||||||||||||||
 The top performing S&P 500 Index stocks year to date are
Now, more recently, over last week, the top performing S&P 500 Index stocks on the move are


|
||||||||||||||||||||||||||||||||||||||||||||||||
| 12Stocks.com: Investing in S&P 500 Index with Stocks | |
|
The following table helps investors and traders sort through current performance and trends (as measured by Smart Investing & Trading Score) of various
stocks in the S&P 500 Index. Quick View: Move mouse or cursor over stock symbol (ticker) to view short-term technical chart and over stock name to view long term chart. Click on  to add stock symbol to your watchlist and to add stock symbol to your watchlist and  to view watchlist. Click on any ticker or stock name for detailed market intelligence report for that stock. to view watchlist. Click on any ticker or stock name for detailed market intelligence report for that stock. |
12Stocks.com Performance of Stocks in S&P 500 Index
| Ticker | Stock Name | Watchlist | Category | Recent Price | Smart Investing & Trading Score | Change % | YTD Change% |
| UDR | UDR |   | Financials | 38.07 | 100 | 2.15 | -0.57% |
| MAR | Marriott | | Services & Goods | 244.39 | 58 | 1.96 | 8.37% |
| NRG | NRG | | Utilities | 72.89 | 76 | 1.95 | 40.98% |
| MNST | Monster Beverage | | Consumer Staples | 54.77 | 32 | 1.94 | -4.92% |
| NEM | Newmont | | Materials | 38.44 | 48 | 1.94 | -7.13% |
| AVB | AvalonBay Communities | | Financials | 192.18 | 100 | 1.86 | 2.65% |
| IR | Ingersoll Rand | | Industrials | 92.24 | 63 | 1.84 | 19.27% |
| ANET | Arista Networks | | Technology | 255.42 | 32 | 1.69 | 8.45% |
| ETN | Eaton | | Industrials | 318.11 | 75 | 1.68 | 32.09% |
| PKG | Packaging | | Consumer Staples | 173.50 | 43 | 1.53 | 6.50% |
| AES | AES | | Utilities | 17.38 | 85 | 1.46 | -9.71% |
| APTV | Aptiv | | Consumer Staples | 71.25 | 10 | 1.42 | -20.59% |
| OMC | Omnicom | | Services & Goods | 95.55 | 100 | 1.41 | 10.45% |
| RF | Regions Financial | | Financials | 19.62 | 75 | 1.40 | 1.24% |
| CPB | Campbell Soup | | Consumer Staples | 45.59 | 93 | 1.40 | 5.46% |
| INTC | Intel | | Technology | 34.76 | 42 | 1.40 | -30.83% |
| DTE | DTE | | Utilities | 111.65 | 93 | 1.39 | 1.26% |
| IPG | Interpublic | | Services & Goods | 31.41 | 67 | 1.36 | -3.77% |
| KO | Coca-Cola | | Consumer Staples | 61.46 | 100 | 1.35 | 4.29% |
| SWKS | Skyworks Solutions | | Technology | 100.64 | 42 | 1.35 | -10.48% |
| EXR | Extra Space | | Financials | 135.05 | 35 | 1.33 | -15.77% |
| USB | U.S. Bancorp | | Financials | 41.51 | 50 | 1.31 | -4.10% |
| HPQ | HP | | Technology | 28.02 | 17 | 1.28 | -6.86% |
| WMT | Walmart | | Services & Goods | 59.84 | 44 | 1.26 | 13.86% |
| APH | Amphenol | | Technology | 115.71 | 75 | 1.26 | 16.72% |
| For chart view version of above stock list: Chart View ➞ 0 - 25 , 25 - 50 , 50 - 75 , 75 - 100 , 100 - 125 , 125 - 150 , 150 - 175 , 175 - 200 , 200 - 225 , 225 - 250 , 250 - 275 , 275 - 300 , 300 - 325 , 325 - 350 , 350 - 375 , 375 - 400 , 400 - 425 , 425 - 450 , 450 - 475 , 475 - 500 | ||
 | Click To Change The Sort Order: By Market Cap or Company Size Performance: Year-to-date, Week and Day |  |
|
Get the most comprehensive stock market coverage daily at 12Stocks.com ➞ Best Stocks Today ➞ Best Stocks Weekly ➞ Best Stocks Year-to-Date ➞ Best Stocks Trends ➞  Best Stocks Today 12Stocks.com Best Nasdaq Stocks ➞ Best S&P 500 Stocks ➞ Best Tech Stocks ➞ Best Biotech Stocks ➞ |
| Detailed Overview of S&P 500 Stocks |
| S&P 500 Technical Overview, Leaders & Laggards, Top S&P 500 ETF Funds & Detailed S&P 500 Stocks List, Charts, Trends & More |
| S&P 500: Technical Analysis, Trends & YTD Performance | |
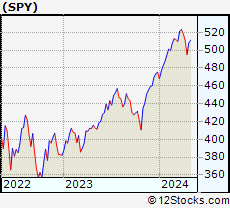
| S&P 500 index as represented by
SPY, an exchange-traded fund [ETF], holds basket of five hundred (mostly largecap) stocks from across all major sectors of the US stock market. The S&P 500 index (contains stocks like Apple and Exxon) is up by 6.24% and is currently outperforming the overall market by 0.75% year-to-date. Below is a quick view of technical charts and trends: | |
 SPY Weekly Chart |
|
| Long Term Trend: Good | |
| Medium Term Trend: Not Good | |
 SPY Daily Chart |
|
| Short Term Trend: Very Good | |
| Overall Trend Score: 58 | |
| YTD Performance: 6.24% | |
| **Trend Scores & Views Are Only For Educational Purposes And Not For Investing | |
| 12Stocks.com: Investing in S&P 500 Index using Exchange Traded Funds | |
|
The following table shows list of key exchange traded funds (ETF) that
help investors track S&P 500 index. The following list also includes leveraged ETF funds that track twice or thrice the daily returns of S&P 500 indices. Short or inverse ETF funds move in the opposite direction to the index they track and are useful during market pullbacks or during bear markets. Quick View: Move mouse or cursor over ETF symbol (ticker) to view short-term technical chart and over ETF name to view long term chart. Click on ticker or stock name for detailed view. Click on to add stock symbol to your watchlist and to view watchlist. |
12Stocks.com List of ETFs that track S&P 500 Index
| Ticker | ETF Name | Watchlist | Recent Price | Smart Investing & Trading Score | Change % | Week % | Year-to-date % |
| SPY | SPDR S&P 500 ETF | | 504.96 | 58 | -0.14 | 1.98 | 6.24% |
| IVV | iShares Core S&P 500 ETF | | 507.44 | 63 | -0.14 | 1.99 | 6.24% |
| VOO | Vanguard 500 ETF | | 464.13 | 63 | -0.15 | 1.99 | 6.26% |
| OEF | iShares S&P 100 | | 239.64 | 58 | -0.13 | 2.11 | 7.27% |
| SSO | ProShares Ultra S&P500 | | 71.84 | 58 | -0.28 | 3.95 | 10.4% |
| UPRO | ProShares UltraPro S&P500 | | 62.70 | 58 | -0.37 | 5.98 | 14.54% |
| SPXL | Direxion Daily S&P500 Bull 3X ETF | | 119.11 | 63 | -0.33 | 5.83 | 14.54% |
| SH | ProShares Short S&P500 | | 12.35 | 42 | 0.08 | -1.91 | -4.93% |
| SDS | ProShares UltraShort S&P500 | | 26.84 | 42 | 0.22 | -3.8 | -10.29% |
| SPXU | ProShares UltraPro Short S&P500 | | 36.17 | 42 | 0.51 | -5.62 | -15.87% |
| SPXS | Direxion Daily S&P 500 Bear 3X ETF | | 9.78 | 32 | 0.31 | -5.6 | -15.32% |
| 12Stocks.com: Charts, Trends, Fundamental Data and Performances of S&P 500 Stocks | |
|
We now take in-depth look at all S&P 500 stocks including charts, multi-period performances and overall trends (as measured by Smart Investing & Trading Score). One can sort S&P 500 stocks (click link to choose) by Daily, Weekly and by Year-to-Date performances. Also, one can sort by size of the company or by market capitalization. |
| Select Your Default Chart Type: | |||||
| |||||
| Click on stock symbol or name for detailed view. Click on to add stock symbol to your watchlist and to view watchlist. Quick View: Move mouse or cursor over "Daily" to quickly view daily technical stock chart and over "Weekly" to view weekly technical stock chart. | |||||

 | UDR UDR, Inc. |
| Sector: Financials | |
| SubSector: REIT - Residential | |
| MarketCap: 10180.1 Millions | |
| Recent Price: 38.07 Smart Investing & Trading Score: 100 | |
| Day Percent Change: 2.15% Day Change: 0.80 | |
| Week Change: 4.59% Year-to-date Change: -0.6% | |
| UDR Links: Profile News Message Board | |
| Charts:- Daily , Weekly | |
| Add UDR to Watchlist: View: Get UDR Trend Analysis ➞ | |
 | MAR Marriott International, Inc. |
| Sector: Services & Goods | |
| SubSector: Lodging | |
| MarketCap: 25831.6 Millions | |
| Recent Price: 244.39 Smart Investing & Trading Score: 58 | |
| Day Percent Change: 1.96% Day Change: 4.70 | |
| Week Change: 3.56% Year-to-date Change: 8.4% | |
| MAR Links: Profile News Message Board | |
| Charts:- Daily , Weekly | |
| Add MAR to Watchlist: View: Get MAR Trend Analysis ➞ | |
 | NRG NRG Energy, Inc. |
| Sector: Utilities | |
| SubSector: Diversified Utilities | |
| MarketCap: 6510.7 Millions | |
| Recent Price: 72.89 Smart Investing & Trading Score: 76 | |
| Day Percent Change: 1.95% Day Change: 1.40 | |
| Week Change: 4.17% Year-to-date Change: 41.0% | |
| NRG Links: Profile News Message Board | |
| Charts:- Daily , Weekly | |
| Add NRG to Watchlist: View: Get NRG Trend Analysis ➞ | |
 | MNST Monster Beverage Corporation |
| Sector: Consumer Staples | |
| SubSector: Beverages - Soft Drinks | |
| MarketCap: 30126.8 Millions | |
| Recent Price: 54.77 Smart Investing & Trading Score: 32 | |
| Day Percent Change: 1.94% Day Change: 1.05 | |
| Week Change: 3.08% Year-to-date Change: -4.9% | |
| MNST Links: Profile News Message Board | |
| Charts:- Daily , Weekly | |
| Add MNST to Watchlist: View: Get MNST Trend Analysis ➞ | |
 | NEM Newmont Corporation |
| Sector: Materials | |
| SubSector: Gold | |
| MarketCap: 33928.8 Millions | |
| Recent Price: 38.44 Smart Investing & Trading Score: 48 | |
| Day Percent Change: 1.94% Day Change: 0.73 | |
| Week Change: -1.49% Year-to-date Change: -7.1% | |
| NEM Links: Profile News Message Board | |
| Charts:- Daily , Weekly | |
| Add NEM to Watchlist: View: Get NEM Trend Analysis ➞ | |
 | AVB AvalonBay Communities, Inc. |
| Sector: Financials | |
| SubSector: REIT - Residential | |
| MarketCap: 19921.9 Millions | |
| Recent Price: 192.18 Smart Investing & Trading Score: 100 | |
| Day Percent Change: 1.86% Day Change: 3.52 | |
| Week Change: 4.37% Year-to-date Change: 2.7% | |
| AVB Links: Profile News Message Board | |
| Charts:- Daily , Weekly | |
| Add AVB to Watchlist: View: Get AVB Trend Analysis ➞ | |
 | IR Ingersoll Rand Inc. |
| Sector: Industrials | |
| SubSector: Diversified Machinery | |
| MarketCap: 8970.56 Millions | |
| Recent Price: 92.24 Smart Investing & Trading Score: 63 | |
| Day Percent Change: 1.84% Day Change: 1.67 | |
| Week Change: 4.34% Year-to-date Change: 19.3% | |
| IR Links: Profile News Message Board | |
| Charts:- Daily , Weekly | |
| Add IR to Watchlist: View: Get IR Trend Analysis ➞ | |
 | ANET Arista Networks, Inc. |
| Sector: Technology | |
| SubSector: Diversified Computer Systems | |
| MarketCap: 14071.2 Millions | |
| Recent Price: 255.42 Smart Investing & Trading Score: 32 | |
| Day Percent Change: 1.69% Day Change: 4.24 | |
| Week Change: 3.79% Year-to-date Change: 8.5% | |
| ANET Links: Profile News Message Board | |
| Charts:- Daily , Weekly | |
| Add ANET to Watchlist: View: Get ANET Trend Analysis ➞ | |
 | ETN Eaton Corporation plc |
| Sector: Industrials | |
| SubSector: Diversified Machinery | |
| MarketCap: 29829.4 Millions | |
| Recent Price: 318.11 Smart Investing & Trading Score: 75 | |
| Day Percent Change: 1.68% Day Change: 5.27 | |
| Week Change: 4.98% Year-to-date Change: 32.1% | |
| ETN Links: Profile News Message Board | |
| Charts:- Daily , Weekly | |
| Add ETN to Watchlist: View: Get ETN Trend Analysis ➞ | |
 | PKG Packaging Corporation of America |
| Sector: Consumer Staples | |
| SubSector: Packaging & Containers | |
| MarketCap: 8963 Millions | |
| Recent Price: 173.50 Smart Investing & Trading Score: 43 | |
| Day Percent Change: 1.53% Day Change: 2.62 | |
| Week Change: -3.55% Year-to-date Change: 6.5% | |
| PKG Links: Profile News Message Board | |
| Charts:- Daily , Weekly | |
| Add PKG to Watchlist: View: Get PKG Trend Analysis ➞ | |
 | AES The AES Corporation |
| Sector: Utilities | |
| SubSector: Electric Utilities | |
| MarketCap: 9173.44 Millions | |
| Recent Price: 17.38 Smart Investing & Trading Score: 85 | |
| Day Percent Change: 1.46% Day Change: 0.25 | |
| Week Change: 5.98% Year-to-date Change: -9.7% | |
| AES Links: Profile News Message Board | |
| Charts:- Daily , Weekly | |
| Add AES to Watchlist: View: Get AES Trend Analysis ➞ | |
 | APTV Aptiv PLC |
| Sector: Consumer Staples | |
| SubSector: Auto Parts | |
| MarketCap: 13047.9 Millions | |
| Recent Price: 71.25 Smart Investing & Trading Score: 10 | |
| Day Percent Change: 1.42% Day Change: 1.00 | |
| Week Change: 2.33% Year-to-date Change: -20.6% | |
| APTV Links: Profile News Message Board | |
| Charts:- Daily , Weekly | |
| Add APTV to Watchlist: View: Get APTV Trend Analysis ➞ | |
 | OMC Omnicom Group Inc. |
| Sector: Services & Goods | |
| SubSector: Advertising Agencies | |
| MarketCap: 11813.5 Millions | |
| Recent Price: 95.55 Smart Investing & Trading Score: 100 | |
| Day Percent Change: 1.41% Day Change: 1.33 | |
| Week Change: 3.16% Year-to-date Change: 10.5% | |
| OMC Links: Profile News Message Board | |
| Charts:- Daily , Weekly | |
| Add OMC to Watchlist: View: Get OMC Trend Analysis ➞ | |
 | RF Regions Financial Corporation |
| Sector: Financials | |
| SubSector: Regional - Southeast Banks | |
| MarketCap: 8936.25 Millions | |
| Recent Price: 19.62 Smart Investing & Trading Score: 75 | |
| Day Percent Change: 1.40% Day Change: 0.27 | |
| Week Change: 3.81% Year-to-date Change: 1.2% | |
| RF Links: Profile News Message Board | |
| Charts:- Daily , Weekly | |
| Add RF to Watchlist: View: Get RF Trend Analysis ➞ | |
 | CPB Campbell Soup Company |
| Sector: Consumer Staples | |
| SubSector: Processed & Packaged Goods | |
| MarketCap: 14468.8 Millions | |
| Recent Price: 45.59 Smart Investing & Trading Score: 93 | |
| Day Percent Change: 1.40% Day Change: 0.63 | |
| Week Change: 3.14% Year-to-date Change: 5.5% | |
| CPB Links: Profile News Message Board | |
| Charts:- Daily , Weekly | |
| Add CPB to Watchlist: View: Get CPB Trend Analysis ➞ | |
 | INTC Intel Corporation |
| Sector: Technology | |
| SubSector: Semiconductor - Broad Line | |
| MarketCap: 222357 Millions | |
| Recent Price: 34.76 Smart Investing & Trading Score: 42 | |
| Day Percent Change: 1.40% Day Change: 0.48 | |
| Week Change: 1.64% Year-to-date Change: -30.8% | |
| INTC Links: Profile News Message Board | |
| Charts:- Daily , Weekly | |
| Add INTC to Watchlist: View: Get INTC Trend Analysis ➞ | |
 | DTE DTE Energy Company |
| Sector: Utilities | |
| SubSector: Electric Utilities | |
| MarketCap: 18218.1 Millions | |
| Recent Price: 111.65 Smart Investing & Trading Score: 93 | |
| Day Percent Change: 1.39% Day Change: 1.53 | |
| Week Change: 2.84% Year-to-date Change: 1.3% | |
| DTE Links: Profile News Message Board | |
| Charts:- Daily , Weekly | |
| Add DTE to Watchlist: View: Get DTE Trend Analysis ➞ | |
 | IPG The Interpublic Group of Companies, Inc. |
| Sector: Services & Goods | |
| SubSector: Advertising Agencies | |
| MarketCap: 5730.55 Millions | |
| Recent Price: 31.41 Smart Investing & Trading Score: 67 | |
| Day Percent Change: 1.36% Day Change: 0.42 | |
| Week Change: 2.25% Year-to-date Change: -3.8% | |
| IPG Links: Profile News Message Board | |
| Charts:- Daily , Weekly | |
| Add IPG to Watchlist: View: Get IPG Trend Analysis ➞ | |
 | KO The Coca-Cola Company |
| Sector: Consumer Staples | |
| SubSector: Beverages - Soft Drinks | |
| MarketCap: 182046 Millions | |
| Recent Price: 61.46 Smart Investing & Trading Score: 100 | |
| Day Percent Change: 1.35% Day Change: 0.82 | |
| Week Change: 2.14% Year-to-date Change: 4.3% | |
| KO Links: Profile News Message Board | |
| Charts:- Daily , Weekly | |
| Add KO to Watchlist: View: Get KO Trend Analysis ➞ | |
 | SWKS Skyworks Solutions, Inc. |
| Sector: Technology | |
| SubSector: Semiconductor - Integrated Circuits | |
| MarketCap: 13981 Millions | |
| Recent Price: 100.64 Smart Investing & Trading Score: 42 | |
| Day Percent Change: 1.35% Day Change: 1.34 | |
| Week Change: 4.71% Year-to-date Change: -10.5% | |
| SWKS Links: Profile News Message Board | |
| Charts:- Daily , Weekly | |
| Add SWKS to Watchlist: View: Get SWKS Trend Analysis ➞ | |
 | EXR Extra Space Storage Inc. |
| Sector: Financials | |
| SubSector: REIT - Industrial | |
| MarketCap: 11203.9 Millions | |
| Recent Price: 135.05 Smart Investing & Trading Score: 35 | |
| Day Percent Change: 1.33% Day Change: 1.77 | |
| Week Change: 1.96% Year-to-date Change: -15.8% | |
| EXR Links: Profile News Message Board | |
| Charts:- Daily , Weekly | |
| Add EXR to Watchlist: View: Get EXR Trend Analysis ➞ | |
 | USB U.S. Bancorp |
| Sector: Financials | |
| SubSector: Regional - Midwest Banks | |
| MarketCap: 56757.8 Millions | |
| Recent Price: 41.51 Smart Investing & Trading Score: 50 | |
| Day Percent Change: 1.31% Day Change: 0.54 | |
| Week Change: 2.61% Year-to-date Change: -4.1% | |
| USB Links: Profile News Message Board | |
| Charts:- Daily , Weekly | |
| Add USB to Watchlist: View: Get USB Trend Analysis ➞ | |
 | HPQ HP Inc. |
| Sector: Technology | |
| SubSector: Diversified Computer Systems | |
| MarketCap: 22107.8 Millions | |
| Recent Price: 28.02 Smart Investing & Trading Score: 17 | |
| Day Percent Change: 1.28% Day Change: 0.35 | |
| Week Change: 0.77% Year-to-date Change: -6.9% | |
| HPQ Links: Profile News Message Board | |
| Charts:- Daily , Weekly | |
| Add HPQ to Watchlist: View: Get HPQ Trend Analysis ➞ | |
 | WMT Walmart Inc. |
| Sector: Services & Goods | |
| SubSector: Discount, Variety Stores | |
| MarketCap: 355610 Millions | |
| Recent Price: 59.84 Smart Investing & Trading Score: 44 | |
| Day Percent Change: 1.26% Day Change: 0.74 | |
| Week Change: 0.51% Year-to-date Change: 13.9% | |
| WMT Links: Profile News Message Board | |
| Charts:- Daily , Weekly | |
| Add WMT to Watchlist: View: Get WMT Trend Analysis ➞ | |
 | APH Amphenol Corporation |
| Sector: Technology | |
| SubSector: Diversified Electronics | |
| MarketCap: 23422 Millions | |
| Recent Price: 115.71 Smart Investing & Trading Score: 75 | |
| Day Percent Change: 1.26% Day Change: 1.44 | |
| Week Change: 5.02% Year-to-date Change: 16.7% | |
| APH Links: Profile News Message Board | |
| Charts:- Daily , Weekly | |
| Add APH to Watchlist: View: Get APH Trend Analysis ➞ | |
| For tabular summary view of above stock list: Summary View ➞ 0 - 25 , 25 - 50 , 50 - 75 , 75 - 100 , 100 - 125 , 125 - 150 , 150 - 175 , 175 - 200 , 200 - 225 , 225 - 250 , 250 - 275 , 275 - 300 , 300 - 325 , 325 - 350 , 350 - 375 , 375 - 400 , 400 - 425 , 425 - 450 , 450 - 475 , 475 - 500 | ||
| Click To Change The Sort Order: By Market Cap or Company Size Performance: Year-to-date, Week and Day | |
| Select Chart Type: | ||
|
Best Stocks Today 12Stocks.com |
© 2024 12Stocks.com Terms & Conditions Privacy Contact Us
All Information Provided Only For Education And Not To Be Used For Investing or Trading. See Terms & Conditions


One More Thing ... Get Best Stocks Delivered Daily!
Never Ever Miss A Move With Our Top Ten Stocks Lists
Find Best Stocks In Any Market - Bull or Bear Market
Take A Peek At Our Top Ten Stocks Lists: Daily, Weekly, Year-to-Date & Top Trends
Find Best Stocks In Any Market - Bull or Bear Market
Take A Peek At Our Top Ten Stocks Lists: Daily, Weekly, Year-to-Date & Top Trends
S&P 500 Stocks With Best Up Trends [0-bearish to 100-bullish]: Hasbro [100], Wabtec [100], Boston Scientific[100], Texas Instruments[100], Synchrony Financial[100], EQT [100], Microchip [100], Equity Residential[100], Analog Devices[100], Essex Property[100], UDR [100]
Best S&P 500 Stocks Year-to-Date:
NVIDIA [61.14%], Constellation [59.4%], NRG [40.98%], Meta Platforms[39.28%], Targa Resources[34.05%], Marathon [33.41%], Progressive [33.29%], Western Digital[32.14%], Eaton [32.09%], Diamondback [31.84%], Micron [30.09%] Best S&P 500 Stocks This Week:
Globe Life[23.01%], Hasbro [17.18%], Wabtec [13.26%], Microchip [9.78%], Tesla [9.57%], Texas Instruments[8.95%], CoStar [8.9%], Boston Scientific[8.76%], Kimberly-Clark [8.44%], Synchrony Financial[8.37%], NXP Semiconductors[8.29%] Best S&P 500 Stocks Daily:
Hasbro [11.39%], Tesla [11.36%], Wabtec [9.97%], CoStar [8.44%], Globe Life[8.37%], Boston Scientific[6.15%], ON Semiconductor[5.38%], Texas Instruments[5.14%], Synchrony Financial[5.11%], MSCI [5.03%], Hilton Worldwide[4.23%]