
 Login Sign Up


| |||||
 |  | ||||

| 12Stocks.com Market Intelligence |
Best S&P 500 Stocks
|
On this page, you will find the most comprehensive analysis of S&P 500 stocks and ETFs - from latest trends to performances to charts ➞. First, here are the year-to-date (YTD) performances of the most requested S&P 500 stocks at 12Stocks.com (click stock for review):
| NVIDIA 67% | ||
| Merck 20% | ||
| Walmart 15% | ||
| Caterpillar 14% | ||
| Amazon.com 14% | ||
| JPMorgan Chase 14% | ||
| Google 12% | ||
| Chevron 11% | ||
| Goldman Sachs 9% | ||
| Microsoft 6% | ||
| Johnson & Johnson -6% | ||
| McDonald s -7% | ||
| Starbucks -9% | ||
| Apple -12% | ||
| Gilead -19% | ||
| Intel -30% | ||
| Boeing -36% | ||
| Quick: S&P 500 Stocks Lists: Performances & Trends, S&P 500 Stock Charts
Sort S&P 500 stocks: Daily, Weekly, Year-to-Date, Market Cap & Trends. Filter S&P 500 stocks list by sector: Show all, Tech, Finance, Energy, Staples, Retail, Industrial, Materials, Utilities and HealthCare |
| 12Stocks.com S&P 500 Stocks Performances & Trends Daily Report | |||||||||
|
| 
The overall Smart Investing & Trading Score is 44 (0-bearish to 100-bullish) which puts S&P 500 index in short term neutral trend. The Smart Investing & Trading Score from previous trading session is 58 and hence a deterioration of trend. | ||||||||
Here are the Smart Investing & Trading Scores of the most requested S&P 500 stocks at 12Stocks.com (click stock name for detailed review):
|


| 12Stocks.com: Top Performing S&P 500 Index Stocks | ||||||||||||||||||||||||||||||||||||||||||||||||
 The top performing S&P 500 Index stocks year to date are
Now, more recently, over last week, the top performing S&P 500 Index stocks on the move are


|
||||||||||||||||||||||||||||||||||||||||||||||||
| 12Stocks.com: Investing in S&P 500 Index with Stocks | |
|
The following table helps investors and traders sort through current performance and trends (as measured by Smart Investing & Trading Score) of various
stocks in the S&P 500 Index. Quick View: Move mouse or cursor over stock symbol (ticker) to view short-term technical chart and over stock name to view long term chart. Click on  to add stock symbol to your watchlist and to add stock symbol to your watchlist and  to view watchlist. Click on any ticker or stock name for detailed market intelligence report for that stock. to view watchlist. Click on any ticker or stock name for detailed market intelligence report for that stock. |
12Stocks.com Performance of Stocks in S&P 500 Index
| Ticker | Stock Name | Watchlist | Category | Recent Price | Smart Investing & Trading Score | Change % | YTD Change% |
| IDXX | IDEXX |   | Health Care | 489.24 | 25 | -1.02 | -11.86% |
| SBUX | Starbucks | | Services & Goods | 87.84 | 52 | -1.03 | -8.51% |
| BEN | Franklin Resources | | Financials | 25.09 | 10 | -1.03 | -15.78% |
| FMC | FMC | | Materials | 57.80 | 53 | -1.03 | -8.33% |
| ALGN | Align | | Health Care | 310.50 | 75 | -1.05 | 13.32% |
| IT | Gartner | | Technology | 446.31 | 25 | -1.05 | -1.06% |
| BAC | Bank of America | | Financials | 37.91 | 76 | -1.07 | 12.59% |
| INCY | Incyte | | Health Care | 51.18 | 10 | -1.08 | -18.49% |
| C | Citi | | Financials | 61.79 | 76 | -1.09 | 20.12% |
| GWW | W.W. Grainger | | Services & Goods | 947.84 | 51 | -1.09 | 14.38% |
| LYB | LyondellBasell Industries | | Materials | 99.68 | 36 | -1.09 | 4.84% |
| FITB | Fifth Third | | Financials | 36.82 | 81 | -1.10 | 6.76% |
| CRM | salesforce.com | | Technology | 273.14 | 18 | -1.10 | 3.80% |
| WFC | Wells Fargo | | Financials | 59.93 | 58 | -1.11 | 21.76% |
| PNC | PNC Financial | | Financials | 156.30 | 71 | -1.11 | 0.94% |
| MET | MetLife | | Financials | 71.90 | 61 | -1.13 | 8.73% |
| CTSH | Cognizant | | Technology | 66.76 | 10 | -1.13 | -11.61% |
| CZR | Caesars Entertainment | | Services & Goods | 38.04 | 18 | -1.14 | -18.86% |
| PYPL | PayPal Holdings | | Financials | 64.10 | 61 | -1.14 | 4.38% |
| JNJ | Johnson & Johnson | | Health Care | 146.82 | 7 | -1.15 | -6.33% |
| JNPR | Juniper Networks | | Technology | 34.95 | 0 | -1.16 | 18.55% |
| ZBH | Zimmer Biomet | | Health Care | 119.75 | 30 | -1.17 | -1.60% |
| KVUE | Kenvue | | Consumer Staples | 19.02 | 27 | -1.17 | -11.37% |
| WBA | Walgreens Boots | | Services & Goods | 17.60 | 17 | -1.18 | -32.59% |
| IRM | Iron Mountain | | Technology | 77.26 | 70 | -1.19 | 10.40% |
| For chart view version of above stock list: Chart View ➞ 0 - 25 , 25 - 50 , 50 - 75 , 75 - 100 , 100 - 125 , 125 - 150 , 150 - 175 , 175 - 200 , 200 - 225 , 225 - 250 , 250 - 275 , 275 - 300 , 300 - 325 , 325 - 350 , 350 - 375 , 375 - 400 , 400 - 425 , 425 - 450 , 450 - 475 , 475 - 500 | ||
 | Click To Change The Sort Order: By Market Cap or Company Size Performance: Year-to-date, Week and Day |  |
|
Get the most comprehensive stock market coverage daily at 12Stocks.com ➞ Best Stocks Today ➞ Best Stocks Weekly ➞ Best Stocks Year-to-Date ➞ Best Stocks Trends ➞  Best Stocks Today 12Stocks.com Best Nasdaq Stocks ➞ Best S&P 500 Stocks ➞ Best Tech Stocks ➞ Best Biotech Stocks ➞ |
| Detailed Overview of S&P 500 Stocks |
| S&P 500 Technical Overview, Leaders & Laggards, Top S&P 500 ETF Funds & Detailed S&P 500 Stocks List, Charts, Trends & More |
| S&P 500: Technical Analysis, Trends & YTD Performance | |
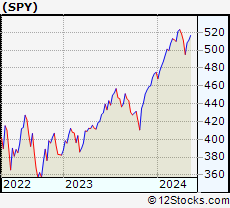
| S&P 500 index as represented by
SPY, an exchange-traded fund [ETF], holds basket of five hundred (mostly largecap) stocks from across all major sectors of the US stock market. The S&P 500 index (contains stocks like Apple and Exxon) is up by 5.93% and is currently outperforming the overall market by 0.77% year-to-date. Below is a quick view of technical charts and trends: | |
 SPY Weekly Chart |
|
| Long Term Trend: Good | |
| Medium Term Trend: Not Good | |
 SPY Daily Chart |
|
| Short Term Trend: Very Good | |
| Overall Trend Score: 44 | |
| YTD Performance: 5.93% | |
| **Trend Scores & Views Are Only For Educational Purposes And Not For Investing | |
| 12Stocks.com: Investing in S&P 500 Index using Exchange Traded Funds | |
|
The following table shows list of key exchange traded funds (ETF) that
help investors track S&P 500 index. The following list also includes leveraged ETF funds that track twice or thrice the daily returns of S&P 500 indices. Short or inverse ETF funds move in the opposite direction to the index they track and are useful during market pullbacks or during bear markets. Quick View: Move mouse or cursor over ETF symbol (ticker) to view short-term technical chart and over ETF name to view long term chart. Click on ticker or stock name for detailed view. Click on to add stock symbol to your watchlist and to view watchlist. |
12Stocks.com List of ETFs that track S&P 500 Index
| Ticker | ETF Name | Watchlist | Recent Price | Smart Investing & Trading Score | Change % | Week % | Year-to-date % |
| SPY | SPDR S&P 500 ETF | | 503.49 | 44 | -0.38 | 1.68 | 5.93% |
| IVV | iShares Core S&P 500 ETF | | 505.82 | 56 | -0.42 | 1.67 | 5.9% |
| VOO | Vanguard 500 ETF | | 462.58 | 56 | -0.41 | 1.64 | 5.9% |
| OEF | iShares S&P 100 | | 238.34 | 44 | -0.60 | 1.56 | 6.69% |
| SSO | ProShares Ultra S&P500 | | 71.32 | 51 | -0.88 | 3.2 | 9.61% |
| UPRO | ProShares UltraPro S&P500 | | 62.03 | 51 | -1.35 | 4.85 | 13.32% |
| SPXL | Direxion Daily S&P500 Bull 3X ETF | | 117.84 | 56 | -1.27 | 4.7 | 13.32% |
| SH | ProShares Short S&P500 | | 12.39 | 57 | 0.49 | -1.59 | -4.62% |
| SDS | ProShares UltraShort S&P500 | | 27.04 | 49 | 0.90 | -3.08 | -9.63% |
| SPXU | ProShares UltraPro Short S&P500 | | 36.52 | 49 | 1.33 | -4.72 | -15.07% |
| SPXS | Direxion Daily S&P 500 Bear 3X ETF | | 9.88 | 32 | 1.33 | -4.63 | -14.46% |
| 12Stocks.com: Charts, Trends, Fundamental Data and Performances of S&P 500 Stocks | |
|
We now take in-depth look at all S&P 500 stocks including charts, multi-period performances and overall trends (as measured by Smart Investing & Trading Score). One can sort S&P 500 stocks (click link to choose) by Daily, Weekly and by Year-to-Date performances. Also, one can sort by size of the company or by market capitalization. |
| Select Your Default Chart Type: | |||||
| |||||
| Click on stock symbol or name for detailed view. Click on to add stock symbol to your watchlist and to view watchlist. Quick View: Move mouse or cursor over "Daily" to quickly view daily technical stock chart and over "Weekly" to view weekly technical stock chart. | |||||

 | IDXX IDEXX Laboratories, Inc. |
| Sector: Health Care | |
| SubSector: Diagnostic Substances | |
| MarketCap: 15937.1 Millions | |
| Recent Price: 489.24 Smart Investing & Trading Score: 25 | |
| Day Percent Change: -1.02% Day Change: -5.02 | |
| Week Change: 2.71% Year-to-date Change: -11.9% | |
| IDXX Links: Profile News Message Board | |
| Charts:- Daily , Weekly | |
| Add IDXX to Watchlist: View: Get IDXX Trend Analysis ➞ | |
 | SBUX Starbucks Corporation |
| Sector: Services & Goods | |
| SubSector: Specialty Eateries | |
| MarketCap: 74909.7 Millions | |
| Recent Price: 87.84 Smart Investing & Trading Score: 52 | |
| Day Percent Change: -1.03% Day Change: -0.91 | |
| Week Change: 0.26% Year-to-date Change: -8.5% | |
| SBUX Links: Profile News Message Board | |
| Charts:- Daily , Weekly | |
| Add SBUX to Watchlist: View: Get SBUX Trend Analysis ➞ | |
 | BEN Franklin Resources, Inc. |
| Sector: Financials | |
| SubSector: Asset Management | |
| MarketCap: 9419.73 Millions | |
| Recent Price: 25.09 Smart Investing & Trading Score: 10 | |
| Day Percent Change: -1.03% Day Change: -0.26 | |
| Week Change: -0.24% Year-to-date Change: -15.8% | |
| BEN Links: Profile News Message Board | |
| Charts:- Daily , Weekly | |
| Add BEN to Watchlist: View: Get BEN Trend Analysis ➞ | |
 | FMC FMC Corporation |
| Sector: Materials | |
| SubSector: Chemicals - Major Diversified | |
| MarketCap: 9068.36 Millions | |
| Recent Price: 57.80 Smart Investing & Trading Score: 53 | |
| Day Percent Change: -1.03% Day Change: -0.60 | |
| Week Change: -0.03% Year-to-date Change: -8.3% | |
| FMC Links: Profile News Message Board | |
| Charts:- Daily , Weekly | |
| Add FMC to Watchlist: View: Get FMC Trend Analysis ➞ | |
 | ALGN Align Technology, Inc. |
| Sector: Health Care | |
| SubSector: Medical Appliances & Equipment | |
| MarketCap: 12802 Millions | |
| Recent Price: 310.50 Smart Investing & Trading Score: 75 | |
| Day Percent Change: -1.05% Day Change: -3.28 | |
| Week Change: 3.85% Year-to-date Change: 13.3% | |
| ALGN Links: Profile News Message Board | |
| Charts:- Daily , Weekly | |
| Add ALGN to Watchlist: View: Get ALGN Trend Analysis ➞ | |
 | IT Gartner, Inc. |
| Sector: Technology | |
| SubSector: Information Technology Services | |
| MarketCap: 7767.98 Millions | |
| Recent Price: 446.31 Smart Investing & Trading Score: 25 | |
| Day Percent Change: -1.05% Day Change: -4.75 | |
| Week Change: 1.35% Year-to-date Change: -1.1% | |
| IT Links: Profile News Message Board | |
| Charts:- Daily , Weekly | |
| Add IT to Watchlist: View: Get IT Trend Analysis ➞ | |
 | BAC Bank of America Corporation |
| Sector: Financials | |
| SubSector: Money Center Banks | |
| MarketCap: 189690 Millions | |
| Recent Price: 37.91 Smart Investing & Trading Score: 76 | |
| Day Percent Change: -1.07% Day Change: -0.41 | |
| Week Change: 2.54% Year-to-date Change: 12.6% | |
| BAC Links: Profile News Message Board | |
| Charts:- Daily , Weekly | |
| Add BAC to Watchlist: View: Get BAC Trend Analysis ➞ | |
 | INCY Incyte Corporation |
| Sector: Health Care | |
| SubSector: Biotechnology | |
| MarketCap: 15343.2 Millions | |
| Recent Price: 51.18 Smart Investing & Trading Score: 10 | |
| Day Percent Change: -1.08% Day Change: -0.56 | |
| Week Change: -2.23% Year-to-date Change: -18.5% | |
| INCY Links: Profile News Message Board | |
| Charts:- Daily , Weekly | |
| Add INCY to Watchlist: View: Get INCY Trend Analysis ➞ | |
 | C Citigroup Inc. |
| Sector: Financials | |
| SubSector: Money Center Banks | |
| MarketCap: 94128 Millions | |
| Recent Price: 61.79 Smart Investing & Trading Score: 76 | |
| Day Percent Change: -1.09% Day Change: -0.68 | |
| Week Change: 4.48% Year-to-date Change: 20.1% | |
| C Links: Profile News Message Board | |
| Charts:- Daily , Weekly | |
| Add C to Watchlist: View: Get C Trend Analysis ➞ | |
 | GWW W.W. Grainger, Inc. |
| Sector: Services & Goods | |
| SubSector: Industrial Equipment Wholesale | |
| MarketCap: 12794.8 Millions | |
| Recent Price: 947.84 Smart Investing & Trading Score: 51 | |
| Day Percent Change: -1.09% Day Change: -10.48 | |
| Week Change: 0.55% Year-to-date Change: 14.4% | |
| GWW Links: Profile News Message Board | |
| Charts:- Daily , Weekly | |
| Add GWW to Watchlist: View: Get GWW Trend Analysis ➞ | |
 | LYB LyondellBasell Industries N.V. |
| Sector: Materials | |
| SubSector: Specialty Chemicals | |
| MarketCap: 16420.7 Millions | |
| Recent Price: 99.68 Smart Investing & Trading Score: 36 | |
| Day Percent Change: -1.09% Day Change: -1.10 | |
| Week Change: -1.05% Year-to-date Change: 4.8% | |
| LYB Links: Profile News Message Board | |
| Charts:- Daily , Weekly | |
| Add LYB to Watchlist: View: Get LYB Trend Analysis ➞ | |
 | FITB Fifth Third Bancorp |
| Sector: Financials | |
| SubSector: Regional - Midwest Banks | |
| MarketCap: 10197 Millions | |
| Recent Price: 36.82 Smart Investing & Trading Score: 81 | |
| Day Percent Change: -1.10% Day Change: -0.41 | |
| Week Change: 1.57% Year-to-date Change: 6.8% | |
| FITB Links: Profile News Message Board | |
| Charts:- Daily , Weekly | |
| Add FITB to Watchlist: View: Get FITB Trend Analysis ➞ | |
 | CRM salesforce.com, inc. |
| Sector: Technology | |
| SubSector: Application Software | |
| MarketCap: 137120 Millions | |
| Recent Price: 273.14 Smart Investing & Trading Score: 18 | |
| Day Percent Change: -1.10% Day Change: -3.05 | |
| Week Change: 1.02% Year-to-date Change: 3.8% | |
| CRM Links: Profile News Message Board | |
| Charts:- Daily , Weekly | |
| Add CRM to Watchlist: View: Get CRM Trend Analysis ➞ | |
 | WFC Wells Fargo & Company |
| Sector: Financials | |
| SubSector: Money Center Banks | |
| MarketCap: 129138 Millions | |
| Recent Price: 59.93 Smart Investing & Trading Score: 58 | |
| Day Percent Change: -1.11% Day Change: -0.67 | |
| Week Change: -0.7% Year-to-date Change: 21.8% | |
| WFC Links: Profile News Message Board | |
| Charts:- Daily , Weekly | |
| Add WFC to Watchlist: View: Get WFC Trend Analysis ➞ | |
 | PNC The PNC Financial Services Group, Inc. |
| Sector: Financials | |
| SubSector: Money Center Banks | |
| MarketCap: 41291.5 Millions | |
| Recent Price: 156.30 Smart Investing & Trading Score: 71 | |
| Day Percent Change: -1.11% Day Change: -1.76 | |
| Week Change: 2.63% Year-to-date Change: 0.9% | |
| PNC Links: Profile News Message Board | |
| Charts:- Daily , Weekly | |
| Add PNC to Watchlist: View: Get PNC Trend Analysis ➞ | |
 | MET MetLife, Inc. |
| Sector: Financials | |
| SubSector: Life Insurance | |
| MarketCap: 26272.9 Millions | |
| Recent Price: 71.90 Smart Investing & Trading Score: 61 | |
| Day Percent Change: -1.13% Day Change: -0.82 | |
| Week Change: 1.11% Year-to-date Change: 8.7% | |
| MET Links: Profile News Message Board | |
| Charts:- Daily , Weekly | |
| Add MET to Watchlist: View: Get MET Trend Analysis ➞ | |
 | CTSH Cognizant Technology Solutions Corporation |
| Sector: Technology | |
| SubSector: Information Technology Services | |
| MarketCap: 26249.7 Millions | |
| Recent Price: 66.76 Smart Investing & Trading Score: 10 | |
| Day Percent Change: -1.13% Day Change: -0.76 | |
| Week Change: -1.01% Year-to-date Change: -11.6% | |
| CTSH Links: Profile News Message Board | |
| Charts:- Daily , Weekly | |
| Add CTSH to Watchlist: View: Get CTSH Trend Analysis ➞ | |
 | CZR Caesars Entertainment Corporation |
| Sector: Services & Goods | |
| SubSector: Resorts & Casinos | |
| MarketCap: 4618.44 Millions | |
| Recent Price: 38.04 Smart Investing & Trading Score: 18 | |
| Day Percent Change: -1.14% Day Change: -0.44 | |
| Week Change: -0.42% Year-to-date Change: -18.9% | |
| CZR Links: Profile News Message Board | |
| Charts:- Daily , Weekly | |
| Add CZR to Watchlist: View: Get CZR Trend Analysis ➞ | |
 | PYPL PayPal Holdings, Inc. |
| Sector: Financials | |
| SubSector: Credit Services | |
| MarketCap: 108949 Millions | |
| Recent Price: 64.10 Smart Investing & Trading Score: 61 | |
| Day Percent Change: -1.14% Day Change: -0.74 | |
| Week Change: 2.87% Year-to-date Change: 4.4% | |
| PYPL Links: Profile News Message Board | |
| Charts:- Daily , Weekly | |
| Add PYPL to Watchlist: View: Get PYPL Trend Analysis ➞ | |
 | JNJ Johnson & Johnson |
| Sector: Health Care | |
| SubSector: Drug Manufacturers - Major | |
| MarketCap: 331972 Millions | |
| Recent Price: 146.82 Smart Investing & Trading Score: 7 | |
| Day Percent Change: -1.15% Day Change: -1.71 | |
| Week Change: -0.74% Year-to-date Change: -6.3% | |
| JNJ Links: Profile News Message Board | |
| Charts:- Daily , Weekly | |
| Add JNJ to Watchlist: View: Get JNJ Trend Analysis ➞ | |
 | JNPR Juniper Networks, Inc. |
| Sector: Technology | |
| SubSector: Communication Equipment | |
| MarketCap: 6161.49 Millions | |
| Recent Price: 34.95 Smart Investing & Trading Score: 0 | |
| Day Percent Change: -1.16% Day Change: -0.41 | |
| Week Change: -3.08% Year-to-date Change: 18.6% | |
| JNPR Links: Profile News Message Board | |
| Charts:- Daily , Weekly | |
| Add JNPR to Watchlist: View: Get JNPR Trend Analysis ➞ | |
 | ZBH Zimmer Biomet Holdings, Inc. |
| Sector: Health Care | |
| SubSector: Medical Appliances & Equipment | |
| MarketCap: 19339.4 Millions | |
| Recent Price: 119.75 Smart Investing & Trading Score: 30 | |
| Day Percent Change: -1.17% Day Change: -1.42 | |
| Week Change: 0.27% Year-to-date Change: -1.6% | |
| ZBH Links: Profile News Message Board | |
| Charts:- Daily , Weekly | |
| Add ZBH to Watchlist: View: Get ZBH Trend Analysis ➞ | |
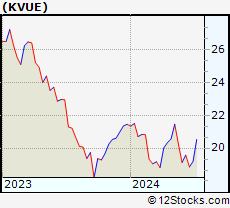 | KVUE Kenvue Inc. |
| Sector: Consumer Staples | |
| SubSector: Household & Personal Products | |
| MarketCap: 50220 Millions | |
| Recent Price: 19.02 Smart Investing & Trading Score: 27 | |
| Day Percent Change: -1.17% Day Change: -0.23 | |
| Week Change: -2.86% Year-to-date Change: -11.4% | |
| KVUE Links: Profile News Message Board | |
| Charts:- Daily , Weekly | |
| Add KVUE to Watchlist: View: Get KVUE Trend Analysis ➞ | |
 | WBA Walgreens Boots Alliance, Inc. |
| Sector: Services & Goods | |
| SubSector: Drug Stores | |
| MarketCap: 46184.1 Millions | |
| Recent Price: 17.60 Smart Investing & Trading Score: 17 | |
| Day Percent Change: -1.18% Day Change: -0.21 | |
| Week Change: -3.51% Year-to-date Change: -32.6% | |
| WBA Links: Profile News Message Board | |
| Charts:- Daily , Weekly | |
| Add WBA to Watchlist: View: Get WBA Trend Analysis ➞ | |
 | IRM Iron Mountain Incorporated |
| Sector: Technology | |
| SubSector: Business Software & Services | |
| MarketCap: 7339.18 Millions | |
| Recent Price: 77.26 Smart Investing & Trading Score: 70 | |
| Day Percent Change: -1.19% Day Change: -0.93 | |
| Week Change: 2.88% Year-to-date Change: 10.4% | |
| IRM Links: Profile News Message Board | |
| Charts:- Daily , Weekly | |
| Add IRM to Watchlist: View: Get IRM Trend Analysis ➞ | |
| For tabular summary view of above stock list: Summary View ➞ 0 - 25 , 25 - 50 , 50 - 75 , 75 - 100 , 100 - 125 , 125 - 150 , 150 - 175 , 175 - 200 , 200 - 225 , 225 - 250 , 250 - 275 , 275 - 300 , 300 - 325 , 325 - 350 , 350 - 375 , 375 - 400 , 400 - 425 , 425 - 450 , 450 - 475 , 475 - 500 | ||
| Click To Change The Sort Order: By Market Cap or Company Size Performance: Year-to-date, Week and Day | |
| Select Chart Type: | ||
|
Best Stocks Today 12Stocks.com |
© 2024 12Stocks.com Terms & Conditions Privacy Contact Us
All Information Provided Only For Education And Not To Be Used For Investing or Trading. See Terms & Conditions


One More Thing ... Get Best Stocks Delivered Daily!
Never Ever Miss A Move With Our Top Ten Stocks Lists
Find Best Stocks In Any Market - Bull or Bear Market
Take A Peek At Our Top Ten Stocks Lists: Daily, Weekly, Year-to-Date & Top Trends
Find Best Stocks In Any Market - Bull or Bear Market
Take A Peek At Our Top Ten Stocks Lists: Daily, Weekly, Year-to-Date & Top Trends
S&P 500 Stocks With Best Up Trends [0-bearish to 100-bullish]: Newmont [100], Teradyne [100], Chipotle Mexican[100], Dover [100], Merck [100], Northrop Grumman[100], Tractor Supply[100], EQT [100], Microchip [100], Hess [100], Altria [100]
Best S&P 500 Stocks Year-to-Date:
NVIDIA [66.86%], Constellation [60.54%], NRG [40.93%], Chipotle Mexican[36.07%], Targa Resources[35.47%], Marathon [34.48%], Diamondback [33.54%], Western Digital[32.59%], Progressive [31.89%], Eaton [31.68%], Micron [30.75%] Best S&P 500 Stocks This Week:
Hasbro [17.55%], Tesla [15.73%], Tyler Technologies[13.57%], Teradyne [13.48%], Wabtec [13.19%], Globe Life[13.19%], Microchip [12.89%], Monolithic Power[11.63%], Newmont [11.25%], NXP Semiconductors[10.67%], EQT [10.26%] Best S&P 500 Stocks Daily:
Newmont [12.46%], Tyler Technologies[9.32%], Teradyne [8.15%], Carrier Global[7.19%], Chipotle Mexican[6.33%], United Rentals[5.45%], Zebra Technologies[5.40%], Union Pacific[4.99%], Tesla [4.97%], Keurig Dr[4.73%], Dover [4.47%]