
 Login Sign Up


| |||||
 |  | ||||

| 12Stocks.com Market Intelligence |
Best S&P 500 Stocks
|
On this page, you will find the most comprehensive analysis of S&P 500 stocks and ETFs - from latest trends to performances to charts ➞. First, here are the year-to-date (YTD) performances of the most requested S&P 500 stocks at 12Stocks.com (click stock for review):
| NVIDIA 74% | ||
| Merck 19% | ||
| Google 17% | ||
| Amazon.com 15% | ||
| Caterpillar 13% | ||
| Walmart 13% | ||
| JPMorgan Chase 13% | ||
| Goldman Sachs 11% | ||
| Chevron 8% | ||
| Microsoft 4% | ||
| Johnson & Johnson -8% | ||
| Starbucks -8% | ||
| McDonald s -8% | ||
| Apple -12% | ||
| Gilead -20% | ||
| Boeing -36% | ||
| Intel -39% | ||
| Quick: S&P 500 Stocks Lists: Performances & Trends, S&P 500 Stock Charts
Sort S&P 500 stocks: Daily, Weekly, Year-to-Date, Market Cap & Trends. Filter S&P 500 stocks list by sector: Show all, Tech, Finance, Energy, Staples, Retail, Industrial, Materials, Utilities and HealthCare |
| 12Stocks.com S&P 500 Stocks Performances & Trends Daily Report | |||||||||
|
| 
The overall Smart Investing & Trading Score is 41 (0-bearish to 100-bullish) which puts S&P 500 index in short term neutral trend. The Smart Investing & Trading Score from previous trading session is 78 and hence a deterioration of trend. | ||||||||
Here are the Smart Investing & Trading Scores of the most requested S&P 500 stocks at 12Stocks.com (click stock name for detailed review):
|


| 12Stocks.com: Top Performing S&P 500 Index Stocks | ||||||||||||||||||||||||||||||||||||||||||||||||
 The top performing S&P 500 Index stocks year to date are
Now, more recently, over last week, the top performing S&P 500 Index stocks on the move are


|
||||||||||||||||||||||||||||||||||||||||||||||||
| 12Stocks.com: Investing in S&P 500 Index with Stocks | |
|
The following table helps investors and traders sort through current performance and trends (as measured by Smart Investing & Trading Score) of various
stocks in the S&P 500 Index. Quick View: Move mouse or cursor over stock symbol (ticker) to view short-term technical chart and over stock name to view long term chart. Click on  to add stock symbol to your watchlist and to add stock symbol to your watchlist and  to view watchlist. Click on any ticker or stock name for detailed market intelligence report for that stock. to view watchlist. Click on any ticker or stock name for detailed market intelligence report for that stock. |
12Stocks.com Performance of Stocks in S&P 500 Index
| Ticker | Stock Name | Watchlist | Category | Recent Price | Smart Investing & Trading Score | Change % | YTD Change% |
| ADSK | Autodesk |   | Technology | 212.85 | 10 | -1.81 | -12.58% |
| BKR | Baker Hughes | | Services & Goods | 32.62 | 36 | -1.81 | -4.56% |
| A | Agilent Technologies | | Health Care | 137.04 | 54 | -1.83 | -1.43% |
| AAPL | Apple | | Technology | 170.33 | 30 | -1.83 | -11.53% |
| DD | DuPont de | | Materials | 72.50 | 36 | -1.89 | -5.76% |
| CMCSA | Comcast | | Services & Goods | 38.11 | 8 | -1.90 | -13.09% |
| NKE | NIKE | | Consumer Staples | 92.26 | 18 | -1.91 | -15.02% |
| WAT | Waters | | Health Care | 309.04 | 18 | -1.92 | -6.13% |
| POOL | Pool | | Consumer Staples | 362.53 | 0 | -1.92 | -9.07% |
| GOOG | | Technology | 164.64 | 78 | -1.94 | 16.82% | |
| WM | Waste Management | | Industrials | 208.02 | 58 | -1.95 | 16.15% |
| CARR | Carrier Global | | Industrials | 61.49 | 100 | -1.95 | 7.03% |
| AMT | American Tower | | Financials | 171.56 | 27 | -1.96 | -20.53% |
| MKTX | MarketAxess Holdings | | Financials | 200.09 | 28 | -1.96 | -31.67% |
| TFC | Truist Financial | | Financials | 37.55 | 51 | -1.96 | 1.71% |
| QCOM | QUALCOMM | | Technology | 165.85 | 75 | -1.98 | 14.67% |
| KMX | CarMax | | Services & Goods | 67.97 | 10 | -1.99 | -11.43% |
| FMC | FMC | | Materials | 59.01 | 90 | -1.99 | -6.41% |
| INTU | Intuit | | Technology | 625.62 | 32 | -2.00 | 0.09% |
| IVZ | Invesco | | Financials | 14.17 | 10 | -2.01 | -20.57% |
| IQV | IQVIA Holdings | | Health Care | 231.77 | 31 | -2.01 | 0.17% |
| TECH | Bio-Techne | | Health Care | 63.21 | 42 | -2.02 | -18.08% |
| RF | Regions Financial | | Financials | 19.27 | 51 | -2.03 | -0.57% |
| STT | State Street | | Financials | 72.49 | 0 | -2.03 | -6.42% |
| MTD | Mettler-Toledo | | Health Care | 1229.70 | 61 | -2.03 | 1.38% |
| For chart view version of above stock list: Chart View ➞ 0 - 25 , 25 - 50 , 50 - 75 , 75 - 100 , 100 - 125 , 125 - 150 , 150 - 175 , 175 - 200 , 200 - 225 , 225 - 250 , 250 - 275 , 275 - 300 , 300 - 325 , 325 - 350 , 350 - 375 , 375 - 400 , 400 - 425 , 425 - 450 , 450 - 475 , 475 - 500 | ||
 | Click To Change The Sort Order: By Market Cap or Company Size Performance: Year-to-date, Week and Day |  |
|
Get the most comprehensive stock market coverage daily at 12Stocks.com ➞ Best Stocks Today ➞ Best Stocks Weekly ➞ Best Stocks Year-to-Date ➞ Best Stocks Trends ➞  Best Stocks Today 12Stocks.com Best Nasdaq Stocks ➞ Best S&P 500 Stocks ➞ Best Tech Stocks ➞ Best Biotech Stocks ➞ |
| Detailed Overview of S&P 500 Stocks |
| S&P 500 Technical Overview, Leaders & Laggards, Top S&P 500 ETF Funds & Detailed S&P 500 Stocks List, Charts, Trends & More |
| S&P 500: Technical Analysis, Trends & YTD Performance | |
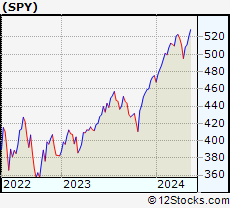
| S&P 500 index as represented by
SPY, an exchange-traded fund [ETF], holds basket of five hundred (mostly largecap) stocks from across all major sectors of the US stock market. The S&P 500 index (contains stocks like Apple and Exxon) is up by 5.61% and is currently outperforming the overall market by 0.81% year-to-date. Below is a quick view of technical charts and trends: | |
 SPY Weekly Chart |
|
| Long Term Trend: Good | |
| Medium Term Trend: Not Good | |
 SPY Daily Chart |
|
| Short Term Trend: Not Good | |
| Overall Trend Score: 41 | |
| YTD Performance: 5.61% | |
| **Trend Scores & Views Are Only For Educational Purposes And Not For Investing | |
| 12Stocks.com: Investing in S&P 500 Index using Exchange Traded Funds | |
|
The following table shows list of key exchange traded funds (ETF) that
help investors track S&P 500 index. The following list also includes leveraged ETF funds that track twice or thrice the daily returns of S&P 500 indices. Short or inverse ETF funds move in the opposite direction to the index they track and are useful during market pullbacks or during bear markets. Quick View: Move mouse or cursor over ETF symbol (ticker) to view short-term technical chart and over ETF name to view long term chart. Click on ticker or stock name for detailed view. Click on to add stock symbol to your watchlist and to view watchlist. |
12Stocks.com List of ETFs that track S&P 500 Index
| Ticker | ETF Name | Watchlist | Recent Price | Smart Investing & Trading Score | Change % | Week % | Year-to-date % |
| SPY | SPDR S&P 500 ETF | | 501.98 | 41 | -1.58 | -1.24 | 5.61% |
| IVV | iShares Core S&P 500 ETF | | 504.44 | 41 | -1.59 | -1.24 | 5.61% |
| VOO | Vanguard 500 ETF | | 461.43 | 41 | -1.58 | -1.24 | 5.64% |
| OEF | iShares S&P 100 | | 238.44 | 41 | -1.51 | -1.29 | 6.74% |
| SSO | ProShares Ultra S&P500 | | 70.87 | 41 | -3.17 | -2.53 | 8.91% |
| UPRO | ProShares UltraPro S&P500 | | 61.40 | 33 | -4.72 | -3.79 | 12.17% |
| SPXL | Direxion Daily S&P500 Bull 3X ETF | | 116.62 | 33 | -4.69 | -3.73 | 12.15% |
| SH | ProShares Short S&P500 | | 12.43 | 60 | 1.47 | 1.22 | -4.31% |
| SDS | ProShares UltraShort S&P500 | | 27.20 | 60 | 3.19 | 2.53 | -9.09% |
| SPXU | ProShares UltraPro Short S&P500 | | 36.85 | 67 | 4.78 | 3.8 | -14.3% |
| SPXS | Direxion Daily S&P 500 Bear 3X ETF | | 9.96 | 62 | 4.62 | 3.64 | -13.77% |
| 12Stocks.com: Charts, Trends, Fundamental Data and Performances of S&P 500 Stocks | |
|
We now take in-depth look at all S&P 500 stocks including charts, multi-period performances and overall trends (as measured by Smart Investing & Trading Score). One can sort S&P 500 stocks (click link to choose) by Daily, Weekly and by Year-to-Date performances. Also, one can sort by size of the company or by market capitalization. |
| Select Your Default Chart Type: | |||||
| |||||
| Click on stock symbol or name for detailed view. Click on to add stock symbol to your watchlist and to view watchlist. Quick View: Move mouse or cursor over "Daily" to quickly view daily technical stock chart and over "Weekly" to view weekly technical stock chart. | |||||

 | ADSK Autodesk, Inc. |
| Sector: Technology | |
| SubSector: Technical & System Software | |
| MarketCap: 36975.8 Millions | |
| Recent Price: 212.85 Smart Investing & Trading Score: 10 | |
| Day Percent Change: -1.81% Day Change: -3.93 | |
| Week Change: -2.33% Year-to-date Change: -12.6% | |
| ADSK Links: Profile News Message Board | |
| Charts:- Daily , Weekly | |
| Add ADSK to Watchlist: View: Get ADSK Trend Analysis ➞ | |
 | BKR Baker Hughes Company |
| Sector: Services & Goods | |
| SubSector: Technical Services | |
| MarketCap: 1330 Millions | |
| Recent Price: 32.62 Smart Investing & Trading Score: 36 | |
| Day Percent Change: -1.81% Day Change: -0.60 | |
| Week Change: -0.67% Year-to-date Change: -4.6% | |
| BKR Links: Profile News Message Board | |
| Charts:- Daily , Weekly | |
| Add BKR to Watchlist: View: Get BKR Trend Analysis ➞ | |
 | A Agilent Technologies, Inc. |
| Sector: Health Care | |
| SubSector: Medical Laboratories & Research | |
| MarketCap: 22337.9 Millions | |
| Recent Price: 137.04 Smart Investing & Trading Score: 54 | |
| Day Percent Change: -1.83% Day Change: -2.55 | |
| Week Change: -0.51% Year-to-date Change: -1.4% | |
| A Links: Profile News Message Board | |
| Charts:- Daily , Weekly | |
| Add A to Watchlist: View: Get A Trend Analysis ➞ | |
 | AAPL Apple Inc. |
| Sector: Technology | |
| SubSector: Electronic Equipment | |
| MarketCap: 1112940 Millions | |
| Recent Price: 170.33 Smart Investing & Trading Score: 30 | |
| Day Percent Change: -1.83% Day Change: -3.17 | |
| Week Change: 0.61% Year-to-date Change: -11.5% | |
| AAPL Links: Profile News Message Board | |
| Charts:- Daily , Weekly | |
| Add AAPL to Watchlist: View: Get AAPL Trend Analysis ➞ | |
 | DD DuPont de Nemours, Inc. |
| Sector: Materials | |
| SubSector: Agricultural Chemicals | |
| MarketCap: 25631.6 Millions | |
| Recent Price: 72.50 Smart Investing & Trading Score: 36 | |
| Day Percent Change: -1.89% Day Change: -1.40 | |
| Week Change: -1.64% Year-to-date Change: -5.8% | |
| DD Links: Profile News Message Board | |
| Charts:- Daily , Weekly | |
| Add DD to Watchlist: View: Get DD Trend Analysis ➞ | |
 | CMCSA Comcast Corporation |
| Sector: Services & Goods | |
| SubSector: Entertainment - Diversified | |
| MarketCap: 164849 Millions | |
| Recent Price: 38.11 Smart Investing & Trading Score: 8 | |
| Day Percent Change: -1.90% Day Change: -0.74 | |
| Week Change: -1.19% Year-to-date Change: -13.1% | |
| CMCSA Links: Profile News Message Board | |
| Charts:- Daily , Weekly | |
| Add CMCSA to Watchlist: View: Get CMCSA Trend Analysis ➞ | |
 | NKE NIKE, Inc. |
| Sector: Consumer Staples | |
| SubSector: Textile - Apparel Footwear & Accessories | |
| MarketCap: 118918 Millions | |
| Recent Price: 92.26 Smart Investing & Trading Score: 18 | |
| Day Percent Change: -1.91% Day Change: -1.80 | |
| Week Change: -1.98% Year-to-date Change: -15.0% | |
| NKE Links: Profile News Message Board | |
| Charts:- Daily , Weekly | |
| Add NKE to Watchlist: View: Get NKE Trend Analysis ➞ | |
 | WAT Waters Corporation |
| Sector: Health Care | |
| SubSector: Medical Instruments & Supplies | |
| MarketCap: 11882 Millions | |
| Recent Price: 309.04 Smart Investing & Trading Score: 18 | |
| Day Percent Change: -1.92% Day Change: -6.05 | |
| Week Change: -0.73% Year-to-date Change: -6.1% | |
| WAT Links: Profile News Message Board | |
| Charts:- Daily , Weekly | |
| Add WAT to Watchlist: View: Get WAT Trend Analysis ➞ | |
 | POOL Pool Corporation |
| Sector: Consumer Staples | |
| SubSector: Sporting Goods | |
| MarketCap: 7479.64 Millions | |
| Recent Price: 362.53 Smart Investing & Trading Score: 0 | |
| Day Percent Change: -1.92% Day Change: -7.08 | |
| Week Change: -2.33% Year-to-date Change: -9.1% | |
| POOL Links: Profile News Message Board | |
| Charts:- Daily , Weekly | |
| Add POOL to Watchlist: View: Get POOL Trend Analysis ➞ | |
 | GOOG Alphabet Inc. |
| Sector: Technology | |
| SubSector: Internet Information Providers | |
| MarketCap: 730159 Millions | |
| Recent Price: 164.64 Smart Investing & Trading Score: 78 | |
| Day Percent Change: -1.94% Day Change: -3.26 | |
| Week Change: -5.21% Year-to-date Change: 16.8% | |
| GOOG Links: Profile News Message Board | |
| Charts:- Daily , Weekly | |
| Add GOOG to Watchlist: View: Get GOOG Trend Analysis ➞ | |
 | WM Waste Management, Inc. |
| Sector: Industrials | |
| SubSector: Waste Management | |
| MarketCap: 46977.4 Millions | |
| Recent Price: 208.02 Smart Investing & Trading Score: 58 | |
| Day Percent Change: -1.95% Day Change: -4.13 | |
| Week Change: -0.99% Year-to-date Change: 16.2% | |
| WM Links: Profile News Message Board | |
| Charts:- Daily , Weekly | |
| Add WM to Watchlist: View: Get WM Trend Analysis ➞ | |
 | CARR Carrier Global Corporation |
| Sector: Industrials | |
| SubSector: Building Products & Equipment | |
| MarketCap: 32547 Millions | |
| Recent Price: 61.49 Smart Investing & Trading Score: 100 | |
| Day Percent Change: -1.95% Day Change: -1.22 | |
| Week Change: 1.64% Year-to-date Change: 7.0% | |
| CARR Links: Profile News Message Board | |
| Charts:- Daily , Weekly | |
| Add CARR to Watchlist: View: Get CARR Trend Analysis ➞ | |
 | AMT American Tower Corporation (REIT) |
| Sector: Financials | |
| SubSector: REIT - Diversified | |
| MarketCap: 92527 Millions | |
| Recent Price: 171.56 Smart Investing & Trading Score: 27 | |
| Day Percent Change: -1.96% Day Change: -3.43 | |
| Week Change: -0.08% Year-to-date Change: -20.5% | |
| AMT Links: Profile News Message Board | |
| Charts:- Daily , Weekly | |
| Add AMT to Watchlist: View: Get AMT Trend Analysis ➞ | |
 | MKTX MarketAxess Holdings Inc. |
| Sector: Financials | |
| SubSector: Investment Brokerage - National | |
| MarketCap: 12431.5 Millions | |
| Recent Price: 200.09 Smart Investing & Trading Score: 28 | |
| Day Percent Change: -1.96% Day Change: -4.01 | |
| Week Change: -0.84% Year-to-date Change: -31.7% | |
| MKTX Links: Profile News Message Board | |
| Charts:- Daily , Weekly | |
| Add MKTX to Watchlist: View: Get MKTX Trend Analysis ➞ | |
 | TFC Truist Financial Corporation |
| Sector: Financials | |
| SubSector: Regional - Southeast Banks | |
| MarketCap: 44928.5 Millions | |
| Recent Price: 37.55 Smart Investing & Trading Score: 51 | |
| Day Percent Change: -1.96% Day Change: -0.75 | |
| Week Change: -1.62% Year-to-date Change: 1.7% | |
| TFC Links: Profile News Message Board | |
| Charts:- Daily , Weekly | |
| Add TFC to Watchlist: View: Get TFC Trend Analysis ➞ | |
 | QCOM QUALCOMM Incorporated |
| Sector: Technology | |
| SubSector: Communication Equipment | |
| MarketCap: 77517.7 Millions | |
| Recent Price: 165.85 Smart Investing & Trading Score: 75 | |
| Day Percent Change: -1.98% Day Change: -3.35 | |
| Week Change: 0.11% Year-to-date Change: 14.7% | |
| QCOM Links: Profile News Message Board | |
| Charts:- Daily , Weekly | |
| Add QCOM to Watchlist: View: Get QCOM Trend Analysis ➞ | |
 | KMX CarMax, Inc. |
| Sector: Services & Goods | |
| SubSector: Auto Dealerships | |
| MarketCap: 8121.71 Millions | |
| Recent Price: 67.97 Smart Investing & Trading Score: 10 | |
| Day Percent Change: -1.99% Day Change: -1.38 | |
| Week Change: -2.33% Year-to-date Change: -11.4% | |
| KMX Links: Profile News Message Board | |
| Charts:- Daily , Weekly | |
| Add KMX to Watchlist: View: Get KMX Trend Analysis ➞ | |
 | FMC FMC Corporation |
| Sector: Materials | |
| SubSector: Chemicals - Major Diversified | |
| MarketCap: 9068.36 Millions | |
| Recent Price: 59.01 Smart Investing & Trading Score: 90 | |
| Day Percent Change: -1.99% Day Change: -1.20 | |
| Week Change: 0.94% Year-to-date Change: -6.4% | |
| FMC Links: Profile News Message Board | |
| Charts:- Daily , Weekly | |
| Add FMC to Watchlist: View: Get FMC Trend Analysis ➞ | |
 | INTU Intuit Inc. |
| Sector: Technology | |
| SubSector: Application Software | |
| MarketCap: 577035 Millions | |
| Recent Price: 625.62 Smart Investing & Trading Score: 32 | |
| Day Percent Change: -2.00% Day Change: -12.77 | |
| Week Change: -1.72% Year-to-date Change: 0.1% | |
| INTU Links: Profile News Message Board | |
| Charts:- Daily , Weekly | |
| Add INTU to Watchlist: View: Get INTU Trend Analysis ➞ | |
 | IVZ Invesco Ltd. |
| Sector: Financials | |
| SubSector: Asset Management | |
| MarketCap: 4578.23 Millions | |
| Recent Price: 14.17 Smart Investing & Trading Score: 10 | |
| Day Percent Change: -2.01% Day Change: -0.29 | |
| Week Change: -3.41% Year-to-date Change: -20.6% | |
| IVZ Links: Profile News Message Board | |
| Charts:- Daily , Weekly | |
| Add IVZ to Watchlist: View: Get IVZ Trend Analysis ➞ | |
 | IQV IQVIA Holdings Inc. |
| Sector: Health Care | |
| SubSector: Medical Laboratories & Research | |
| MarketCap: 19616.5 Millions | |
| Recent Price: 231.77 Smart Investing & Trading Score: 31 | |
| Day Percent Change: -2.01% Day Change: -4.76 | |
| Week Change: -1.32% Year-to-date Change: 0.2% | |
| IQV Links: Profile News Message Board | |
| Charts:- Daily , Weekly | |
| Add IQV to Watchlist: View: Get IQV Trend Analysis ➞ | |
 | TECH Bio-Techne Corporation |
| Sector: Health Care | |
| SubSector: Biotechnology | |
| MarketCap: 6958.05 Millions | |
| Recent Price: 63.21 Smart Investing & Trading Score: 42 | |
| Day Percent Change: -2.02% Day Change: -1.30 | |
| Week Change: -1.33% Year-to-date Change: -18.1% | |
| TECH Links: Profile News Message Board | |
| Charts:- Daily , Weekly | |
| Add TECH to Watchlist: View: Get TECH Trend Analysis ➞ | |
 | RF Regions Financial Corporation |
| Sector: Financials | |
| SubSector: Regional - Southeast Banks | |
| MarketCap: 8936.25 Millions | |
| Recent Price: 19.27 Smart Investing & Trading Score: 51 | |
| Day Percent Change: -2.03% Day Change: -0.40 | |
| Week Change: -1.78% Year-to-date Change: -0.6% | |
| RF Links: Profile News Message Board | |
| Charts:- Daily , Weekly | |
| Add RF to Watchlist: View: Get RF Trend Analysis ➞ | |
 | STT State Street Corporation |
| Sector: Financials | |
| SubSector: Asset Management | |
| MarketCap: 18623 Millions | |
| Recent Price: 72.49 Smart Investing & Trading Score: 0 | |
| Day Percent Change: -2.03% Day Change: -1.50 | |
| Week Change: -1.23% Year-to-date Change: -6.4% | |
| STT Links: Profile News Message Board | |
| Charts:- Daily , Weekly | |
| Add STT to Watchlist: View: Get STT Trend Analysis ➞ | |
 | MTD Mettler-Toledo International Inc. |
| Sector: Health Care | |
| SubSector: Medical Instruments & Supplies | |
| MarketCap: 15973.1 Millions | |
| Recent Price: 1229.70 Smart Investing & Trading Score: 61 | |
| Day Percent Change: -2.03% Day Change: -25.54 | |
| Week Change: -0.68% Year-to-date Change: 1.4% | |
| MTD Links: Profile News Message Board | |
| Charts:- Daily , Weekly | |
| Add MTD to Watchlist: View: Get MTD Trend Analysis ➞ | |
| For tabular summary view of above stock list: Summary View ➞ 0 - 25 , 25 - 50 , 50 - 75 , 75 - 100 , 100 - 125 , 125 - 150 , 150 - 175 , 175 - 200 , 200 - 225 , 225 - 250 , 250 - 275 , 275 - 300 , 300 - 325 , 325 - 350 , 350 - 375 , 375 - 400 , 400 - 425 , 425 - 450 , 450 - 475 , 475 - 500 | ||
| Click To Change The Sort Order: By Market Cap or Company Size Performance: Year-to-date, Week and Day | |
| Select Chart Type: | ||
|
Best Stocks Today 12Stocks.com |
© 2024 12Stocks.com Terms & Conditions Privacy Contact Us
All Information Provided Only For Education And Not To Be Used For Investing or Trading. See Terms & Conditions


One More Thing ... Get Best Stocks Delivered Daily!
Never Ever Miss A Move With Our Top Ten Stocks Lists
Find Best Stocks In Any Market - Bull or Bear Market
Take A Peek At Our Top Ten Stocks Lists: Daily, Weekly, Year-to-Date & Top Trends
Find Best Stocks In Any Market - Bull or Bear Market
Take A Peek At Our Top Ten Stocks Lists: Daily, Weekly, Year-to-Date & Top Trends
S&P 500 Stocks With Best Up Trends [0-bearish to 100-bullish]: Leidos Holdings[100], Corning [100], Zebra Technologies[100], 3M [100], NXP Semiconductors[100], Mosaic [100], Colgate-Palmolive [100], PayPal Holdings[100], Federal Realty[100], Public Service[100], DaVita [100]
Best S&P 500 Stocks Year-to-Date:
NVIDIA [74.47%], Constellation [58.77%], NRG [40.56%], Chipotle Mexican[38.16%], Western Digital[35.25%], Eli Lilly[34%], DaVita [32.69%], Micron [32.36%], Eaton [32.16%], Targa Resources[31.3%], Progressive [30.74%] Best S&P 500 Stocks This Week:
Tesla [8.91%], Leidos Holdings[7.56%], Corning [6.54%], Eli Lilly[6.49%], Domino s[6.05%], Zebra Technologies[5.84%], NXP Semiconductors[5.56%], 3M [5.1%], Cincinnati Financial[4.34%], Hershey [4.17%], DaVita [4.12%] Best S&P 500 Stocks Daily:
Leidos Holdings[6.53%], Eli Lilly[5.95%], Corning [5.03%], Zebra Technologies[4.85%], ProShares UltraPro[4.78%], 3M [4.72%], NXP Semiconductors[3.67%], Arch Capital[2.51%], Ecolab [2.02%], Cincinnati Financial[1.88%], Campbell Soup[1.74%]