
 Login Sign Up


| |||||
 |  | ||||

| 12Stocks.com Market Intelligence |
Best S&P 500 Stocks
|
On this page, you will find the most comprehensive analysis of S&P 500 stocks and ETFs - from latest trends to performances to charts ➞. First, here are the year-to-date (YTD) performances of the most requested S&P 500 stocks at 12Stocks.com (click stock for review):
| NVIDIA 66% | ||
| Caterpillar 22% | ||
| Amazon.com 17% | ||
| Merck 16% | ||
| Google 13% | ||
| Walmart 13% | ||
| JPMorgan Chase 12% | ||
| Goldman Sachs 9% | ||
| Chevron 9% | ||
| Microsoft 9% | ||
| Johnson & Johnson -6% | ||
| McDonald s -8% | ||
| Starbucks -8% | ||
| Apple -13% | ||
| Gilead -18% | ||
| Intel -31% | ||
| Boeing -35% | ||
| Quick: S&P 500 Stocks Lists: Performances & Trends, S&P 500 Stock Charts
Sort S&P 500 stocks: Daily, Weekly, Year-to-Date, Market Cap & Trends. Filter S&P 500 stocks list by sector: Show all, Tech, Finance, Energy, Staples, Retail, Industrial, Materials, Utilities and HealthCare |
| 12Stocks.com S&P 500 Stocks Performances & Trends Daily Report | |||||||||
|
| 
The overall Smart Investing & Trading Score is 58 (0-bearish to 100-bullish) which puts S&P 500 index in short term neutral trend. The Smart Investing & Trading Score from previous trading session is 51 and an improvement of trend continues. | ||||||||
Here are the Smart Investing & Trading Scores of the most requested S&P 500 stocks at 12Stocks.com (click stock name for detailed review):
|


| 12Stocks.com: Top Performing S&P 500 Index Stocks | ||||||||||||||||||||||||||||||||||||||||||||||||
 The top performing S&P 500 Index stocks year to date are
Now, more recently, over last week, the top performing S&P 500 Index stocks on the move are


|
||||||||||||||||||||||||||||||||||||||||||||||||
| 12Stocks.com: Investing in S&P 500 Index with Stocks | |
|
The following table helps investors and traders sort through current performance and trends (as measured by Smart Investing & Trading Score) of various
stocks in the S&P 500 Index. Quick View: Move mouse or cursor over stock symbol (ticker) to view short-term technical chart and over stock name to view long term chart. Click on  to add stock symbol to your watchlist and to add stock symbol to your watchlist and  to view watchlist. Click on any ticker or stock name for detailed market intelligence report for that stock. to view watchlist. Click on any ticker or stock name for detailed market intelligence report for that stock. |
12Stocks.com Performance of Stocks in S&P 500 Index
| Ticker | Stock Name | Watchlist | Category | Recent Price | Smart Investing & Trading Score | Change % | YTD Change% |
| SPG | Simon Property |   | Financials | 141.85 | 51 | -1.34 | -0.55% |
| VLO | Valero | | Energy | 165.30 | 68 | -1.34 | 27.15% |
| WAT | Waters | | Health Care | 309.09 | 32 | -1.34 | -6.12% |
| MDT | Medtronic | | Health Care | 80.20 | 25 | -1.34 | -2.65% |
| VMC | Vulcan Materials | | Industrials | 255.85 | 58 | -1.34 | 12.71% |
| AAL | American Airlines | | Transports | 14.04 | 30 | -1.34 | 2.18% |
| BRO | Brown & Brown | | Financials | 81.80 | 51 | -1.36 | 15.03% |
| DHI | D.R. Horton | | Industrials | 146.00 | 58 | -1.37 | -3.93% |
| WRB | W. R. | | Financials | 78.00 | 0 | -1.37 | 10.29% |
| TMO | Thermo Fisher | | Health Care | 566.66 | 75 | -1.38 | 6.76% |
| JNJ | Johnson & Johnson | | Health Care | 147.48 | 25 | -1.39 | -5.91% |
| ACN | Accenture | | Technology | 312.42 | 10 | -1.39 | -10.97% |
| VZ | Verizon | | Technology | 39.15 | 10 | -1.40 | 3.83% |
| MRO | Marathon Oil | | Energy | 27.43 | 54 | -1.40 | 13.53% |
| LVS | Las Vegas | | Services & Goods | 45.36 | 18 | -1.41 | -7.82% |
| MCD | McDonald s | | Services & Goods | 272.98 | 45 | -1.41 | -7.94% |
| ABT | Abbott | | Health Care | 106.07 | 10 | -1.42 | -3.64% |
| IFF | Flavors | | Materials | 84.20 | 66 | -1.44 | 3.99% |
| ARE | Alexandria Real | | Financials | 117.69 | 35 | -1.51 | -7.16% |
| EPAM | EPAM Systems | | Technology | 244.04 | 10 | -1.52 | -17.93% |
| PAYC | Paycom Software | | Technology | 185.21 | 35 | -1.53 | -10.41% |
| ADM | Archer-Daniels-Midland | | Consumer Staples | 60.84 | 48 | -1.54 | -15.76% |
| STLD | Steel Dynamics | | Materials | 132.10 | 43 | -1.54 | 11.85% |
| URI | United Rentals | | Transports | 650.88 | 58 | -1.58 | 13.51% |
| EL | Estee Lauder | | Consumer Staples | 146.63 | 83 | -1.58 | 0.26% |
| For chart view version of above stock list: Chart View ➞ 0 - 25 , 25 - 50 , 50 - 75 , 75 - 100 , 100 - 125 , 125 - 150 , 150 - 175 , 175 - 200 , 200 - 225 , 225 - 250 , 250 - 275 , 275 - 300 , 300 - 325 , 325 - 350 , 350 - 375 , 375 - 400 , 400 - 425 , 425 - 450 , 450 - 475 | ||
 | Click To Change The Sort Order: By Market Cap or Company Size Performance: Year-to-date, Week and Day |  |
|
Get the most comprehensive stock market coverage daily at 12Stocks.com ➞ Best Stocks Today ➞ Best Stocks Weekly ➞ Best Stocks Year-to-Date ➞ Best Stocks Trends ➞  Best Stocks Today 12Stocks.com Best Nasdaq Stocks ➞ Best S&P 500 Stocks ➞ Best Tech Stocks ➞ Best Biotech Stocks ➞ |
| Detailed Overview of S&P 500 Stocks |
| S&P 500 Technical Overview, Leaders & Laggards, Top S&P 500 ETF Funds & Detailed S&P 500 Stocks List, Charts, Trends & More |
| S&P 500: Technical Analysis, Trends & YTD Performance | |
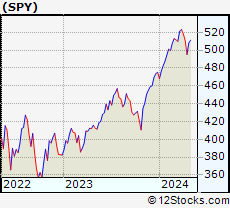
| S&P 500 index as represented by
SPY, an exchange-traded fund [ETF], holds basket of five hundred (mostly largecap) stocks from across all major sectors of the US stock market. The S&P 500 index (contains stocks like Apple and Exxon) is up by 6.15% and is currently outperforming the overall market by 0.81% year-to-date. Below is a quick view of technical charts and trends: | |
 SPY Weekly Chart |
|
| Long Term Trend: Good | |
| Medium Term Trend: Not Good | |
 SPY Daily Chart |
|
| Short Term Trend: Very Good | |
| Overall Trend Score: 58 | |
| YTD Performance: 6.15% | |
| **Trend Scores & Views Are Only For Educational Purposes And Not For Investing | |
| 12Stocks.com: Investing in S&P 500 Index using Exchange Traded Funds | |
|
The following table shows list of key exchange traded funds (ETF) that
help investors track S&P 500 index. The following list also includes leveraged ETF funds that track twice or thrice the daily returns of S&P 500 indices. Short or inverse ETF funds move in the opposite direction to the index they track and are useful during market pullbacks or during bear markets. Quick View: Move mouse or cursor over ETF symbol (ticker) to view short-term technical chart and over ETF name to view long term chart. Click on ticker or stock name for detailed view. Click on to add stock symbol to your watchlist and to view watchlist. |
12Stocks.com List of ETFs that track S&P 500 Index
| Ticker | ETF Name | Watchlist | Recent Price | Smart Investing & Trading Score | Change % | Week % | Year-to-date % |
| SPY | SPDR S&P 500 ETF | | 504.55 | 58 | -0.22 | 1.9 | 6.15% |
| IVV | iShares Core S&P 500 ETF | | 508.76 | 63 | 0.12 | 2.26 | 6.52% |
| VOO | Vanguard 500 ETF | | 465.33 | 63 | 0.11 | 2.25 | 6.53% |
| OEF | iShares S&P 100 | | 239.63 | 58 | -0.13 | 2.11 | 7.27% |
| SSO | ProShares Ultra S&P500 | | 71.69 | 58 | -0.49 | 3.73 | 10.17% |
| UPRO | ProShares UltraPro S&P500 | | 62.49 | 58 | -0.70 | 5.63 | 14.16% |
| SPXL | Direxion Daily S&P500 Bull 3X ETF | | 120.04 | 63 | 0.44 | 6.65 | 15.43% |
| SH | ProShares Short S&P500 | | 12.37 | 42 | 0.20 | -1.79 | -4.81% |
| SDS | ProShares UltraShort S&P500 | | 26.84 | 42 | 0.22 | -3.8 | -10.29% |
| SPXU | ProShares UltraPro Short S&P500 | | 36.25 | 42 | 0.72 | -5.43 | -15.7% |
| SPXS | Direxion Daily S&P 500 Bear 3X ETF | | 9.71 | 32 | -0.41 | -6.27 | -15.93% |
| 12Stocks.com: Charts, Trends, Fundamental Data and Performances of S&P 500 Stocks | |
|
We now take in-depth look at all S&P 500 stocks including charts, multi-period performances and overall trends (as measured by Smart Investing & Trading Score). One can sort S&P 500 stocks (click link to choose) by Daily, Weekly and by Year-to-Date performances. Also, one can sort by size of the company or by market capitalization. |
| Select Your Default Chart Type: | |||||
| |||||
| Click on stock symbol or name for detailed view. Click on to add stock symbol to your watchlist and to view watchlist. Quick View: Move mouse or cursor over "Daily" to quickly view daily technical stock chart and over "Weekly" to view weekly technical stock chart. | |||||

 | SPG Simon Property Group, Inc. |
| Sector: Financials | |
| SubSector: REIT - Retail | |
| MarketCap: 17959.6 Millions | |
| Recent Price: 141.85 Smart Investing & Trading Score: 51 | |
| Day Percent Change: -1.34% Day Change: -1.93 | |
| Week Change: 1% Year-to-date Change: -0.6% | |
| SPG Links: Profile News Message Board | |
| Charts:- Daily , Weekly | |
| Add SPG to Watchlist: View: Get SPG Trend Analysis ➞ | |
 | VLO Valero Energy Corporation |
| Sector: Energy | |
| SubSector: Oil & Gas Refining & Marketing | |
| MarketCap: 19590.5 Millions | |
| Recent Price: 165.30 Smart Investing & Trading Score: 68 | |
| Day Percent Change: -1.34% Day Change: -2.24 | |
| Week Change: 0.86% Year-to-date Change: 27.2% | |
| VLO Links: Profile News Message Board | |
| Charts:- Daily , Weekly | |
| Add VLO to Watchlist: View: Get VLO Trend Analysis ➞ | |
 | WAT Waters Corporation |
| Sector: Health Care | |
| SubSector: Medical Instruments & Supplies | |
| MarketCap: 11882 Millions | |
| Recent Price: 309.09 Smart Investing & Trading Score: 32 | |
| Day Percent Change: -1.34% Day Change: -4.21 | |
| Week Change: 4.39% Year-to-date Change: -6.1% | |
| WAT Links: Profile News Message Board | |
| Charts:- Daily , Weekly | |
| Add WAT to Watchlist: View: Get WAT Trend Analysis ➞ | |
 | MDT Medtronic plc |
| Sector: Health Care | |
| SubSector: Medical Appliances & Equipment | |
| MarketCap: 113698 Millions | |
| Recent Price: 80.20 Smart Investing & Trading Score: 25 | |
| Day Percent Change: -1.34% Day Change: -1.09 | |
| Week Change: 0.91% Year-to-date Change: -2.7% | |
| MDT Links: Profile News Message Board | |
| Charts:- Daily , Weekly | |
| Add MDT to Watchlist: View: Get MDT Trend Analysis ➞ | |
 | VMC Vulcan Materials Company |
| Sector: Industrials | |
| SubSector: General Building Materials | |
| MarketCap: 12304.7 Millions | |
| Recent Price: 255.85 Smart Investing & Trading Score: 58 | |
| Day Percent Change: -1.34% Day Change: -3.48 | |
| Week Change: 1.51% Year-to-date Change: 12.7% | |
| VMC Links: Profile News Message Board | |
| Charts:- Daily , Weekly | |
| Add VMC to Watchlist: View: Get VMC Trend Analysis ➞ | |
 | AAL American Airlines Group Inc. |
| Sector: Transports | |
| SubSector: Major Airlines | |
| MarketCap: 5346.45 Millions | |
| Recent Price: 14.04 Smart Investing & Trading Score: 30 | |
| Day Percent Change: -1.34% Day Change: -0.19 | |
| Week Change: -0.5% Year-to-date Change: 2.2% | |
| AAL Links: Profile News Message Board | |
| Charts:- Daily , Weekly | |
| Add AAL to Watchlist: View: Get AAL Trend Analysis ➞ | |
 | BRO Brown & Brown, Inc. |
| Sector: Financials | |
| SubSector: Insurance Brokers | |
| MarketCap: 10475.7 Millions | |
| Recent Price: 81.80 Smart Investing & Trading Score: 51 | |
| Day Percent Change: -1.36% Day Change: -1.13 | |
| Week Change: -0.45% Year-to-date Change: 15.0% | |
| BRO Links: Profile News Message Board | |
| Charts:- Daily , Weekly | |
| Add BRO to Watchlist: View: Get BRO Trend Analysis ➞ | |
 | DHI D.R. Horton, Inc. |
| Sector: Industrials | |
| SubSector: Residential Construction | |
| MarketCap: 13372.6 Millions | |
| Recent Price: 146.00 Smart Investing & Trading Score: 58 | |
| Day Percent Change: -1.37% Day Change: -2.03 | |
| Week Change: 2.68% Year-to-date Change: -3.9% | |
| DHI Links: Profile News Message Board | |
| Charts:- Daily , Weekly | |
| Add DHI to Watchlist: View: Get DHI Trend Analysis ➞ | |
 | WRB W. R. Berkley Corporation |
| Sector: Financials | |
| SubSector: Property & Casualty Insurance | |
| MarketCap: 9863.82 Millions | |
| Recent Price: 78.00 Smart Investing & Trading Score: 0 | |
| Day Percent Change: -1.37% Day Change: -1.08 | |
| Week Change: -5.34% Year-to-date Change: 10.3% | |
| WRB Links: Profile News Message Board | |
| Charts:- Daily , Weekly | |
| Add WRB to Watchlist: View: Get WRB Trend Analysis ➞ | |
 | TMO Thermo Fisher Scientific Inc. |
| Sector: Health Care | |
| SubSector: Medical Laboratories & Research | |
| MarketCap: 112999 Millions | |
| Recent Price: 566.66 Smart Investing & Trading Score: 75 | |
| Day Percent Change: -1.38% Day Change: -7.93 | |
| Week Change: 4.02% Year-to-date Change: 6.8% | |
| TMO Links: Profile News Message Board | |
| Charts:- Daily , Weekly | |
| Add TMO to Watchlist: View: Get TMO Trend Analysis ➞ | |
 | JNJ Johnson & Johnson |
| Sector: Health Care | |
| SubSector: Drug Manufacturers - Major | |
| MarketCap: 331972 Millions | |
| Recent Price: 147.48 Smart Investing & Trading Score: 25 | |
| Day Percent Change: -1.39% Day Change: -2.08 | |
| Week Change: -0.29% Year-to-date Change: -5.9% | |
| JNJ Links: Profile News Message Board | |
| Charts:- Daily , Weekly | |
| Add JNJ to Watchlist: View: Get JNJ Trend Analysis ➞ | |
 | ACN Accenture plc |
| Sector: Technology | |
| SubSector: Information Technology Services | |
| MarketCap: 106627 Millions | |
| Recent Price: 312.42 Smart Investing & Trading Score: 10 | |
| Day Percent Change: -1.39% Day Change: -4.41 | |
| Week Change: -1.41% Year-to-date Change: -11.0% | |
| ACN Links: Profile News Message Board | |
| Charts:- Daily , Weekly | |
| Add ACN to Watchlist: View: Get ACN Trend Analysis ➞ | |
 | VZ Verizon Communications Inc. |
| Sector: Technology | |
| SubSector: Telecom Services - Domestic | |
| MarketCap: 229427 Millions | |
| Recent Price: 39.15 Smart Investing & Trading Score: 10 | |
| Day Percent Change: -1.40% Day Change: -0.55 | |
| Week Change: -3.32% Year-to-date Change: 3.8% | |
| VZ Links: Profile News Message Board | |
| Charts:- Daily , Weekly | |
| Add VZ to Watchlist: View: Get VZ Trend Analysis ➞ | |
 | MRO Marathon Oil Corporation |
| Sector: Energy | |
| SubSector: Independent Oil & Gas | |
| MarketCap: 2911.53 Millions | |
| Recent Price: 27.43 Smart Investing & Trading Score: 54 | |
| Day Percent Change: -1.40% Day Change: -0.39 | |
| Week Change: -0.25% Year-to-date Change: 13.5% | |
| MRO Links: Profile News Message Board | |
| Charts:- Daily , Weekly | |
| Add MRO to Watchlist: View: Get MRO Trend Analysis ➞ | |
 | LVS Las Vegas Sands Corp. |
| Sector: Services & Goods | |
| SubSector: Resorts & Casinos | |
| MarketCap: 36431.6 Millions | |
| Recent Price: 45.36 Smart Investing & Trading Score: 18 | |
| Day Percent Change: -1.41% Day Change: -0.65 | |
| Week Change: -0.22% Year-to-date Change: -7.8% | |
| LVS Links: Profile News Message Board | |
| Charts:- Daily , Weekly | |
| Add LVS to Watchlist: View: Get LVS Trend Analysis ➞ | |
 | MCD McDonald s Corporation |
| Sector: Services & Goods | |
| SubSector: Restaurants | |
| MarketCap: 122481 Millions | |
| Recent Price: 272.98 Smart Investing & Trading Score: 45 | |
| Day Percent Change: -1.41% Day Change: -3.90 | |
| Week Change: 0.36% Year-to-date Change: -7.9% | |
| MCD Links: Profile News Message Board | |
| Charts:- Daily , Weekly | |
| Add MCD to Watchlist: View: Get MCD Trend Analysis ➞ | |
 | ABT Abbott Laboratories |
| Sector: Health Care | |
| SubSector: Medical Appliances & Equipment | |
| MarketCap: 125288 Millions | |
| Recent Price: 106.07 Smart Investing & Trading Score: 10 | |
| Day Percent Change: -1.42% Day Change: -1.53 | |
| Week Change: -1.13% Year-to-date Change: -3.6% | |
| ABT Links: Profile News Message Board | |
| Charts:- Daily , Weekly | |
| Add ABT to Watchlist: View: Get ABT Trend Analysis ➞ | |
 | IFF International Flavors & Fragrances Inc. |
| Sector: Materials | |
| SubSector: Specialty Chemicals | |
| MarketCap: 12178.7 Millions | |
| Recent Price: 84.20 Smart Investing & Trading Score: 66 | |
| Day Percent Change: -1.44% Day Change: -1.23 | |
| Week Change: 0.27% Year-to-date Change: 4.0% | |
| IFF Links: Profile News Message Board | |
| Charts:- Daily , Weekly | |
| Add IFF to Watchlist: View: Get IFF Trend Analysis ➞ | |
 | ARE Alexandria Real Estate Equities, Inc. |
| Sector: Financials | |
| SubSector: REIT - Office | |
| MarketCap: 16793.6 Millions | |
| Recent Price: 117.69 Smart Investing & Trading Score: 35 | |
| Day Percent Change: -1.51% Day Change: -1.80 | |
| Week Change: 1.73% Year-to-date Change: -7.2% | |
| ARE Links: Profile News Message Board | |
| Charts:- Daily , Weekly | |
| Add ARE to Watchlist: View: Get ARE Trend Analysis ➞ | |
 | EPAM EPAM Systems, Inc. |
| Sector: Technology | |
| SubSector: Information Technology Services | |
| MarketCap: 11519.6 Millions | |
| Recent Price: 244.04 Smart Investing & Trading Score: 10 | |
| Day Percent Change: -1.52% Day Change: -3.76 | |
| Week Change: -0.78% Year-to-date Change: -17.9% | |
| EPAM Links: Profile News Message Board | |
| Charts:- Daily , Weekly | |
| Add EPAM to Watchlist: View: Get EPAM Trend Analysis ➞ | |
 | PAYC Paycom Software, Inc. |
| Sector: Technology | |
| SubSector: Application Software | |
| MarketCap: 13041.6 Millions | |
| Recent Price: 185.21 Smart Investing & Trading Score: 35 | |
| Day Percent Change: -1.53% Day Change: -2.88 | |
| Week Change: 1.07% Year-to-date Change: -10.4% | |
| PAYC Links: Profile News Message Board | |
| Charts:- Daily , Weekly | |
| Add PAYC to Watchlist: View: Get PAYC Trend Analysis ➞ | |
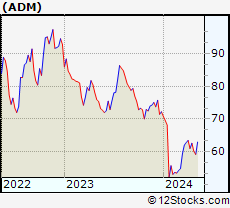 | ADM Archer-Daniels-Midland Company |
| Sector: Consumer Staples | |
| SubSector: Farm Products | |
| MarketCap: 18988.7 Millions | |
| Recent Price: 60.84 Smart Investing & Trading Score: 48 | |
| Day Percent Change: -1.54% Day Change: -0.95 | |
| Week Change: -2.81% Year-to-date Change: -15.8% | |
| ADM Links: Profile News Message Board | |
| Charts:- Daily , Weekly | |
| Add ADM to Watchlist: View: Get ADM Trend Analysis ➞ | |
 | STLD Steel Dynamics, Inc. |
| Sector: Materials | |
| SubSector: Steel & Iron | |
| MarketCap: 4533.58 Millions | |
| Recent Price: 132.10 Smart Investing & Trading Score: 43 | |
| Day Percent Change: -1.54% Day Change: -2.06 | |
| Week Change: -3.51% Year-to-date Change: 11.9% | |
| STLD Links: Profile News Message Board | |
| Charts:- Daily , Weekly | |
| Add STLD to Watchlist: View: Get STLD Trend Analysis ➞ | |
 | URI United Rentals, Inc. |
| Sector: Transports | |
| SubSector: Rental & Leasing Services | |
| MarketCap: 6246.64 Millions | |
| Recent Price: 650.88 Smart Investing & Trading Score: 58 | |
| Day Percent Change: -1.58% Day Change: -10.45 | |
| Week Change: 3.59% Year-to-date Change: 13.5% | |
| URI Links: Profile News Message Board | |
| Charts:- Daily , Weekly | |
| Add URI to Watchlist: View: Get URI Trend Analysis ➞ | |
 | EL The Estee Lauder Companies Inc. |
| Sector: Consumer Staples | |
| SubSector: Personal Products | |
| MarketCap: 59521.1 Millions | |
| Recent Price: 146.63 Smart Investing & Trading Score: 83 | |
| Day Percent Change: -1.58% Day Change: -2.35 | |
| Week Change: 1.54% Year-to-date Change: 0.3% | |
| EL Links: Profile News Message Board | |
| Charts:- Daily , Weekly | |
| Add EL to Watchlist: View: Get EL Trend Analysis ➞ | |
| For tabular summary view of above stock list: Summary View ➞ 0 - 25 , 25 - 50 , 50 - 75 , 75 - 100 , 100 - 125 , 125 - 150 , 150 - 175 , 175 - 200 , 200 - 225 , 225 - 250 , 250 - 275 , 275 - 300 , 300 - 325 , 325 - 350 , 350 - 375 , 375 - 400 , 400 - 425 , 425 - 450 , 450 - 475 | ||
| Click To Change The Sort Order: By Market Cap or Company Size Performance: Year-to-date, Week and Day | |
| Select Chart Type: | ||
|
Best Stocks Today 12Stocks.com |
© 2024 12Stocks.com Terms & Conditions Privacy Contact Us
All Information Provided Only For Education And Not To Be Used For Investing or Trading. See Terms & Conditions


One More Thing ... Get Best Stocks Delivered Daily!
Never Ever Miss A Move With Our Top Ten Stocks Lists
Find Best Stocks In Any Market - Bull or Bear Market
Take A Peek At Our Top Ten Stocks Lists: Daily, Weekly, Year-to-Date & Top Trends
Find Best Stocks In Any Market - Bull or Bear Market
Take A Peek At Our Top Ten Stocks Lists: Daily, Weekly, Year-to-Date & Top Trends
S&P 500 Stocks With Best Up Trends [0-bearish to 100-bullish]: Hasbro [100], Wabtec [100], Texas Instruments[100], Boston Scientific[100], Analog Devices[100], Microchip [100], EQT [100], Synchrony Financial[100], Equity Residential[100], Essex Property[100], UDR [100]
Best S&P 500 Stocks Year-to-Date:
NVIDIA [65.69%], Constellation [59.4%], NRG [40.19%], Meta Platforms[39.28%], Progressive [33.59%], Targa Resources[33.28%], Marathon [33.13%], Diamondback [32.05%], Eaton [31.49%], Western Digital[30.58%], Micron [29.04%] Best S&P 500 Stocks This Week:
Hasbro [18.51%], Wabtec [12.21%], Tesla [10.36%], Texas Instruments[10.25%], Microchip [10%], NXP Semiconductors[8.95%], Boston Scientific[8.84%], Analog Devices[8.62%], CoStar [8.08%], NVIDIA [7.68%], Kimberly-Clark [7.33%] Best S&P 500 Stocks Daily:
Hasbro [12.66%], Tesla [12.16%], Wabtec [8.95%], CoStar [7.62%], Texas Instruments[6.40%], Boston Scientific[6.22%], ON Semiconductor[5.52%], Hilton Worldwide[5.33%], Analog Devices[4.86%], Biogen [4.77%], Microchip [4.25%]