
 Login Sign Up


| |||||
 |  | ||||

| 12Stocks.com Market Intelligence |
Best S&P 500 Stocks
|
On this page, you will find the most comprehensive analysis of S&P 500 stocks and ETFs - from latest trends to performances to charts ➞. First, here are the year-to-date (YTD) performances of the most requested S&P 500 stocks at 12Stocks.com (click stock for review):
| NVIDIA 66% | ||
| Caterpillar 23% | ||
| Amazon.com 18% | ||
| Merck 16% | ||
| Google 13% | ||
| JPMorgan Chase 13% | ||
| Walmart 12% | ||
| Goldman Sachs 10% | ||
| Chevron 9% | ||
| Microsoft 8% | ||
| Johnson & Johnson -5% | ||
| McDonald s -7% | ||
| Starbucks -8% | ||
| Apple -13% | ||
| Gilead -17% | ||
| Intel -32% | ||
| Boeing -35% | ||
| Quick: S&P 500 Stocks Lists: Performances & Trends, S&P 500 Stock Charts
Sort S&P 500 stocks: Daily, Weekly, Year-to-Date, Market Cap & Trends. Filter S&P 500 stocks list by sector: Show all, Tech, Finance, Energy, Staples, Retail, Industrial, Materials, Utilities and HealthCare |
| 12Stocks.com S&P 500 Stocks Performances & Trends Daily Report | |||||||||
|
| 
The overall Smart Investing & Trading Score is 58 (0-bearish to 100-bullish) which puts S&P 500 index in short term neutral trend. The Smart Investing & Trading Score from previous trading session is 51 and hence an improvement of trend. | ||||||||
Here are the Smart Investing & Trading Scores of the most requested S&P 500 stocks at 12Stocks.com (click stock name for detailed review):
|


| 12Stocks.com: Top Performing S&P 500 Index Stocks | ||||||||||||||||||||||||||||||||||||||||||||||||
 The top performing S&P 500 Index stocks year to date are
Now, more recently, over last week, the top performing S&P 500 Index stocks on the move are


|
||||||||||||||||||||||||||||||||||||||||||||||||
| 12Stocks.com: Investing in S&P 500 Index with Stocks | |
|
The following table helps investors and traders sort through current performance and trends (as measured by Smart Investing & Trading Score) of various
stocks in the S&P 500 Index. Quick View: Move mouse or cursor over stock symbol (ticker) to view short-term technical chart and over stock name to view long term chart. Click on  to add stock symbol to your watchlist and to add stock symbol to your watchlist and  to view watchlist. Click on any ticker or stock name for detailed market intelligence report for that stock. to view watchlist. Click on any ticker or stock name for detailed market intelligence report for that stock. |
12Stocks.com Performance of Stocks in S&P 500 Index
| Ticker | Stock Name | Watchlist | Category | Recent Price | Smart Investing & Trading Score | Change % | YTD Change% |
| HPE | Hewlett Packard |   | Technology | 16.83 | 46 | 0.00 | -0.88% |
| KDP | Keurig Dr | | Consumer Staples | 31.76 | 100 | 0.00 | -4.68% |
| WEC | WEC | | Utilities | 81.96 | 100 | -0.01 | -2.63% |
| HII | Huntington Ingalls | | Industrials | 274.47 | 58 | -0.01 | 5.71% |
| AZO | AutoZone | | Services & Goods | 2961.04 | 51 | -0.02 | 14.52% |
| EVRG | Evergy | | Utilities | 52.25 | 88 | -0.02 | 0.10% |
| AIG | American | | Financials | 74.93 | 70 | -0.04 | 10.60% |
| LYB | LyondellBasell Industries | | Materials | 100.55 | 56 | -0.04 | 5.75% |
| CTLT | Catalent | | Health Care | 56.03 | 61 | -0.04 | 24.71% |
| CTVA | Corteva | | Materials | 55.18 | 75 | -0.04 | 15.15% |
| WHR | Whirlpool | | Consumer Staples | 105.39 | 42 | -0.05 | -13.45% |
| MRK | Merck | | Health Care | 126.88 | 70 | -0.05 | 16.38% |
| GLW | Corning | | Technology | 31.53 | 42 | -0.06 | 3.55% |
| ACGL | Arch Capital | | Financials | 93.78 | 75 | -0.07 | 26.27% |
| ALL | Allstate | | Financials | 175.28 | 95 | -0.07 | 25.22% |
| DG | Dollar General | | Services & Goods | 142.73 | 46 | -0.08 | 4.99% |
| CMS | CMS | | Utilities | 59.95 | 100 | -0.08 | 3.24% |
| CINF | Cincinnati Financial | | Financials | 120.83 | 83 | -0.11 | 16.79% |
| BBY | Best Buy | | Services & Goods | 75.04 | 36 | -0.11 | -4.14% |
| HPQ | HP | | Technology | 27.67 | 25 | -0.11 | -8.04% |
| BG | Bunge | | Consumer Staples | 109.62 | 93 | -0.12 | 8.59% |
| IPG | Interpublic | | Services & Goods | 30.99 | 49 | -0.13 | -5.06% |
| CI | Cigna | | Health Care | 352.65 | 75 | -0.15 | 17.77% |
| DD | DuPont de | | Materials | 73.80 | 54 | -0.15 | -4.07% |
| STT | State Street | | Financials | 74.39 | 55 | -0.16 | -3.96% |
| For chart view version of above stock list: Chart View ➞ 0 - 25 , 25 - 50 , 50 - 75 , 75 - 100 , 100 - 125 , 125 - 150 , 150 - 175 , 175 - 200 , 200 - 225 , 225 - 250 , 250 - 275 , 275 - 300 , 300 - 325 , 325 - 350 , 350 - 375 , 375 - 400 , 400 - 425 , 425 - 450 , 450 - 475 , 475 - 500 | ||
 | Click To Change The Sort Order: By Market Cap or Company Size Performance: Year-to-date, Week and Day |  |
|
Get the most comprehensive stock market coverage daily at 12Stocks.com ➞ Best Stocks Today ➞ Best Stocks Weekly ➞ Best Stocks Year-to-Date ➞ Best Stocks Trends ➞  Best Stocks Today 12Stocks.com Best Nasdaq Stocks ➞ Best S&P 500 Stocks ➞ Best Tech Stocks ➞ Best Biotech Stocks ➞ |
| Detailed Overview of S&P 500 Stocks |
| S&P 500 Technical Overview, Leaders & Laggards, Top S&P 500 ETF Funds & Detailed S&P 500 Stocks List, Charts, Trends & More |
| S&P 500: Technical Analysis, Trends & YTD Performance | |
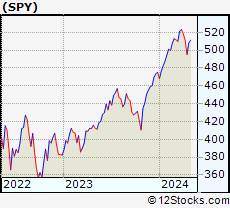
| S&P 500 index as represented by
SPY, an exchange-traded fund [ETF], holds basket of five hundred (mostly largecap) stocks from across all major sectors of the US stock market. The S&P 500 index (contains stocks like Apple and Exxon) is up by 6.38% and is currently outperforming the overall market by 0.74% year-to-date. Below is a quick view of technical charts and trends: | |
 SPY Weekly Chart |
|
| Long Term Trend: Good | |
| Medium Term Trend: Not Good | |
 SPY Daily Chart |
|
| Short Term Trend: Very Good | |
| Overall Trend Score: 58 | |
| YTD Performance: 6.38% | |
| **Trend Scores & Views Are Only For Educational Purposes And Not For Investing | |
| 12Stocks.com: Investing in S&P 500 Index using Exchange Traded Funds | |
|
The following table shows list of key exchange traded funds (ETF) that
help investors track S&P 500 index. The following list also includes leveraged ETF funds that track twice or thrice the daily returns of S&P 500 indices. Short or inverse ETF funds move in the opposite direction to the index they track and are useful during market pullbacks or during bear markets. Quick View: Move mouse or cursor over ETF symbol (ticker) to view short-term technical chart and over ETF name to view long term chart. Click on ticker or stock name for detailed view. Click on to add stock symbol to your watchlist and to view watchlist. |
12Stocks.com List of ETFs that track S&P 500 Index
| Ticker | ETF Name | Watchlist | Recent Price | Smart Investing & Trading Score | Change % | Week % | Year-to-date % |
| SPY | SPDR S&P 500 ETF | | 505.65 | 58 | 1.19 | 2.12 | 6.38% |
| IVV | iShares Core S&P 500 ETF | | 508.17 | 63 | 2.00 | 2.14 | 6.39% |
| VOO | Vanguard 500 ETF | | 464.84 | 63 | 2.03 | 2.14 | 6.42% |
| OEF | iShares S&P 100 | | 239.95 | 58 | 1.33 | 2.25 | 7.41% |
| SSO | ProShares Ultra S&P500 | | 72.04 | 58 | 2.43 | 4.24 | 10.71% |
| UPRO | ProShares UltraPro S&P500 | | 62.93 | 58 | 3.59 | 6.37 | 14.96% |
| SPXL | Direxion Daily S&P500 Bull 3X ETF | | 119.51 | 63 | 3.52 | 6.18 | 14.92% |
| SH | ProShares Short S&P500 | | 12.34 | 42 | -1.20 | -1.99 | -5% |
| SDS | ProShares UltraShort S&P500 | | 26.78 | 37 | -2.30 | -4.01 | -10.49% |
| SPXU | ProShares UltraPro Short S&P500 | | 35.99 | 42 | -3.62 | -6.1 | -16.3% |
| SPXS | Direxion Daily S&P 500 Bear 3X ETF | | 9.75 | 32 | -5.43 | -5.89 | -15.58% |
| 12Stocks.com: Charts, Trends, Fundamental Data and Performances of S&P 500 Stocks | |
|
We now take in-depth look at all S&P 500 stocks including charts, multi-period performances and overall trends (as measured by Smart Investing & Trading Score). One can sort S&P 500 stocks (click link to choose) by Daily, Weekly and by Year-to-Date performances. Also, one can sort by size of the company or by market capitalization. |
| Select Your Default Chart Type: | |||||
| |||||
| Click on stock symbol or name for detailed view. Click on to add stock symbol to your watchlist and to view watchlist. Quick View: Move mouse or cursor over "Daily" to quickly view daily technical stock chart and over "Weekly" to view weekly technical stock chart. | |||||

 | HPE Hewlett Packard Enterprise Company |
| Sector: Technology | |
| SubSector: Communication Equipment | |
| MarketCap: 12886.1 Millions | |
| Recent Price: 16.83 Smart Investing & Trading Score: 46 | |
| Day Percent Change: 0.00% Day Change: 0.00 | |
| Week Change: 0.24% Year-to-date Change: -0.9% | |
| HPE Links: Profile News Message Board | |
| Charts:- Daily , Weekly | |
| Add HPE to Watchlist: View: Get HPE Trend Analysis ➞ | |
 | KDP Keurig Dr Pepper Inc. |
| Sector: Consumer Staples | |
| SubSector: Beverages - Soft Drinks | |
| MarketCap: 35295.2 Millions | |
| Recent Price: 31.76 Smart Investing & Trading Score: 100 | |
| Day Percent Change: 0.00% Day Change: 0.00 | |
| Week Change: 0.79% Year-to-date Change: -4.7% | |
| KDP Links: Profile News Message Board | |
| Charts:- Daily , Weekly | |
| Add KDP to Watchlist: View: Get KDP Trend Analysis ➞ | |
 | WEC WEC Energy Group, Inc. |
| Sector: Utilities | |
| SubSector: Electric Utilities | |
| MarketCap: 24852 Millions | |
| Recent Price: 81.96 Smart Investing & Trading Score: 100 | |
| Day Percent Change: -0.01% Day Change: -0.01 | |
| Week Change: 0.49% Year-to-date Change: -2.6% | |
| WEC Links: Profile News Message Board | |
| Charts:- Daily , Weekly | |
| Add WEC to Watchlist: View: Get WEC Trend Analysis ➞ | |
 | HII Huntington Ingalls Industries, Inc. |
| Sector: Industrials | |
| SubSector: Aerospace/Defense Products & Services | |
| MarketCap: 7276.11 Millions | |
| Recent Price: 274.47 Smart Investing & Trading Score: 58 | |
| Day Percent Change: -0.01% Day Change: -0.02 | |
| Week Change: 1.03% Year-to-date Change: 5.7% | |
| HII Links: Profile News Message Board | |
| Charts:- Daily , Weekly | |
| Add HII to Watchlist: View: Get HII Trend Analysis ➞ | |
 | AZO AutoZone, Inc. |
| Sector: Services & Goods | |
| SubSector: Auto Parts Stores | |
| MarketCap: 19128 Millions | |
| Recent Price: 2961.04 Smart Investing & Trading Score: 51 | |
| Day Percent Change: -0.02% Day Change: -0.62 | |
| Week Change: -0.82% Year-to-date Change: 14.5% | |
| AZO Links: Profile News Message Board | |
| Charts:- Daily , Weekly | |
| Add AZO to Watchlist: View: Get AZO Trend Analysis ➞ | |
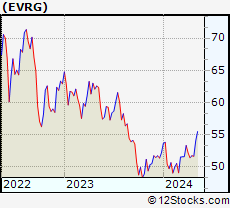 | EVRG Evergy, Inc. |
| Sector: Utilities | |
| SubSector: Electric Utilities | |
| MarketCap: 11914.8 Millions | |
| Recent Price: 52.25 Smart Investing & Trading Score: 88 | |
| Day Percent Change: -0.02% Day Change: -0.01 | |
| Week Change: 0.93% Year-to-date Change: 0.1% | |
| EVRG Links: Profile News Message Board | |
| Charts:- Daily , Weekly | |
| Add EVRG to Watchlist: View: Get EVRG Trend Analysis ➞ | |
 | AIG American International Group, Inc. |
| Sector: Financials | |
| SubSector: Property & Casualty Insurance | |
| MarketCap: 21219 Millions | |
| Recent Price: 74.93 Smart Investing & Trading Score: 70 | |
| Day Percent Change: -0.04% Day Change: -0.03 | |
| Week Change: 0.94% Year-to-date Change: 10.6% | |
| AIG Links: Profile News Message Board | |
| Charts:- Daily , Weekly | |
| Add AIG to Watchlist: View: Get AIG Trend Analysis ➞ | |
 | LYB LyondellBasell Industries N.V. |
| Sector: Materials | |
| SubSector: Specialty Chemicals | |
| MarketCap: 16420.7 Millions | |
| Recent Price: 100.55 Smart Investing & Trading Score: 56 | |
| Day Percent Change: -0.04% Day Change: -0.04 | |
| Week Change: -0.19% Year-to-date Change: 5.8% | |
| LYB Links: Profile News Message Board | |
| Charts:- Daily , Weekly | |
| Add LYB to Watchlist: View: Get LYB Trend Analysis ➞ | |
 | CTLT Catalent, Inc. |
| Sector: Health Care | |
| SubSector: Drugs - Generic | |
| MarketCap: 6351.95 Millions | |
| Recent Price: 56.03 Smart Investing & Trading Score: 61 | |
| Day Percent Change: -0.04% Day Change: -0.02 | |
| Week Change: 0.99% Year-to-date Change: 24.7% | |
| CTLT Links: Profile News Message Board | |
| Charts:- Daily , Weekly | |
| Add CTLT to Watchlist: View: Get CTLT Trend Analysis ➞ | |
 | CTVA Corteva, Inc. |
| Sector: Materials | |
| SubSector: Agricultural Chemicals | |
| MarketCap: 18894.3 Millions | |
| Recent Price: 55.18 Smart Investing & Trading Score: 75 | |
| Day Percent Change: -0.04% Day Change: -0.02 | |
| Week Change: 0.69% Year-to-date Change: 15.2% | |
| CTVA Links: Profile News Message Board | |
| Charts:- Daily , Weekly | |
| Add CTVA to Watchlist: View: Get CTVA Trend Analysis ➞ | |
 | WHR Whirlpool Corporation |
| Sector: Consumer Staples | |
| SubSector: Appliances | |
| MarketCap: 5015.08 Millions | |
| Recent Price: 105.39 Smart Investing & Trading Score: 42 | |
| Day Percent Change: -0.05% Day Change: -0.05 | |
| Week Change: 0.69% Year-to-date Change: -13.5% | |
| WHR Links: Profile News Message Board | |
| Charts:- Daily , Weekly | |
| Add WHR to Watchlist: View: Get WHR Trend Analysis ➞ | |
 | MRK Merck & Co., Inc. |
| Sector: Health Care | |
| SubSector: Drug Manufacturers - Major | |
| MarketCap: 192657 Millions | |
| Recent Price: 126.88 Smart Investing & Trading Score: 70 | |
| Day Percent Change: -0.05% Day Change: -0.06 | |
| Week Change: 0.87% Year-to-date Change: 16.4% | |
| MRK Links: Profile News Message Board | |
| Charts:- Daily , Weekly | |
| Add MRK to Watchlist: View: Get MRK Trend Analysis ➞ | |
 | GLW Corning Incorporated |
| Sector: Technology | |
| SubSector: Diversified Electronics | |
| MarketCap: 16287.6 Millions | |
| Recent Price: 31.53 Smart Investing & Trading Score: 42 | |
| Day Percent Change: -0.06% Day Change: -0.02 | |
| Week Change: 0.83% Year-to-date Change: 3.6% | |
| GLW Links: Profile News Message Board | |
| Charts:- Daily , Weekly | |
| Add GLW to Watchlist: View: Get GLW Trend Analysis ➞ | |
 | ACGL Arch Capital Group Ltd. |
| Sector: Financials | |
| SubSector: Property & Casualty Insurance | |
| MarketCap: 12350.9 Millions | |
| Recent Price: 93.78 Smart Investing & Trading Score: 75 | |
| Day Percent Change: -0.07% Day Change: -0.07 | |
| Week Change: 0.91% Year-to-date Change: 26.3% | |
| ACGL Links: Profile News Message Board | |
| Charts:- Daily , Weekly | |
| Add ACGL to Watchlist: View: Get ACGL Trend Analysis ➞ | |
 | ALL The Allstate Corporation |
| Sector: Financials | |
| SubSector: Property & Casualty Insurance | |
| MarketCap: 25916.6 Millions | |
| Recent Price: 175.28 Smart Investing & Trading Score: 95 | |
| Day Percent Change: -0.07% Day Change: -0.13 | |
| Week Change: 1.34% Year-to-date Change: 25.2% | |
| ALL Links: Profile News Message Board | |
| Charts:- Daily , Weekly | |
| Add ALL to Watchlist: View: Get ALL Trend Analysis ➞ | |
 | DG Dollar General Corporation |
| Sector: Services & Goods | |
| SubSector: Discount, Variety Stores | |
| MarketCap: 39611.9 Millions | |
| Recent Price: 142.73 Smart Investing & Trading Score: 46 | |
| Day Percent Change: -0.08% Day Change: -0.12 | |
| Week Change: -1.44% Year-to-date Change: 5.0% | |
| DG Links: Profile News Message Board | |
| Charts:- Daily , Weekly | |
| Add DG to Watchlist: View: Get DG Trend Analysis ➞ | |
 | CMS CMS Energy Corporation |
| Sector: Utilities | |
| SubSector: Electric Utilities | |
| MarketCap: 15105.8 Millions | |
| Recent Price: 59.95 Smart Investing & Trading Score: 100 | |
| Day Percent Change: -0.08% Day Change: -0.05 | |
| Week Change: 0.67% Year-to-date Change: 3.2% | |
| CMS Links: Profile News Message Board | |
| Charts:- Daily , Weekly | |
| Add CMS to Watchlist: View: Get CMS Trend Analysis ➞ | |
 | CINF Cincinnati Financial Corporation |
| Sector: Financials | |
| SubSector: Property & Casualty Insurance | |
| MarketCap: 13637 Millions | |
| Recent Price: 120.83 Smart Investing & Trading Score: 83 | |
| Day Percent Change: -0.11% Day Change: -0.13 | |
| Week Change: 0.73% Year-to-date Change: 16.8% | |
| CINF Links: Profile News Message Board | |
| Charts:- Daily , Weekly | |
| Add CINF to Watchlist: View: Get CINF Trend Analysis ➞ | |
 | BBY Best Buy Co., Inc. |
| Sector: Services & Goods | |
| SubSector: Electronics Stores | |
| MarketCap: 15771.3 Millions | |
| Recent Price: 75.04 Smart Investing & Trading Score: 36 | |
| Day Percent Change: -0.11% Day Change: -0.08 | |
| Week Change: -1.46% Year-to-date Change: -4.1% | |
| BBY Links: Profile News Message Board | |
| Charts:- Daily , Weekly | |
| Add BBY to Watchlist: View: Get BBY Trend Analysis ➞ | |
 | HPQ HP Inc. |
| Sector: Technology | |
| SubSector: Diversified Computer Systems | |
| MarketCap: 22107.8 Millions | |
| Recent Price: 27.67 Smart Investing & Trading Score: 25 | |
| Day Percent Change: -0.11% Day Change: -0.03 | |
| Week Change: -0.5% Year-to-date Change: -8.0% | |
| HPQ Links: Profile News Message Board | |
| Charts:- Daily , Weekly | |
| Add HPQ to Watchlist: View: Get HPQ Trend Analysis ➞ | |
 | BG Bunge Limited |
| Sector: Consumer Staples | |
| SubSector: Farm Products | |
| MarketCap: 4975.77 Millions | |
| Recent Price: 109.62 Smart Investing & Trading Score: 93 | |
| Day Percent Change: -0.12% Day Change: -0.13 | |
| Week Change: 0.09% Year-to-date Change: 8.6% | |
| BG Links: Profile News Message Board | |
| Charts:- Daily , Weekly | |
| Add BG to Watchlist: View: Get BG Trend Analysis ➞ | |
 | IPG The Interpublic Group of Companies, Inc. |
| Sector: Services & Goods | |
| SubSector: Advertising Agencies | |
| MarketCap: 5730.55 Millions | |
| Recent Price: 30.99 Smart Investing & Trading Score: 49 | |
| Day Percent Change: -0.13% Day Change: -0.04 | |
| Week Change: 0.88% Year-to-date Change: -5.1% | |
| IPG Links: Profile News Message Board | |
| Charts:- Daily , Weekly | |
| Add IPG to Watchlist: View: Get IPG Trend Analysis ➞ | |
 | CI Cigna Corporation |
| Sector: Health Care | |
| SubSector: Health Care Plans | |
| MarketCap: 60251.8 Millions | |
| Recent Price: 352.65 Smart Investing & Trading Score: 75 | |
| Day Percent Change: -0.15% Day Change: -0.53 | |
| Week Change: 0.07% Year-to-date Change: 17.8% | |
| CI Links: Profile News Message Board | |
| Charts:- Daily , Weekly | |
| Add CI to Watchlist: View: Get CI Trend Analysis ➞ | |
 | DD DuPont de Nemours, Inc. |
| Sector: Materials | |
| SubSector: Agricultural Chemicals | |
| MarketCap: 25631.6 Millions | |
| Recent Price: 73.80 Smart Investing & Trading Score: 54 | |
| Day Percent Change: -0.15% Day Change: -0.11 | |
| Week Change: -0.12% Year-to-date Change: -4.1% | |
| DD Links: Profile News Message Board | |
| Charts:- Daily , Weekly | |
| Add DD to Watchlist: View: Get DD Trend Analysis ➞ | |
 | STT State Street Corporation |
| Sector: Financials | |
| SubSector: Asset Management | |
| MarketCap: 18623 Millions | |
| Recent Price: 74.39 Smart Investing & Trading Score: 55 | |
| Day Percent Change: -0.16% Day Change: -0.12 | |
| Week Change: 1.39% Year-to-date Change: -4.0% | |
| STT Links: Profile News Message Board | |
| Charts:- Daily , Weekly | |
| Add STT to Watchlist: View: Get STT Trend Analysis ➞ | |
| For tabular summary view of above stock list: Summary View ➞ 0 - 25 , 25 - 50 , 50 - 75 , 75 - 100 , 100 - 125 , 125 - 150 , 150 - 175 , 175 - 200 , 200 - 225 , 225 - 250 , 250 - 275 , 275 - 300 , 300 - 325 , 325 - 350 , 350 - 375 , 375 - 400 , 400 - 425 , 425 - 450 , 450 - 475 , 475 - 500 | ||
| Click To Change The Sort Order: By Market Cap or Company Size Performance: Year-to-date, Week and Day | |
| Select Chart Type: | ||
|
Best Stocks Today 12Stocks.com |
© 2024 12Stocks.com Terms & Conditions Privacy Contact Us
All Information Provided Only For Education And Not To Be Used For Investing or Trading. See Terms & Conditions


One More Thing ... Get Best Stocks Delivered Daily!
Never Ever Miss A Move With Our Top Ten Stocks Lists
Find Best Stocks In Any Market - Bull or Bear Market
Take A Peek At Our Top Ten Stocks Lists: Daily, Weekly, Year-to-Date & Top Trends
Find Best Stocks In Any Market - Bull or Bear Market
Take A Peek At Our Top Ten Stocks Lists: Daily, Weekly, Year-to-Date & Top Trends
S&P 500 Stocks With Best Up Trends [0-bearish to 100-bullish]: Danaher [100], Kimberly-Clark [100], Quest Diagnostics[100], Hasbro [100], Philip Morris[100], Citi [100], American Express[100], Truist Financial[100], Morgan Stanley[100], Federal Realty[100], Bank of America[100]
Best S&P 500 Stocks Year-to-Date:
NVIDIA [66.44%], Constellation [60.75%], Meta Platforms[40.09%], NRG [38.28%], Marathon [34.57%], Progressive [34.37%], Targa Resources[33.54%], Western Digital[33.51%], Micron [31.78%], Diamondback [31.78%], United Airlines[30.95%] Best S&P 500 Stocks This Week:
Globe Life[13.52%], General Electric[9.83%], NVIDIA [8.17%], Danaher [7.47%], Kimberly-Clark [7.26%], Pulte [6.95%], Norwegian Cruise[6.83%], Ford Motor[6.59%], Enphase [6.57%], General Motors[6.44%], Quest Diagnostics[6.43%] Best S&P 500 Stocks Daily:
Globe Life[14.11%], General Electric[8.28%], Danaher [7.21%], Kimberly-Clark [5.51%], Norwegian Cruise[5.39%], United Rentals[5.09%], Quest Diagnostics[5.08%], Builders FirstSource[5.07%], Thermo Fisher[4.78%], Waters [4.70%], Pulte [4.57%]