
 Login Sign Up


| |||||
 |  | ||||

| 12Stocks.com Market Intelligence |
Best S&P 500 Stocks
|
On this page, you will find the most comprehensive analysis of S&P 500 stocks and ETFs - from latest trends to performances to charts ➞. First, here are the year-to-date (YTD) performances of the most requested S&P 500 stocks at 12Stocks.com (click stock for review):
| NVIDIA 73% | ||
| Amazon.com 22% | ||
| Google 19% | ||
| Merck 18% | ||
| Walmart 14% | ||
| Caterpillar 13% | ||
| JPMorgan Chase 13% | ||
| Goldman Sachs 12% | ||
| Chevron 8% | ||
| Microsoft 6% | ||
| Johnson & Johnson -4% | ||
| McDonald s -8% | ||
| Apple -10% | ||
| Gilead -19% | ||
| Starbucks -22% | ||
| Boeing -31% | ||
| Intel -39% | ||
| Quick: S&P 500 Stocks Lists: Performances & Trends, S&P 500 Stock Charts
Sort S&P 500 stocks: Daily, Weekly, Year-to-Date, Market Cap & Trends. Filter S&P 500 stocks list by sector: Show all, Tech, Finance, Energy, Staples, Retail, Industrial, Materials, Utilities and HealthCare |
| 12Stocks.com S&P 500 Stocks Performances & Trends Daily Report | |||||||||
|
| 
The overall Smart Investing & Trading Score is 30 (0-bearish to 100-bullish) which puts S&P 500 index in short term bearish to neutral trend. The Smart Investing & Trading Score from previous trading session is 7 and hence an improvement of trend. | ||||||||
Here are the Smart Investing & Trading Scores of the most requested S&P 500 stocks at 12Stocks.com (click stock name for detailed review):
|


| 12Stocks.com: Top Performing S&P 500 Index Stocks | ||||||||||||||||||||||||||||||||||||||||||||||||
 The top performing S&P 500 Index stocks year to date are
Now, more recently, over last week, the top performing S&P 500 Index stocks on the move are


|
||||||||||||||||||||||||||||||||||||||||||||||||
| 12Stocks.com: Investing in S&P 500 Index with Stocks | |
|
The following table helps investors and traders sort through current performance and trends (as measured by Smart Investing & Trading Score) of various
stocks in the S&P 500 Index. Quick View: Move mouse or cursor over stock symbol (ticker) to view short-term technical chart and over stock name to view long term chart. Click on  to add stock symbol to your watchlist and to add stock symbol to your watchlist and  to view watchlist. Click on any ticker or stock name for detailed market intelligence report for that stock. to view watchlist. Click on any ticker or stock name for detailed market intelligence report for that stock. |
12Stocks.com Performance of Stocks in S&P 500 Index
| Ticker | Stock Name | Watchlist | Category | Recent Price | Smart Investing & Trading Score | Change % | YTD Change% |
| AEE | Ameren |   | Utilities | 75.25 | 100 | 1.02 | 4.02% |
| FE | First | | Utilities | 39.09 | 100 | 1.01 | 6.63% |
| PPG | PPG Industries | | Materials | 132.25 | 49 | 0.99 | -11.57% |
| BR | Broadridge Financial | | Technology | 195.35 | 35 | 0.99 | -5.05% |
| ALLE | Allegion | | Services & Goods | 122.26 | 10 | 0.99 | -3.50% |
| LNT | Alliant | | Utilities | 50.85 | 100 | 0.97 | -0.88% |
| EIX | Edison | | Utilities | 71.97 | 100 | 0.97 | 0.67% |
| GIS | General Mills | | Consumer Staples | 70.65 | 71 | 0.94 | 8.46% |
| MCO | Moody s | | Services & Goods | 376.40 | 35 | 0.94 | -3.63% |
| SPY | SPDR S&P | | Utilities | 505.03 | 30 | 0.94 | 6.25% |
| CTRA | Contura | | Materials | 27.16 | 43 | 0.93 | 6.43% |
| AOS | A. O. | | Industrials | 83.55 | 23 | 0.92 | 1.35% |
| LOW | Lowe s | | Services & Goods | 229.58 | 18 | 0.91 | 3.16% |
| FDS | FactSet Research | | Technology | 423.36 | 42 | 0.90 | -11.25% |
| EW | Edwards Life | | Health Care | 85.06 | 28 | 0.90 | 11.55% |
| SLB | Schlumberger | | Energy | 47.58 | 17 | 0.89 | -8.57% |
| CHTR | Charter | | Technology | 262.00 | 57 | 0.89 | -32.59% |
| UPS | United Parcel | | Transports | 147.22 | 60 | 0.89 | -6.37% |
| BEN | Franklin Resources | | Financials | 22.97 | 10 | 0.88 | -22.89% |
| STLD | Steel Dynamics | | Materials | 130.79 | 10 | 0.88 | 10.75% |
| FTV | Fortive | | Technology | 76.10 | 17 | 0.87 | 3.35% |
| ENPH | Enphase | | Technology | 106.06 | 10 | 0.86 | -19.74% |
| SPG | Simon Property | | Financials | 141.36 | 10 | 0.84 | -0.90% |
| CFG | Citizens Financial | | Financials | 34.99 | 75 | 0.84 | 5.58% |
| WAB | Wabtec | | Transports | 161.88 | 68 | 0.83 | 27.57% |
| For chart view version of above stock list: Chart View ➞ 0 - 25 , 25 - 50 , 50 - 75 , 75 - 100 , 100 - 125 , 125 - 150 , 150 - 175 , 175 - 200 , 200 - 225 , 225 - 250 , 250 - 275 , 275 - 300 , 300 - 325 , 325 - 350 , 350 - 375 , 375 - 400 , 400 - 425 , 425 - 450 , 450 - 475 , 475 - 500 | ||
 | Click To Change The Sort Order: By Market Cap or Company Size Performance: Year-to-date, Week and Day |  |
|
Get the most comprehensive stock market coverage daily at 12Stocks.com ➞ Best Stocks Today ➞ Best Stocks Weekly ➞ Best Stocks Year-to-Date ➞ Best Stocks Trends ➞  Best Stocks Today 12Stocks.com Best Nasdaq Stocks ➞ Best S&P 500 Stocks ➞ Best Tech Stocks ➞ Best Biotech Stocks ➞ |
| Detailed Overview of S&P 500 Stocks |
| S&P 500 Technical Overview, Leaders & Laggards, Top S&P 500 ETF Funds & Detailed S&P 500 Stocks List, Charts, Trends & More |
| S&P 500: Technical Analysis, Trends & YTD Performance | |
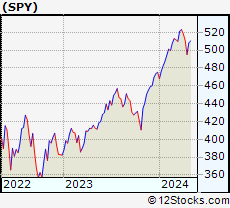
| S&P 500 index as represented by
SPY, an exchange-traded fund [ETF], holds basket of five hundred (mostly largecap) stocks from across all major sectors of the US stock market. The S&P 500 index (contains stocks like Apple and Exxon) is up by 6.25% and is currently outperforming the overall market by 0.63% year-to-date. Below is a quick view of technical charts and trends: | |
 SPY Weekly Chart |
|
| Long Term Trend: Not Good | |
| Medium Term Trend: Not Good | |
 SPY Daily Chart |
|
| Short Term Trend: Deteriorating | |
| Overall Trend Score: 30 | |
| YTD Performance: 6.25% | |
| **Trend Scores & Views Are Only For Educational Purposes And Not For Investing | |
| 12Stocks.com: Investing in S&P 500 Index using Exchange Traded Funds | |
|
The following table shows list of key exchange traded funds (ETF) that
help investors track S&P 500 index. The following list also includes leveraged ETF funds that track twice or thrice the daily returns of S&P 500 indices. Short or inverse ETF funds move in the opposite direction to the index they track and are useful during market pullbacks or during bear markets. Quick View: Move mouse or cursor over ETF symbol (ticker) to view short-term technical chart and over ETF name to view long term chart. Click on ticker or stock name for detailed view. Click on to add stock symbol to your watchlist and to view watchlist. |
12Stocks.com List of ETFs that track S&P 500 Index
| Ticker | ETF Name | Watchlist | Recent Price | Smart Investing & Trading Score | Change % | Week % | Year-to-date % |
| SPY | SPDR S&P 500 ETF | | 505.03 | 30 | 0.94 | -0.64 | 6.25% |
| IVV | iShares Core S&P 500 ETF | | 507.46 | 30 | 0.91 | -0.65 | 6.25% |
| VOO | Vanguard 500 ETF | | 464.22 | 30 | 0.93 | -0.64 | 6.28% |
| OEF | iShares S&P 100 | | 240.23 | 30 | 1.16 | -0.55 | 7.54% |
| SSO | ProShares Ultra S&P500 | | 71.66 | 17 | 1.80 | -1.44 | 10.13% |
| UPRO | ProShares UltraPro S&P500 | | 62.37 | 17 | 2.75 | -2.27 | 13.94% |
| SPXL | Direxion Daily S&P500 Bull 3X ETF | | 118.44 | 17 | 2.68 | -2.23 | 13.9% |
| SH | ProShares Short S&P500 | | 12.38 | 70 | -0.88 | 0.81 | -4.7% |
| SDS | ProShares UltraShort S&P500 | | 26.90 | 83 | -1.82 | 1.39 | -10.09% |
| SPXU | ProShares UltraPro Short S&P500 | | 36.26 | 78 | -2.55 | 2.14 | -15.67% |
| SPXS | Direxion Daily S&P 500 Bear 3X ETF | | 9.81 | 78 | -2.58 | 2.08 | -15.06% |
| 12Stocks.com: Charts, Trends, Fundamental Data and Performances of S&P 500 Stocks | |
|
We now take in-depth look at all S&P 500 stocks including charts, multi-period performances and overall trends (as measured by Smart Investing & Trading Score). One can sort S&P 500 stocks (click link to choose) by Daily, Weekly and by Year-to-Date performances. Also, one can sort by size of the company or by market capitalization. |
| Select Your Default Chart Type: | |||||
| |||||
| Click on stock symbol or name for detailed view. Click on to add stock symbol to your watchlist and to view watchlist. Quick View: Move mouse or cursor over "Daily" to quickly view daily technical stock chart and over "Weekly" to view weekly technical stock chart. | |||||
 | AEE Ameren Corporation |
| Sector: Utilities | |
| SubSector: Electric Utilities | |
| MarketCap: 17308.2 Millions | |
| Recent Price: 75.25 Smart Investing & Trading Score: 100 | |
| Day Percent Change: 1.02% Day Change: 0.76 | |
| Week Change: 2.16% Year-to-date Change: 4.0% | |
| AEE Links: Profile News Message Board | |
| Charts:- Daily , Weekly | |
| Add AEE to Watchlist: View: Get AEE Trend Analysis ➞ | |
 | FE FirstEnergy Corp. |
| Sector: Utilities | |
| SubSector: Electric Utilities | |
| MarketCap: 20754.1 Millions | |
| Recent Price: 39.09 Smart Investing & Trading Score: 100 | |
| Day Percent Change: 1.01% Day Change: 0.39 | |
| Week Change: 2.52% Year-to-date Change: 6.6% | |
| FE Links: Profile News Message Board | |
| Charts:- Daily , Weekly | |
| Add FE to Watchlist: View: Get FE Trend Analysis ➞ | |
 | PPG PPG Industries, Inc. |
| Sector: Materials | |
| SubSector: Specialty Chemicals | |
| MarketCap: 20285.5 Millions | |
| Recent Price: 132.25 Smart Investing & Trading Score: 49 | |
| Day Percent Change: 0.99% Day Change: 1.30 | |
| Week Change: 1.61% Year-to-date Change: -11.6% | |
| PPG Links: Profile News Message Board | |
| Charts:- Daily , Weekly | |
| Add PPG to Watchlist: View: Get PPG Trend Analysis ➞ | |
 | BR Broadridge Financial Solutions, Inc. |
| Sector: Technology | |
| SubSector: Information Technology Services | |
| MarketCap: 10633.8 Millions | |
| Recent Price: 195.35 Smart Investing & Trading Score: 35 | |
| Day Percent Change: 0.99% Day Change: 1.92 | |
| Week Change: 0.62% Year-to-date Change: -5.1% | |
| BR Links: Profile News Message Board | |
| Charts:- Daily , Weekly | |
| Add BR to Watchlist: View: Get BR Trend Analysis ➞ | |
 | ALLE Allegion plc |
| Sector: Services & Goods | |
| SubSector: Security & Protection Services | |
| MarketCap: 8515.93 Millions | |
| Recent Price: 122.26 Smart Investing & Trading Score: 10 | |
| Day Percent Change: 0.99% Day Change: 1.20 | |
| Week Change: -1.28% Year-to-date Change: -3.5% | |
| ALLE Links: Profile News Message Board | |
| Charts:- Daily , Weekly | |
| Add ALLE to Watchlist: View: Get ALLE Trend Analysis ➞ | |
 | LNT Alliant Energy Corporation |
| Sector: Utilities | |
| SubSector: Electric Utilities | |
| MarketCap: 10678.4 Millions | |
| Recent Price: 50.85 Smart Investing & Trading Score: 100 | |
| Day Percent Change: 0.97% Day Change: 0.49 | |
| Week Change: 2.54% Year-to-date Change: -0.9% | |
| LNT Links: Profile News Message Board | |
| Charts:- Daily , Weekly | |
| Add LNT to Watchlist: View: Get LNT Trend Analysis ➞ | |
 | EIX Edison International |
| Sector: Utilities | |
| SubSector: Electric Utilities | |
| MarketCap: 19358.1 Millions | |
| Recent Price: 71.97 Smart Investing & Trading Score: 100 | |
| Day Percent Change: 0.97% Day Change: 0.69 | |
| Week Change: 2.61% Year-to-date Change: 0.7% | |
| EIX Links: Profile News Message Board | |
| Charts:- Daily , Weekly | |
| Add EIX to Watchlist: View: Get EIX Trend Analysis ➞ | |
 | GIS General Mills, Inc. |
| Sector: Consumer Staples | |
| SubSector: Processed & Packaged Goods | |
| MarketCap: 34131.7 Millions | |
| Recent Price: 70.65 Smart Investing & Trading Score: 71 | |
| Day Percent Change: 0.94% Day Change: 0.66 | |
| Week Change: -0.25% Year-to-date Change: 8.5% | |
| GIS Links: Profile News Message Board | |
| Charts:- Daily , Weekly | |
| Add GIS to Watchlist: View: Get GIS Trend Analysis ➞ | |
 | MCO Moody s Corporation |
| Sector: Services & Goods | |
| SubSector: Business Services | |
| MarketCap: 35998.5 Millions | |
| Recent Price: 376.40 Smart Investing & Trading Score: 35 | |
| Day Percent Change: 0.94% Day Change: 3.51 | |
| Week Change: 0.07% Year-to-date Change: -3.6% | |
| MCO Links: Profile News Message Board | |
| Charts:- Daily , Weekly | |
| Add MCO to Watchlist: View: Get MCO Trend Analysis ➞ | |
 | SPY SPDR S&P 500 ETF |
| Sector: Utilities | |
| SubSector: Exchange Traded Fund | |
| MarketCap: 0 Millions | |
| Recent Price: 505.03 Smart Investing & Trading Score: 30 | |
| Day Percent Change: 0.94% Day Change: 4.68 | |
| Week Change: -0.64% Year-to-date Change: 6.3% | |
| SPY Links: Profile News Message Board | |
| Charts:- Daily , Weekly | |
| Add SPY to Watchlist: View: Get SPY Trend Analysis ➞ | |
 | CTRA Contura Energy, Inc. |
| Sector: Materials | |
| SubSector: Industrial Metals & Minerals | |
| MarketCap: 75.291 Millions | |
| Recent Price: 27.16 Smart Investing & Trading Score: 43 | |
| Day Percent Change: 0.93% Day Change: 0.25 | |
| Week Change: -3.99% Year-to-date Change: 6.4% | |
| CTRA Links: Profile News Message Board | |
| Charts:- Daily , Weekly | |
| Add CTRA to Watchlist: View: Get CTRA Trend Analysis ➞ | |
 | AOS A. O. Smith Corporation |
| Sector: Industrials | |
| SubSector: Industrial Electrical Equipment | |
| MarketCap: 5809.89 Millions | |
| Recent Price: 83.55 Smart Investing & Trading Score: 23 | |
| Day Percent Change: 0.92% Day Change: 0.76 | |
| Week Change: 0.41% Year-to-date Change: 1.4% | |
| AOS Links: Profile News Message Board | |
| Charts:- Daily , Weekly | |
| Add AOS to Watchlist: View: Get AOS Trend Analysis ➞ | |
 | LOW Lowe s Companies, Inc. |
| Sector: Services & Goods | |
| SubSector: Home Improvement Stores | |
| MarketCap: 56084.2 Millions | |
| Recent Price: 229.58 Smart Investing & Trading Score: 18 | |
| Day Percent Change: 0.91% Day Change: 2.06 | |
| Week Change: -0.13% Year-to-date Change: 3.2% | |
| LOW Links: Profile News Message Board | |
| Charts:- Daily , Weekly | |
| Add LOW to Watchlist: View: Get LOW Trend Analysis ➞ | |
 | FDS FactSet Research Systems Inc. |
| Sector: Technology | |
| SubSector: Information & Delivery Services | |
| MarketCap: 9024.37 Millions | |
| Recent Price: 423.36 Smart Investing & Trading Score: 42 | |
| Day Percent Change: 0.90% Day Change: 3.79 | |
| Week Change: 0.45% Year-to-date Change: -11.3% | |
| FDS Links: Profile News Message Board | |
| Charts:- Daily , Weekly | |
| Add FDS to Watchlist: View: Get FDS Trend Analysis ➞ | |
 | EW Edwards Lifesciences Corporation |
| Sector: Health Care | |
| SubSector: Medical Appliances & Equipment | |
| MarketCap: 36735.5 Millions | |
| Recent Price: 85.06 Smart Investing & Trading Score: 28 | |
| Day Percent Change: 0.90% Day Change: 0.76 | |
| Week Change: -1.59% Year-to-date Change: 11.6% | |
| EW Links: Profile News Message Board | |
| Charts:- Daily , Weekly | |
| Add EW to Watchlist: View: Get EW Trend Analysis ➞ | |
 | SLB Schlumberger Limited |
| Sector: Energy | |
| SubSector: Oil & Gas Equipment & Services | |
| MarketCap: 23892 Millions | |
| Recent Price: 47.58 Smart Investing & Trading Score: 17 | |
| Day Percent Change: 0.89% Day Change: 0.42 | |
| Week Change: -3.29% Year-to-date Change: -8.6% | |
| SLB Links: Profile News Message Board | |
| Charts:- Daily , Weekly | |
| Add SLB to Watchlist: View: Get SLB Trend Analysis ➞ | |
 | CHTR Charter Communications, Inc. |
| Sector: Technology | |
| SubSector: CATV Systems | |
| MarketCap: 82268.3 Millions | |
| Recent Price: 262.00 Smart Investing & Trading Score: 57 | |
| Day Percent Change: 0.89% Day Change: 2.30 | |
| Week Change: 2.9% Year-to-date Change: -32.6% | |
| CHTR Links: Profile News Message Board | |
| Charts:- Daily , Weekly | |
| Add CHTR to Watchlist: View: Get CHTR Trend Analysis ➞ | |
 | UPS United Parcel Service, Inc. |
| Sector: Transports | |
| SubSector: Air Delivery & Freight Services | |
| MarketCap: 81928.9 Millions | |
| Recent Price: 147.22 Smart Investing & Trading Score: 60 | |
| Day Percent Change: 0.89% Day Change: 1.30 | |
| Week Change: -0.25% Year-to-date Change: -6.4% | |
| UPS Links: Profile News Message Board | |
| Charts:- Daily , Weekly | |
| Add UPS to Watchlist: View: Get UPS Trend Analysis ➞ | |
 | BEN Franklin Resources, Inc. |
| Sector: Financials | |
| SubSector: Asset Management | |
| MarketCap: 9419.73 Millions | |
| Recent Price: 22.97 Smart Investing & Trading Score: 10 | |
| Day Percent Change: 0.88% Day Change: 0.20 | |
| Week Change: -8.08% Year-to-date Change: -22.9% | |
| BEN Links: Profile News Message Board | |
| Charts:- Daily , Weekly | |
| Add BEN to Watchlist: View: Get BEN Trend Analysis ➞ | |
 | STLD Steel Dynamics, Inc. |
| Sector: Materials | |
| SubSector: Steel & Iron | |
| MarketCap: 4533.58 Millions | |
| Recent Price: 130.79 Smart Investing & Trading Score: 10 | |
| Day Percent Change: 0.88% Day Change: 1.14 | |
| Week Change: -2.42% Year-to-date Change: 10.8% | |
| STLD Links: Profile News Message Board | |
| Charts:- Daily , Weekly | |
| Add STLD to Watchlist: View: Get STLD Trend Analysis ➞ | |
 | FTV Fortive Corporation |
| Sector: Technology | |
| SubSector: Scientific & Technical Instruments | |
| MarketCap: 16351.9 Millions | |
| Recent Price: 76.10 Smart Investing & Trading Score: 17 | |
| Day Percent Change: 0.87% Day Change: 0.66 | |
| Week Change: 0.17% Year-to-date Change: 3.4% | |
| FTV Links: Profile News Message Board | |
| Charts:- Daily , Weekly | |
| Add FTV to Watchlist: View: Get FTV Trend Analysis ➞ | |
 | ENPH Enphase Energy, Inc. |
| Sector: Technology | |
| SubSector: Semiconductor Equipment & Materials | |
| MarketCap: 4047.48 Millions | |
| Recent Price: 106.06 Smart Investing & Trading Score: 10 | |
| Day Percent Change: 0.86% Day Change: 0.90 | |
| Week Change: -5.24% Year-to-date Change: -19.7% | |
| ENPH Links: Profile News Message Board | |
| Charts:- Daily , Weekly | |
| Add ENPH to Watchlist: View: Get ENPH Trend Analysis ➞ | |
 | SPG Simon Property Group, Inc. |
| Sector: Financials | |
| SubSector: REIT - Retail | |
| MarketCap: 17959.6 Millions | |
| Recent Price: 141.36 Smart Investing & Trading Score: 10 | |
| Day Percent Change: 0.84% Day Change: 1.18 | |
| Week Change: -0.7% Year-to-date Change: -0.9% | |
| SPG Links: Profile News Message Board | |
| Charts:- Daily , Weekly | |
| Add SPG to Watchlist: View: Get SPG Trend Analysis ➞ | |
 | CFG Citizens Financial Group, Inc. |
| Sector: Financials | |
| SubSector: Regional - Mid-Atlantic Banks | |
| MarketCap: 8225.19 Millions | |
| Recent Price: 34.99 Smart Investing & Trading Score: 75 | |
| Day Percent Change: 0.84% Day Change: 0.29 | |
| Week Change: -0.46% Year-to-date Change: 5.6% | |
| CFG Links: Profile News Message Board | |
| Charts:- Daily , Weekly | |
| Add CFG to Watchlist: View: Get CFG Trend Analysis ➞ | |
 | WAB Wabtec Corporation |
| Sector: Transports | |
| SubSector: Railroads | |
| MarketCap: 8230.22 Millions | |
| Recent Price: 161.88 Smart Investing & Trading Score: 68 | |
| Day Percent Change: 0.83% Day Change: 1.34 | |
| Week Change: -1.51% Year-to-date Change: 27.6% | |
| WAB Links: Profile News Message Board | |
| Charts:- Daily , Weekly | |
| Add WAB to Watchlist: View: Get WAB Trend Analysis ➞ | |
| For tabular summary view of above stock list: Summary View ➞ 0 - 25 , 25 - 50 , 50 - 75 , 75 - 100 , 100 - 125 , 125 - 150 , 150 - 175 , 175 - 200 , 200 - 225 , 225 - 250 , 250 - 275 , 275 - 300 , 300 - 325 , 325 - 350 , 350 - 375 , 375 - 400 , 400 - 425 , 425 - 450 , 450 - 475 , 475 - 500 | ||
| Click To Change The Sort Order: By Market Cap or Company Size Performance: Year-to-date, Week and Day | |
| Select Chart Type: | ||
|
Best Stocks Today 12Stocks.com |
© 2024 12Stocks.com Terms & Conditions Privacy Contact Us
All Information Provided Only For Education And Not To Be Used For Investing or Trading. See Terms & Conditions


One More Thing ... Get Best Stocks Delivered Daily!
Never Ever Miss A Move With Our Top Ten Stocks Lists
Find Best Stocks In Any Market - Bull or Bear Market
Take A Peek At Our Top Ten Stocks Lists: Daily, Weekly, Year-to-Date & Top Trends
Find Best Stocks In Any Market - Bull or Bear Market
Take A Peek At Our Top Ten Stocks Lists: Daily, Weekly, Year-to-Date & Top Trends
S&P 500 Stocks With Best Up Trends [0-bearish to 100-bullish]: Moderna [100], C.H. Robinson[100], QUALCOMM [100], BorgWarner [100], Kellogg [100], WestRock [100], Ventas [100], AES [100], Xylem [100], Flavors[100], Synchrony Financial[100]
Best S&P 500 Stocks Year-to-Date:
NVIDIA [73.29%], Constellation [58.62%], NRG [45.32%], Chipotle Mexican[37.39%], DaVita [35.78%], Western Digital[33.13%], Leidos Holdings[31.8%], Micron [31.63%], Progressive [31.23%], Eaton [30.92%], Targa Resources[30.07%] Best S&P 500 Stocks This Week:
Bio-Techne [18.01%], Moderna [16.32%], C.H. Robinson[15.25%], Garmin [15.25%], Amcor [10.03%], AES [9.99%], Leidos Holdings[9.44%], Aptiv [9.24%], Pfizer [9.06%], QUALCOMM [8.72%], WestRock [8.17%] Best S&P 500 Stocks Daily:
Moderna [12.68%], C.H. Robinson[12.26%], Aptiv [11.53%], QUALCOMM [9.74%], Monolithic Power[9.24%], BorgWarner [8.40%], Kellogg [7.55%], WestRock [6.70%], Estee Lauder[5.94%], Corteva [5.69%], Zoetis [5.51%]