
 Login Sign Up


| |||||
 |  | ||||

| 12Stocks.com Market Intelligence |
Best Tech Stocks
| In a hurry? Tech Stocks Lists: Performance & Trends, Stock Charts, FANG Stocks
Sort Tech stocks: Daily, Weekly, Year-to-Date, Market Cap & Trends. Filter Tech stocks list by size:All Tech Large Mid-Range Small and MicroCap |
| 12Stocks.com Tech Stocks Performances & Trends Daily | |||||||||
|
|  The overall Smart Investing & Trading Score is 78 (0-bearish to 100-bullish) which puts Technology sector in short term neutral to bullish trend. The Smart Investing & Trading Score from previous trading session is 90 and hence a deterioration of trend.
| ||||||||
Here are the Smart Investing & Trading Scores of the most requested Technology stocks at 12Stocks.com (click stock name for detailed review):
|


| 12Stocks.com: Investing in Technology sector with Stocks | |
|
The following table helps investors and traders sort through current performance and trends (as measured by Smart Investing & Trading Score) of various
stocks in the Tech sector. Quick View: Move mouse or cursor over stock symbol (ticker) to view short-term technical chart and over stock name to view long term chart. Click on  to add stock symbol to your watchlist and to add stock symbol to your watchlist and  to view watchlist. Click on any ticker or stock name for detailed market intelligence report for that stock. to view watchlist. Click on any ticker or stock name for detailed market intelligence report for that stock. |
12Stocks.com Performance of Stocks in Tech Sector
| Ticker | Stock Name | Watchlist | Category | Recent Price | Smart Investing & Trading Score | Change % | YTD Change% |
| BILL | Bill.com |   | Software | 59.28 | 52 | -0.40 | -27.34% |
| GTLB | GitLab | | Software - | 56.26 | 52 | -0.42 | -11.22% |
| DOX | Amdocs | | Software | 81.75 | 8 | -0.44 | -6.99% |
| YY | JOYY | | Internet | 33.96 | 71 | -0.44 | -14.46% |
| NVT | nVent Electric | | Electronics | 80.01 | 58 | -0.50 | 35.40% |
| XRX | Xerox | | IT | 13.95 | 37 | -0.50 | -23.90% |
| YEXT | Yext | | Internet | 5.75 | 54 | -0.52 | -2.38% |
| PRGS | Progress Software | | Software | 51.42 | 57 | -0.54 | -5.30% |
| TWOU | 2U | | Software | 0.34 | 44 | -0.58 | -72.35% |
| TENB | Tenable | | Software | 44.00 | 0 | -0.59 | -4.47% |
| PINC | Premier | | Healthcare Information | 19.66 | 28 | -0.61 | -12.08% |
| NABL | N-able | | IT | 12.78 | 40 | -0.62 | -3.95% |
| PEGA | Pegasystems | | Software | 62.88 | 59 | -0.63 | 28.69% |
| RELY | Remitly Global | | Software - Infrastructure | 14.11 | 71 | -0.63 | -27.34% |
| ALTR | Altair Engineering | | Semiconductor | 90.50 | 95 | -0.64 | 7.55% |
| APPN | Appian | | Software | 33.15 | 17 | -0.66 | -11.98% |
| GBTG | Global Business | | Software - | 6.01 | 10 | -0.66 | -7.96% |
| TSEM | Tower Semiconductor | | Semiconductor | 36.71 | 83 | -0.70 | 20.28% |
| CIEN | Ciena | | Communication | 48.85 | 40 | -0.71 | 8.53% |
| MTSI | MACOM | | Semiconductor | 100.85 | 31 | -0.74 | 8.50% |
| DT | Dynatrace | | Software | 48.10 | 57 | -0.76 | -12.05% |
| KT | KT | | Telecom | 13.74 | 62 | -0.79 | 2.23% |
| YOU | Clear Secure | | Software - | 17.29 | 10 | -0.80 | -16.55% |
| SY | So-Young | | Healthcare Information | 1.23 | 31 | -0.81 | -4.65% |
| AMKR | Amkor | | Semiconductor | 32.68 | 58 | -0.82 | -1.77% |
| For chart view version of above stock list: Chart View ➞ 0 - 25 , 25 - 50 , 50 - 75 , 75 - 100 , 100 - 125 , 125 - 150 , 150 - 175 , 175 - 200 , 200 - 225 , 225 - 250 | ||
 | Click To Change The Sort Order: By Market Cap or Company Size Performance: Year-to-date, Week and Day |  |
|
Get the most comprehensive stock market coverage daily at 12Stocks.com ➞ Best Stocks Today ➞ Best Stocks Weekly ➞ Best Stocks Year-to-Date ➞ Best Stocks Trends ➞  Best Stocks Today 12Stocks.com Best Nasdaq Stocks ➞ Best S&P 500 Stocks ➞ Best Tech Stocks ➞ Best Biotech Stocks ➞ |
| Detailed Overview of Tech Stocks |
| Tech Technical Overview, Leaders & Laggards, Top Tech ETF Funds & Detailed Tech Stocks List, Charts, Trends & More |
| Tech Sector: Technical Analysis, Trends & YTD Performance | |
| Technology sector is composed of stocks
from semiconductors, software, web, social media
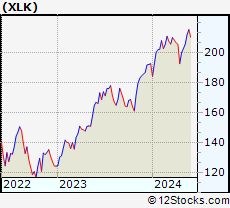
and services subsectors. Technology sector, as represented by XLK, an exchange-traded fund [ETF] that holds basket of tech stocks (e.g, Intel, Google) is up by 10.05% and is currently underperforming the overall market by -0.52% year-to-date. Below is a quick view of technical charts and trends: |
|
 XLK Weekly Chart |
|
| Long Term Trend: Very Good | |
| Medium Term Trend: Very Good | |
 XLK Daily Chart |
|
| Short Term Trend: Good | |
| Overall Trend Score: 78 | |
| YTD Performance: 10.05% | |
| **Trend Scores & Views Are Only For Educational Purposes And Not For Investing | |
| 12Stocks.com: Top Performing Technology Sector Stocks | ||||||||||||||||||||||||||||||||||||||||||||||||
 The top performing Technology sector stocks year to date are
Now, more recently, over last week, the top performing Technology sector stocks on the move are


|
||||||||||||||||||||||||||||||||||||||||||||||||
| 12Stocks.com: Investing in Tech Sector using Exchange Traded Funds | |
|
The following table shows list of key exchange traded funds (ETF) that
help investors track Tech Index. For detailed view, check out our ETF Funds section of our website. Quick View: Move mouse or cursor over ETF symbol (ticker) to view short-term technical chart and over ETF name to view long term chart. Click on ticker or stock name for detailed view. Click on to add stock symbol to your watchlist and to view watchlist. |
12Stocks.com List of ETFs that track Tech Index
| Ticker | ETF Name | Watchlist | Recent Price | Smart Investing & Trading Score | Change % | Week % | Year-to-date % |
| XLK | Technology | | 211.82 | 78 | -0.22 | 3.06 | 10.05% |
| QQQ | QQQ | | 451.76 | 78 | -0.62 | 2.19 | 10.31% |
| IYW | Technology | | 138.02 | 78 | -0.59 | 3.02 | 12.44% |
| VGT | Information Technology | | 532.55 | 78 | -1.02 | 3.16 | 10.03% |
| IXN | Global Tech | | 75.90 | 78 | -0.41 | 2.72 | 11.32% |
| IGV | Tech-Software | | 84.27 | 64 | 0.20 | 3.54 | 3.87% |
| XSD | Semiconductor | | 238.61 | 83 | 0.06 | 4.04 | 6.15% |
| TQQQ | QQQ | | 62.94 | 78 | -0.22 | 6.37 | 24.14% |
| SQQQ | Short QQQ | | 9.97 | 17 | 0.30 | -6.03 | -25.87% |
| SOXL | Semicondct Bull 3X | | 45.40 | 78 | -1.86 | 10.65 | 44.59% |
| SOXS | Semicondct Bear 3X | | 29.69 | 43 | 5.10 | -10.46 | 410.14% |
| SOXX | PHLX Semiconductor | | 228.24 | 78 | -1.68 | 3.63 | 18.85% |
| QTEC | First -100-Tech | | 190.75 | 65 | -0.78 | 3.23 | 8.71% |
| SMH | Semiconductor | | 230.25 | 78 | -0.84 | 3.11 | 31.67% |
| 12Stocks.com: Charts, Trends, Fundamental Data and Performances of Tech Stocks | |
|
We now take in-depth look at all Tech stocks including charts, multi-period performances and overall trends (as measured by Smart Investing & Trading Score). One can sort Tech stocks (click link to choose) by Daily, Weekly and by Year-to-Date performances. Also, one can sort by size of the company or by market capitalization. |
| Select Your Default Chart Type: | |||||
| |||||
| Click on stock symbol or name for detailed view. Click on to add stock symbol to your watchlist and to view watchlist. Quick View: Move mouse or cursor over "Daily" to quickly view daily technical stock chart and over "Weekly" to view weekly technical stock chart. | |||||


 | BILL Bill.com Holdings, Inc. |
| Sector: Technology | |
| SubSector: Application Software | |
| MarketCap: 3068.42 Millions | |
| Recent Price: 59.28 Smart Investing & Trading Score: 52 | |
| Day Percent Change: -0.40% Day Change: -0.24 | |
| Week Change: 4.61% Year-to-date Change: -27.3% | |
| BILL Links: Profile News Message Board | |
| Charts:- Daily , Weekly | |
| Add BILL to Watchlist: View: Get Complete BILL Trend Analysis ➞ | |
 | GTLB GitLab Inc. |
| Sector: Technology | |
| SubSector: Software - Application | |
| MarketCap: 7840 Millions | |
| Recent Price: 56.26 Smart Investing & Trading Score: 52 | |
| Day Percent Change: -0.42% Day Change: -0.24 | |
| Week Change: 6.41% Year-to-date Change: -11.2% | |
| GTLB Links: Profile News Message Board | |
| Charts:- Daily , Weekly | |
| Add GTLB to Watchlist: View: Get Complete GTLB Trend Analysis ➞ | |
 | DOX Amdocs Limited |
| Sector: Technology | |
| SubSector: Business Software & Services | |
| MarketCap: 6895.48 Millions | |
| Recent Price: 81.75 Smart Investing & Trading Score: 8 | |
| Day Percent Change: -0.44% Day Change: -0.36 | |
| Week Change: -1.78% Year-to-date Change: -7.0% | |
| DOX Links: Profile News Message Board | |
| Charts:- Daily , Weekly | |
| Add DOX to Watchlist: View: Get Complete DOX Trend Analysis ➞ | |
 | YY JOYY Inc. |
| Sector: Technology | |
| SubSector: Internet Information Providers | |
| MarketCap: 3527.6 Millions | |
| Recent Price: 33.96 Smart Investing & Trading Score: 71 | |
| Day Percent Change: -0.44% Day Change: -0.15 | |
| Week Change: 0.92% Year-to-date Change: -14.5% | |
| YY Links: Profile News Message Board | |
| Charts:- Daily , Weekly | |
| Add YY to Watchlist: View: Get Complete YY Trend Analysis ➞ | |
 | NVT nVent Electric plc |
| Sector: Technology | |
| SubSector: Diversified Electronics | |
| MarketCap: 2752.86 Millions | |
| Recent Price: 80.01 Smart Investing & Trading Score: 58 | |
| Day Percent Change: -0.50% Day Change: -0.40 | |
| Week Change: -1.97% Year-to-date Change: 35.4% | |
| NVT Links: Profile News Message Board | |
| Charts:- Daily , Weekly | |
| Add NVT to Watchlist: View: Get Complete NVT Trend Analysis ➞ | |
 | XRX Xerox Holdings Corporation |
| Sector: Technology | |
| SubSector: Information Technology Services | |
| MarketCap: 4077.48 Millions | |
| Recent Price: 13.95 Smart Investing & Trading Score: 37 | |
| Day Percent Change: -0.50% Day Change: -0.07 | |
| Week Change: 3.03% Year-to-date Change: -23.9% | |
| XRX Links: Profile News Message Board | |
| Charts:- Daily , Weekly | |
| Add XRX to Watchlist: View: Get Complete XRX Trend Analysis ➞ | |
 | YEXT Yext, Inc. |
| Sector: Technology | |
| SubSector: Internet Software & Services | |
| MarketCap: 1414.91 Millions | |
| Recent Price: 5.75 Smart Investing & Trading Score: 54 | |
| Day Percent Change: -0.52% Day Change: -0.03 | |
| Week Change: 5.31% Year-to-date Change: -2.4% | |
| YEXT Links: Profile News Message Board | |
| Charts:- Daily , Weekly | |
| Add YEXT to Watchlist: View: Get Complete YEXT Trend Analysis ➞ | |
 | PRGS Progress Software Corporation |
| Sector: Technology | |
| SubSector: Application Software | |
| MarketCap: 1407.22 Millions | |
| Recent Price: 51.42 Smart Investing & Trading Score: 57 | |
| Day Percent Change: -0.54% Day Change: -0.28 | |
| Week Change: 0.92% Year-to-date Change: -5.3% | |
| PRGS Links: Profile News Message Board | |
| Charts:- Daily , Weekly | |
| Add PRGS to Watchlist: View: Get Complete PRGS Trend Analysis ➞ | |
 | TWOU 2U, Inc. |
| Sector: Technology | |
| SubSector: Application Software | |
| MarketCap: 1090.12 Millions | |
| Recent Price: 0.34 Smart Investing & Trading Score: 44 | |
| Day Percent Change: -0.58% Day Change: 0.00 | |
| Week Change: 9.64% Year-to-date Change: -72.4% | |
| TWOU Links: Profile News Message Board | |
| Charts:- Daily , Weekly | |
| Add TWOU to Watchlist: View: Get Complete TWOU Trend Analysis ➞ | |
 | TENB Tenable Holdings, Inc. |
| Sector: Technology | |
| SubSector: Business Software & Services | |
| MarketCap: 1986.68 Millions | |
| Recent Price: 44.00 Smart Investing & Trading Score: 0 | |
| Day Percent Change: -0.59% Day Change: -0.26 | |
| Week Change: -1.98% Year-to-date Change: -4.5% | |
| TENB Links: Profile News Message Board | |
| Charts:- Daily , Weekly | |
| Add TENB to Watchlist: View: Get Complete TENB Trend Analysis ➞ | |
 | PINC Premier, Inc. |
| Sector: Technology | |
| SubSector: Healthcare Information Services | |
| MarketCap: 2044.85 Millions | |
| Recent Price: 19.66 Smart Investing & Trading Score: 28 | |
| Day Percent Change: -0.61% Day Change: -0.12 | |
| Week Change: 0.82% Year-to-date Change: -12.1% | |
| PINC Links: Profile News Message Board | |
| Charts:- Daily , Weekly | |
| Add PINC to Watchlist: View: Get Complete PINC Trend Analysis ➞ | |
 | NABL N-able, Inc. |
| Sector: Technology | |
| SubSector: Information Technology Services | |
| MarketCap: 2590 Millions | |
| Recent Price: 12.78 Smart Investing & Trading Score: 40 | |
| Day Percent Change: -0.62% Day Change: -0.08 | |
| Week Change: 1.11% Year-to-date Change: -4.0% | |
| NABL Links: Profile News Message Board | |
| Charts:- Daily , Weekly | |
| Add NABL to Watchlist: View: Get Complete NABL Trend Analysis ➞ | |
 | PEGA Pegasystems Inc. |
| Sector: Technology | |
| SubSector: Business Software & Services | |
| MarketCap: 5924.88 Millions | |
| Recent Price: 62.88 Smart Investing & Trading Score: 59 | |
| Day Percent Change: -0.63% Day Change: -0.40 | |
| Week Change: 2.31% Year-to-date Change: 28.7% | |
| PEGA Links: Profile News Message Board | |
| Charts:- Daily , Weekly | |
| Add PEGA to Watchlist: View: Get Complete PEGA Trend Analysis ➞ | |
 | RELY Remitly Global, Inc. |
| Sector: Technology | |
| SubSector: Software - Infrastructure | |
| MarketCap: 3320 Millions | |
| Recent Price: 14.11 Smart Investing & Trading Score: 71 | |
| Day Percent Change: -0.63% Day Change: -0.09 | |
| Week Change: -1.54% Year-to-date Change: -27.3% | |
| RELY Links: Profile News Message Board | |
| Charts:- Daily , Weekly | |
| Add RELY to Watchlist: View: Get Complete RELY Trend Analysis ➞ | |
 | ALTR Altair Engineering Inc. |
| Sector: Technology | |
| SubSector: Semiconductor - Specialized | |
| MarketCap: 2072.2 Millions | |
| Recent Price: 90.50 Smart Investing & Trading Score: 95 | |
| Day Percent Change: -0.64% Day Change: -0.58 | |
| Week Change: 5.96% Year-to-date Change: 7.6% | |
| ALTR Links: Profile News Message Board | |
| Charts:- Daily , Weekly | |
| Add ALTR to Watchlist: View: Get Complete ALTR Trend Analysis ➞ | |
 | APPN Appian Corporation |
| Sector: Technology | |
| SubSector: Application Software | |
| MarketCap: 2737.92 Millions | |
| Recent Price: 33.15 Smart Investing & Trading Score: 17 | |
| Day Percent Change: -0.66% Day Change: -0.22 | |
| Week Change: 3.43% Year-to-date Change: -12.0% | |
| APPN Links: Profile News Message Board | |
| Charts:- Daily , Weekly | |
| Add APPN to Watchlist: View: Get Complete APPN Trend Analysis ➞ | |
 | GBTG Global Business Travel Group, Inc. |
| Sector: Technology | |
| SubSector: Software - Application | |
| MarketCap: 3440 Millions | |
| Recent Price: 6.01 Smart Investing & Trading Score: 10 | |
| Day Percent Change: -0.66% Day Change: -0.04 | |
| Week Change: 0.5% Year-to-date Change: -8.0% | |
| GBTG Links: Profile News Message Board | |
| Charts:- Daily , Weekly | |
| Add GBTG to Watchlist: View: Get Complete GBTG Trend Analysis ➞ | |
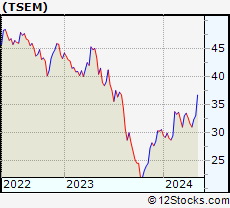 | TSEM Tower Semiconductor Ltd. |
| Sector: Technology | |
| SubSector: Semiconductor - Integrated Circuits | |
| MarketCap: 1745.1 Millions | |
| Recent Price: 36.71 Smart Investing & Trading Score: 83 | |
| Day Percent Change: -0.70% Day Change: -0.26 | |
| Week Change: 0% Year-to-date Change: 20.3% | |
| TSEM Links: Profile News Message Board | |
| Charts:- Daily , Weekly | |
| Add TSEM to Watchlist: View: Get Complete TSEM Trend Analysis ➞ | |
 | CIEN Ciena Corporation |
| Sector: Technology | |
| SubSector: Communication Equipment | |
| MarketCap: 6206.99 Millions | |
| Recent Price: 48.85 Smart Investing & Trading Score: 40 | |
| Day Percent Change: -0.71% Day Change: -0.35 | |
| Week Change: -0.51% Year-to-date Change: 8.5% | |
| CIEN Links: Profile News Message Board | |
| Charts:- Daily , Weekly | |
| Add CIEN to Watchlist: View: Get Complete CIEN Trend Analysis ➞ | |
 | MTSI MACOM Technology Solutions Holdings, Inc. |
| Sector: Technology | |
| SubSector: Semiconductor - Broad Line | |
| MarketCap: 1214.42 Millions | |
| Recent Price: 100.85 Smart Investing & Trading Score: 31 | |
| Day Percent Change: -0.74% Day Change: -0.75 | |
| Week Change: -1.07% Year-to-date Change: 8.5% | |
| MTSI Links: Profile News Message Board | |
| Charts:- Daily , Weekly | |
| Add MTSI to Watchlist: View: Get Complete MTSI Trend Analysis ➞ | |
 | DT Dynatrace, Inc. |
| Sector: Technology | |
| SubSector: Application Software | |
| MarketCap: 7007.12 Millions | |
| Recent Price: 48.10 Smart Investing & Trading Score: 57 | |
| Day Percent Change: -0.76% Day Change: -0.37 | |
| Week Change: 4.11% Year-to-date Change: -12.1% | |
| DT Links: Profile News Message Board | |
| Charts:- Daily , Weekly | |
| Add DT to Watchlist: View: Get Complete DT Trend Analysis ➞ | |
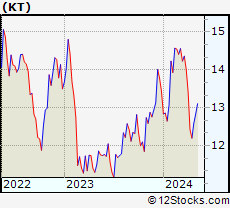 | KT KT Corporation |
| Sector: Technology | |
| SubSector: Telecom Services - Foreign | |
| MarketCap: 4216.89 Millions | |
| Recent Price: 13.74 Smart Investing & Trading Score: 62 | |
| Day Percent Change: -0.79% Day Change: -0.11 | |
| Week Change: 4.81% Year-to-date Change: 2.2% | |
| KT Links: Profile News Message Board | |
| Charts:- Daily , Weekly | |
| Add KT to Watchlist: View: Get Complete KT Trend Analysis ➞ | |
 | YOU Clear Secure, Inc. |
| Sector: Technology | |
| SubSector: Software - Application | |
| MarketCap: 3510 Millions | |
| Recent Price: 17.29 Smart Investing & Trading Score: 10 | |
| Day Percent Change: -0.80% Day Change: -0.14 | |
| Week Change: 1.95% Year-to-date Change: -16.6% | |
| YOU Links: Profile News Message Board | |
| Charts:- Daily , Weekly | |
| Add YOU to Watchlist: View: Get Complete YOU Trend Analysis ➞ | |
 | SY So-Young International Inc. |
| Sector: Technology | |
| SubSector: Healthcare Information Services | |
| MarketCap: 1000.55 Millions | |
| Recent Price: 1.23 Smart Investing & Trading Score: 31 | |
| Day Percent Change: -0.81% Day Change: -0.01 | |
| Week Change: -5.38% Year-to-date Change: -4.7% | |
| SY Links: Profile News Message Board | |
| Charts:- Daily , Weekly | |
| Add SY to Watchlist: View: Get Complete SY Trend Analysis ➞ | |
 | AMKR Amkor Technology, Inc. |
| Sector: Technology | |
| SubSector: Semiconductor - Integrated Circuits | |
| MarketCap: 1966.2 Millions | |
| Recent Price: 32.68 Smart Investing & Trading Score: 58 | |
| Day Percent Change: -0.82% Day Change: -0.27 | |
| Week Change: 0.15% Year-to-date Change: -1.8% | |
| AMKR Links: Profile News Message Board | |
| Charts:- Daily , Weekly | |
| Add AMKR to Watchlist: View: Get Complete AMKR Trend Analysis ➞ | |
| For tabular summary view of above stock list: Summary View ➞ 0 - 25 , 25 - 50 , 50 - 75 , 75 - 100 , 100 - 125 , 125 - 150 , 150 - 175 , 175 - 200 , 200 - 225 , 225 - 250 | ||
| Click To Change The Sort Order: By Market Cap or Company Size Performance: Year-to-date, Week and Day | |
| Select Chart Type: | ||
|
Best Stocks Today 12Stocks.com |
© 2024 12Stocks.com Terms & Conditions Privacy Contact Us
All Information Provided Only For Education And Not To Be Used For Investing or Trading. See Terms & Conditions


One More Thing ... Get Best Stocks Delivered Daily!
Never Ever Miss A Move With Our Top Ten Stocks Lists
Find Best Stocks In Any Market - Bull or Bear Market
Take A Peek At Our Top Ten Stocks Lists: Daily, Weekly, Year-to-Date & Top Trends
Find Best Stocks In Any Market - Bull or Bear Market
Take A Peek At Our Top Ten Stocks Lists: Daily, Weekly, Year-to-Date & Top Trends
Technology Stocks With Best Up Trends [0-bearish to 100-bullish]: Robinhood Markets[100], CommScope Holding[100], 36Kr [100], Cheetah Mobile[100], MicroStrategy [100], Amesite [100], Full Truck[100], Sea [100], GDS [100], JD.com [100], Bilibili [100]
Best Technology Stocks Year-to-Date:
MicroCloud Hologram[495.68%], Bakkt [413.9%], Uxin [355.06%], Smith Micro[229.3%], MediaCo Holding[223.94%], Super Micro[212.35%], MicroStrategy [150.86%], CXApp [136.29%], SoundHound AI[135.98%], AppLovin [107.29%], Cheetah Mobile[101.32%] Best Technology Stocks This Week:
Maxeon Solar[35.94%], MicroStrategy [34.23%], Presto Automation[29.52%], on [29.45%], LivePerson [27.75%], Viomi [27.4%], Uxin [27.09%], monday.com [25.9%], CommScope Holding[25.71%], SunPower [23.91%], Robinhood Markets[23.78%] Best Technology Stocks Daily:
Presto Automation[31.90%], Robinhood Markets[12.23%], CommScope Holding[11.86%], Ouster [11.23%], Arqit Quantum[10.89%], 36Kr [10.41%], Cheetah Mobile[10.34%], MicroStrategy [10.04%], Bakkt [9.25%], Amesite [8.96%], MicroCloud Hologram[8.38%]