
 Login Sign Up


| |||||
 |  | ||||

| 12Stocks.com Market Intelligence |
Best Tech Stocks
| In a hurry? Tech Stocks Lists: Performance & Trends, Stock Charts, FANG Stocks
Sort Tech stocks: Daily, Weekly, Year-to-Date, Market Cap & Trends. Filter Tech stocks list by size:All Tech Large Mid-Range Small and MicroCap |
| 12Stocks.com Tech Stocks Performances & Trends Daily | |||||||||
|
|  The overall Smart Investing & Trading Score is 78 (0-bearish to 100-bullish) which puts Technology sector in short term neutral to bullish trend. The Smart Investing & Trading Score from previous trading session is 90 and hence a deterioration of trend.
| ||||||||
Here are the Smart Investing & Trading Scores of the most requested Technology stocks at 12Stocks.com (click stock name for detailed review):
|


| 12Stocks.com: Investing in Technology sector with Stocks | |
|
The following table helps investors and traders sort through current performance and trends (as measured by Smart Investing & Trading Score) of various
stocks in the Tech sector. Quick View: Move mouse or cursor over stock symbol (ticker) to view short-term technical chart and over stock name to view long term chart. Click on  to add stock symbol to your watchlist and to add stock symbol to your watchlist and  to view watchlist. Click on any ticker or stock name for detailed market intelligence report for that stock. to view watchlist. Click on any ticker or stock name for detailed market intelligence report for that stock. |
12Stocks.com Performance of Stocks in Tech Sector
| Ticker | Stock Name | Watchlist | Category | Recent Price | Smart Investing & Trading Score | Change % | YTD Change% |
| IT | Gartner |   | IT | 450.26 | 57 | 0.55 | -0.19% |
| VRNT | Verint Systems | | Software | 32.09 | 68 | 0.53 | 18.72% |
| PSTG | Pure Storage | | Data Storage | 59.15 | 95 | 0.51 | 65.87% |
| VSH | Vishay Inter | | Semiconductor | 23.93 | 100 | 0.50 | -0.17% |
| FICO | Fair Isaac | | Software | 1411.35 | 95 | 0.49 | 21.25% |
| FLEX | Flex | | Circuit Boards | 29.30 | 95 | 0.48 | -3.81% |
| SRAD | Sportradar | | Software - | 10.65 | 100 | 0.47 | -4.48% |
| CVLT | Commvault Systems | | Software | 111.24 | 90 | 0.46 | 39.31% |
| PCTY | Paylocity Holding | | Software | 172.97 | 95 | 0.46 | 4.93% |
| BMI | Badger Meter | | Instruments | 197.21 | 90 | 0.45 | 27.75% |
| ITRI | Itron | | Instruments | 109.05 | 83 | 0.40 | 44.42% |
| VICR | Vicor | | Electronics | 33.70 | 52 | 0.39 | -25.01% |
| SNX | SYNNEX | | IT | 126.31 | 100 | 0.37 | 17.38% |
| HUBB | Hubbell | | Electronics | 392.74 | 38 | 0.36 | 19.40% |
| DSGX | Descartes Systems | | Software | 97.99 | 83 | 0.35 | 16.57% |
| WIX | Wix.com | | Internet | 135.68 | 57 | 0.35 | 10.29% |
| VEON | VEON | | Telecom | 25.84 | 54 | 0.35 | 31.17% |
| HCP | HashiCorp | | Software - Infrastructure | 33.04 | 78 | 0.33 | 36.98% |
| BRC | Brady | | Security Software | 60.56 | 71 | 0.33 | 3.19% |
| EVBG | Everbridge | | Software | 34.87 | 75 | 0.32 | 43.44% |
| ENFN | Enfusion | | Software - | 9.67 | 93 | 0.31 | -1.91% |
| ST | Sensata | | Instruments | 42.77 | 76 | 0.30 | 13.84% |
| CNXN | PC Connection | | Computers Wholesale | 67.99 | 90 | 0.30 | 1.16% |
| PYCR | Paycor HCM | | Software - | 14.03 | 18 | 0.29 | -35.23% |
| SMTC | Semtech | | Semiconductor | 39.95 | 78 | 0.28 | 82.34% |
| For chart view version of above stock list: Chart View ➞ 0 - 25 , 25 - 50 , 50 - 75 , 75 - 100 , 100 - 125 , 125 - 150 , 150 - 175 , 175 - 200 , 200 - 225 , 225 - 250 | ||
 | Click To Change The Sort Order: By Market Cap or Company Size Performance: Year-to-date, Week and Day |  |
|
Get the most comprehensive stock market coverage daily at 12Stocks.com ➞ Best Stocks Today ➞ Best Stocks Weekly ➞ Best Stocks Year-to-Date ➞ Best Stocks Trends ➞  Best Stocks Today 12Stocks.com Best Nasdaq Stocks ➞ Best S&P 500 Stocks ➞ Best Tech Stocks ➞ Best Biotech Stocks ➞ |
| Detailed Overview of Tech Stocks |
| Tech Technical Overview, Leaders & Laggards, Top Tech ETF Funds & Detailed Tech Stocks List, Charts, Trends & More |
| Tech Sector: Technical Analysis, Trends & YTD Performance | |
| Technology sector is composed of stocks
from semiconductors, software, web, social media
and services subsectors. Technology sector, as represented by XLK, an exchange-traded fund [ETF] that holds basket of tech stocks (e.g, Intel, Google) is up by 10.05% and is currently underperforming the overall market by -0.52% year-to-date. Below is a quick view of technical charts and trends: |
|
 XLK Weekly Chart |
|
| Long Term Trend: Very Good | |
| Medium Term Trend: Very Good | |
 XLK Daily Chart |
|
| Short Term Trend: Good | |
| Overall Trend Score: 78 | |
| YTD Performance: 10.05% | |
| **Trend Scores & Views Are Only For Educational Purposes And Not For Investing | |
| 12Stocks.com: Top Performing Technology Sector Stocks | ||||||||||||||||||||||||||||||||||||||||||||||||
 The top performing Technology sector stocks year to date are
Now, more recently, over last week, the top performing Technology sector stocks on the move are


|
||||||||||||||||||||||||||||||||||||||||||||||||
| 12Stocks.com: Investing in Tech Sector using Exchange Traded Funds | |
|
The following table shows list of key exchange traded funds (ETF) that
help investors track Tech Index. For detailed view, check out our ETF Funds section of our website. Quick View: Move mouse or cursor over ETF symbol (ticker) to view short-term technical chart and over ETF name to view long term chart. Click on ticker or stock name for detailed view. Click on to add stock symbol to your watchlist and to view watchlist. |
12Stocks.com List of ETFs that track Tech Index
| Ticker | ETF Name | Watchlist | Recent Price | Smart Investing & Trading Score | Change % | Week % | Year-to-date % |
| XLK | Technology | | 211.82 | 78 | -0.22 | 3.06 | 10.05% |
| QQQ | QQQ | | 451.76 | 78 | -0.62 | 2.19 | 10.31% |
| IYW | Technology | | 138.02 | 78 | -0.59 | 3.02 | 12.44% |
| VGT | Information Technology | | 532.55 | 78 | -1.02 | 3.16 | 10.03% |
| IXN | Global Tech | | 75.90 | 78 | -0.41 | 2.72 | 11.32% |
| IGV | Tech-Software | | 84.27 | 64 | 0.20 | 3.54 | 3.87% |
| XSD | Semiconductor | | 238.61 | 83 | 0.06 | 4.04 | 6.15% |
| TQQQ | QQQ | | 62.94 | 78 | -0.22 | 6.37 | 24.14% |
| SQQQ | Short QQQ | | 9.97 | 17 | 0.30 | -6.03 | -25.87% |
| SOXL | Semicondct Bull 3X | | 45.40 | 78 | -1.86 | 10.65 | 44.59% |
| SOXS | Semicondct Bear 3X | | 29.69 | 43 | 5.10 | -10.46 | 410.14% |
| SOXX | PHLX Semiconductor | | 228.24 | 78 | -1.68 | 3.63 | 18.85% |
| QTEC | First -100-Tech | | 190.75 | 65 | -0.78 | 3.23 | 8.71% |
| SMH | Semiconductor | | 230.25 | 78 | -0.84 | 3.11 | 31.67% |
| 12Stocks.com: Charts, Trends, Fundamental Data and Performances of Tech Stocks | |
|
We now take in-depth look at all Tech stocks including charts, multi-period performances and overall trends (as measured by Smart Investing & Trading Score). One can sort Tech stocks (click link to choose) by Daily, Weekly and by Year-to-Date performances. Also, one can sort by size of the company or by market capitalization. |
| Select Your Default Chart Type: | |||||
| |||||
| Click on stock symbol or name for detailed view. Click on to add stock symbol to your watchlist and to view watchlist. Quick View: Move mouse or cursor over "Daily" to quickly view daily technical stock chart and over "Weekly" to view weekly technical stock chart. | |||||


 | IT Gartner, Inc. |
| Sector: Technology | |
| SubSector: Information Technology Services | |
| MarketCap: 7767.98 Millions | |
| Recent Price: 450.26 Smart Investing & Trading Score: 57 | |
| Day Percent Change: 0.55% Day Change: 2.48 | |
| Week Change: 2.5% Year-to-date Change: -0.2% | |
| IT Links: Profile News Message Board | |
| Charts:- Daily , Weekly | |
| Add IT to Watchlist: View: Get Complete IT Trend Analysis ➞ | |
 | VRNT Verint Systems Inc. |
| Sector: Technology | |
| SubSector: Business Software & Services | |
| MarketCap: 2902.18 Millions | |
| Recent Price: 32.09 Smart Investing & Trading Score: 68 | |
| Day Percent Change: 0.53% Day Change: 0.17 | |
| Week Change: 3.95% Year-to-date Change: 18.7% | |
| VRNT Links: Profile News Message Board | |
| Charts:- Daily , Weekly | |
| Add VRNT to Watchlist: View: Get Complete VRNT Trend Analysis ➞ | |
 | PSTG Pure Storage, Inc. |
| Sector: Technology | |
| SubSector: Data Storage Devices | |
| MarketCap: 2993.99 Millions | |
| Recent Price: 59.15 Smart Investing & Trading Score: 95 | |
| Day Percent Change: 0.51% Day Change: 0.30 | |
| Week Change: 8.71% Year-to-date Change: 65.9% | |
| PSTG Links: Profile News Message Board | |
| Charts:- Daily , Weekly | |
| Add PSTG to Watchlist: View: Get Complete PSTG Trend Analysis ➞ | |
 | VSH Vishay Intertechnology, Inc. |
| Sector: Technology | |
| SubSector: Semiconductor - Broad Line | |
| MarketCap: 2132.52 Millions | |
| Recent Price: 23.93 Smart Investing & Trading Score: 100 | |
| Day Percent Change: 0.50% Day Change: 0.12 | |
| Week Change: 6.31% Year-to-date Change: -0.2% | |
| VSH Links: Profile News Message Board | |
| Charts:- Daily , Weekly | |
| Add VSH to Watchlist: View: Get Complete VSH Trend Analysis ➞ | |
 | FICO Fair Isaac Corporation |
| Sector: Technology | |
| SubSector: Business Software & Services | |
| MarketCap: 7930.98 Millions | |
| Recent Price: 1411.35 Smart Investing & Trading Score: 95 | |
| Day Percent Change: 0.49% Day Change: 6.92 | |
| Week Change: 6.23% Year-to-date Change: 21.3% | |
| FICO Links: Profile News Message Board | |
| Charts:- Daily , Weekly | |
| Add FICO to Watchlist: View: Get Complete FICO Trend Analysis ➞ | |
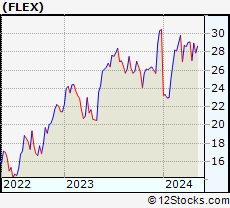 | FLEX Flex Ltd. |
| Sector: Technology | |
| SubSector: Printed Circuit Boards | |
| MarketCap: 3939.75 Millions | |
| Recent Price: 29.30 Smart Investing & Trading Score: 95 | |
| Day Percent Change: 0.48% Day Change: 0.14 | |
| Week Change: 2.23% Year-to-date Change: -3.8% | |
| FLEX Links: Profile News Message Board | |
| Charts:- Daily , Weekly | |
| Add FLEX to Watchlist: View: Get Complete FLEX Trend Analysis ➞ | |
 | SRAD Sportradar Group AG |
| Sector: Technology | |
| SubSector: Software - Application | |
| MarketCap: 3900 Millions | |
| Recent Price: 10.65 Smart Investing & Trading Score: 100 | |
| Day Percent Change: 0.47% Day Change: 0.05 | |
| Week Change: 15.01% Year-to-date Change: -4.5% | |
| SRAD Links: Profile News Message Board | |
| Charts:- Daily , Weekly | |
| Add SRAD to Watchlist: View: Get Complete SRAD Trend Analysis ➞ | |
 | CVLT Commvault Systems, Inc. |
| Sector: Technology | |
| SubSector: Application Software | |
| MarketCap: 1607.22 Millions | |
| Recent Price: 111.24 Smart Investing & Trading Score: 90 | |
| Day Percent Change: 0.46% Day Change: 0.51 | |
| Week Change: -0.07% Year-to-date Change: 39.3% | |
| CVLT Links: Profile News Message Board | |
| Charts:- Daily , Weekly | |
| Add CVLT to Watchlist: View: Get Complete CVLT Trend Analysis ➞ | |
 | PCTY Paylocity Holding Corporation |
| Sector: Technology | |
| SubSector: Application Software | |
| MarketCap: 4972.82 Millions | |
| Recent Price: 172.97 Smart Investing & Trading Score: 95 | |
| Day Percent Change: 0.46% Day Change: 0.80 | |
| Week Change: 5.71% Year-to-date Change: 4.9% | |
| PCTY Links: Profile News Message Board | |
| Charts:- Daily , Weekly | |
| Add PCTY to Watchlist: View: Get Complete PCTY Trend Analysis ➞ | |
 | BMI Badger Meter, Inc. |
| Sector: Technology | |
| SubSector: Scientific & Technical Instruments | |
| MarketCap: 1530.53 Millions | |
| Recent Price: 197.21 Smart Investing & Trading Score: 90 | |
| Day Percent Change: 0.45% Day Change: 0.88 | |
| Week Change: 0.42% Year-to-date Change: 27.8% | |
| BMI Links: Profile News Message Board | |
| Charts:- Daily , Weekly | |
| Add BMI to Watchlist: View: Get Complete BMI Trend Analysis ➞ | |
 | ITRI Itron, Inc. |
| Sector: Technology | |
| SubSector: Scientific & Technical Instruments | |
| MarketCap: 2222.23 Millions | |
| Recent Price: 109.05 Smart Investing & Trading Score: 83 | |
| Day Percent Change: 0.40% Day Change: 0.43 | |
| Week Change: 1.61% Year-to-date Change: 44.4% | |
| ITRI Links: Profile News Message Board | |
| Charts:- Daily , Weekly | |
| Add ITRI to Watchlist: View: Get Complete ITRI Trend Analysis ➞ | |
 | VICR Vicor Corporation |
| Sector: Technology | |
| SubSector: Diversified Electronics | |
| MarketCap: 1526.76 Millions | |
| Recent Price: 33.70 Smart Investing & Trading Score: 52 | |
| Day Percent Change: 0.39% Day Change: 0.13 | |
| Week Change: 2.21% Year-to-date Change: -25.0% | |
| VICR Links: Profile News Message Board | |
| Charts:- Daily , Weekly | |
| Add VICR to Watchlist: View: Get Complete VICR Trend Analysis ➞ | |
 | SNX SYNNEX Corporation |
| Sector: Technology | |
| SubSector: Information Technology Services | |
| MarketCap: 4519.48 Millions | |
| Recent Price: 126.31 Smart Investing & Trading Score: 100 | |
| Day Percent Change: 0.37% Day Change: 0.46 | |
| Week Change: 3.93% Year-to-date Change: 17.4% | |
| SNX Links: Profile News Message Board | |
| Charts:- Daily , Weekly | |
| Add SNX to Watchlist: View: Get Complete SNX Trend Analysis ➞ | |
 | HUBB Hubbell Incorporated |
| Sector: Technology | |
| SubSector: Diversified Electronics | |
| MarketCap: 6002.46 Millions | |
| Recent Price: 392.74 Smart Investing & Trading Score: 38 | |
| Day Percent Change: 0.36% Day Change: 1.41 | |
| Week Change: -3.57% Year-to-date Change: 19.4% | |
| HUBB Links: Profile News Message Board | |
| Charts:- Daily , Weekly | |
| Add HUBB to Watchlist: View: Get Complete HUBB Trend Analysis ➞ | |
 | DSGX The Descartes Systems Group Inc |
| Sector: Technology | |
| SubSector: Business Software & Services | |
| MarketCap: 2830.58 Millions | |
| Recent Price: 97.99 Smart Investing & Trading Score: 83 | |
| Day Percent Change: 0.35% Day Change: 0.34 | |
| Week Change: 0.64% Year-to-date Change: 16.6% | |
| DSGX Links: Profile News Message Board | |
| Charts:- Daily , Weekly | |
| Add DSGX to Watchlist: View: Get Complete DSGX Trend Analysis ➞ | |
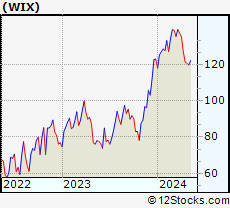 | WIX Wix.com Ltd. |
| Sector: Technology | |
| SubSector: Internet Information Providers | |
| MarketCap: 5459.9 Millions | |
| Recent Price: 135.68 Smart Investing & Trading Score: 57 | |
| Day Percent Change: 0.35% Day Change: 0.47 | |
| Week Change: 10.98% Year-to-date Change: 10.3% | |
| WIX Links: Profile News Message Board | |
| Charts:- Daily , Weekly | |
| Add WIX to Watchlist: View: Get Complete WIX Trend Analysis ➞ | |
 | VEON VEON Ltd. |
| Sector: Technology | |
| SubSector: Telecom Services - Foreign | |
| MarketCap: 2497.89 Millions | |
| Recent Price: 25.84 Smart Investing & Trading Score: 54 | |
| Day Percent Change: 0.35% Day Change: 0.09 | |
| Week Change: 1.89% Year-to-date Change: 31.2% | |
| VEON Links: Profile News Message Board | |
| Charts:- Daily , Weekly | |
| Add VEON to Watchlist: View: Get Complete VEON Trend Analysis ➞ | |
 | HCP HashiCorp, Inc. |
| Sector: Technology | |
| SubSector: Software - Infrastructure | |
| MarketCap: 5070 Millions | |
| Recent Price: 33.04 Smart Investing & Trading Score: 78 | |
| Day Percent Change: 0.33% Day Change: 0.11 | |
| Week Change: 0.73% Year-to-date Change: 37.0% | |
| HCP Links: Profile News Message Board | |
| Charts:- Daily , Weekly | |
| Add HCP to Watchlist: View: Get Complete HCP Trend Analysis ➞ | |
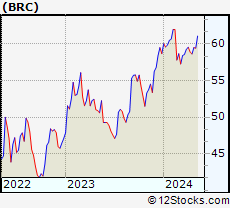 | BRC Brady Corporation |
| Sector: Technology | |
| SubSector: Security Software & Services | |
| MarketCap: 2266.57 Millions | |
| Recent Price: 60.56 Smart Investing & Trading Score: 71 | |
| Day Percent Change: 0.33% Day Change: 0.20 | |
| Week Change: -0.36% Year-to-date Change: 3.2% | |
| BRC Links: Profile News Message Board | |
| Charts:- Daily , Weekly | |
| Add BRC to Watchlist: View: Get Complete BRC Trend Analysis ➞ | |
 | EVBG Everbridge, Inc. |
| Sector: Technology | |
| SubSector: Application Software | |
| MarketCap: 3697.92 Millions | |
| Recent Price: 34.87 Smart Investing & Trading Score: 75 | |
| Day Percent Change: 0.32% Day Change: 0.11 | |
| Week Change: 0.37% Year-to-date Change: 43.4% | |
| EVBG Links: Profile News Message Board | |
| Charts:- Daily , Weekly | |
| Add EVBG to Watchlist: View: Get Complete EVBG Trend Analysis ➞ | |
 | ENFN Enfusion, Inc. |
| Sector: Technology | |
| SubSector: Software - Application | |
| MarketCap: 1290 Millions | |
| Recent Price: 9.67 Smart Investing & Trading Score: 93 | |
| Day Percent Change: 0.31% Day Change: 0.03 | |
| Week Change: 6.85% Year-to-date Change: -1.9% | |
| ENFN Links: Profile News Message Board | |
| Charts:- Daily , Weekly | |
| Add ENFN to Watchlist: View: Get Complete ENFN Trend Analysis ➞ | |
 | ST Sensata Technologies Holding plc |
| Sector: Technology | |
| SubSector: Scientific & Technical Instruments | |
| MarketCap: 4434.23 Millions | |
| Recent Price: 42.77 Smart Investing & Trading Score: 76 | |
| Day Percent Change: 0.30% Day Change: 0.13 | |
| Week Change: 1.02% Year-to-date Change: 13.8% | |
| ST Links: Profile News Message Board | |
| Charts:- Daily , Weekly | |
| Add ST to Watchlist: View: Get Complete ST Trend Analysis ➞ | |
 | CNXN PC Connection, Inc. |
| Sector: Technology | |
| SubSector: Computers Wholesale | |
| MarketCap: 1020.19 Millions | |
| Recent Price: 67.99 Smart Investing & Trading Score: 90 | |
| Day Percent Change: 0.30% Day Change: 0.20 | |
| Week Change: 4.66% Year-to-date Change: 1.2% | |
| CNXN Links: Profile News Message Board | |
| Charts:- Daily , Weekly | |
| Add CNXN to Watchlist: View: Get Complete CNXN Trend Analysis ➞ | |
 | PYCR Paycor HCM, Inc. |
| Sector: Technology | |
| SubSector: Software - Application | |
| MarketCap: 4220 Millions | |
| Recent Price: 14.03 Smart Investing & Trading Score: 18 | |
| Day Percent Change: 0.29% Day Change: 0.04 | |
| Week Change: -3.24% Year-to-date Change: -35.2% | |
| PYCR Links: Profile News Message Board | |
| Charts:- Daily , Weekly | |
| Add PYCR to Watchlist: View: Get Complete PYCR Trend Analysis ➞ | |
 | SMTC Semtech Corporation |
| Sector: Technology | |
| SubSector: Semiconductor - Integrated Circuits | |
| MarketCap: 2285 Millions | |
| Recent Price: 39.95 Smart Investing & Trading Score: 78 | |
| Day Percent Change: 0.28% Day Change: 0.11 | |
| Week Change: 0.91% Year-to-date Change: 82.3% | |
| SMTC Links: Profile News Message Board | |
| Charts:- Daily , Weekly | |
| Add SMTC to Watchlist: View: Get Complete SMTC Trend Analysis ➞ | |
| For tabular summary view of above stock list: Summary View ➞ 0 - 25 , 25 - 50 , 50 - 75 , 75 - 100 , 100 - 125 , 125 - 150 , 150 - 175 , 175 - 200 , 200 - 225 , 225 - 250 | ||
| Click To Change The Sort Order: By Market Cap or Company Size Performance: Year-to-date, Week and Day | |
| Select Chart Type: | ||
|
Best Stocks Today 12Stocks.com |
© 2024 12Stocks.com Terms & Conditions Privacy Contact Us
All Information Provided Only For Education And Not To Be Used For Investing or Trading. See Terms & Conditions


One More Thing ... Get Best Stocks Delivered Daily!
Never Ever Miss A Move With Our Top Ten Stocks Lists
Find Best Stocks In Any Market - Bull or Bear Market
Take A Peek At Our Top Ten Stocks Lists: Daily, Weekly, Year-to-Date & Top Trends
Find Best Stocks In Any Market - Bull or Bear Market
Take A Peek At Our Top Ten Stocks Lists: Daily, Weekly, Year-to-Date & Top Trends
Technology Stocks With Best Up Trends [0-bearish to 100-bullish]: Robinhood Markets[100], CommScope Holding[100], 36Kr [100], Cheetah Mobile[100], MicroStrategy [100], Amesite [100], Full Truck[100], Sea [100], GDS [100], JD.com [100], Bilibili [100]
Best Technology Stocks Year-to-Date:
MicroCloud Hologram[495.68%], Bakkt [413.9%], Uxin [355.06%], Smith Micro[229.3%], MediaCo Holding[223.94%], Super Micro[212.35%], MicroStrategy [150.86%], CXApp [136.29%], SoundHound AI[135.98%], AppLovin [107.29%], Cheetah Mobile[101.32%] Best Technology Stocks This Week:
Maxeon Solar[35.94%], MicroStrategy [34.23%], Presto Automation[29.52%], on [29.45%], LivePerson [27.75%], Viomi [27.4%], Uxin [27.09%], monday.com [25.9%], CommScope Holding[25.71%], SunPower [23.91%], Robinhood Markets[23.78%] Best Technology Stocks Daily:
Presto Automation[31.90%], Robinhood Markets[12.23%], CommScope Holding[11.86%], Ouster [11.23%], Arqit Quantum[10.89%], 36Kr [10.41%], Cheetah Mobile[10.34%], MicroStrategy [10.04%], Bakkt [9.25%], Amesite [8.96%], MicroCloud Hologram[8.38%]