
 Login Sign Up


| |||||
 |  | ||||

| 12Stocks.com Market Intelligence |
Best Tech Stocks
| In a hurry? Tech Stocks Lists: Performance & Trends, Stock Charts, FANG Stocks
Sort Tech stocks: Daily, Weekly, Year-to-Date, Market Cap & Trends. Filter Tech stocks list by size:All Tech Large Mid-Range Small and MicroCap |
| 12Stocks.com Tech Stocks Performances & Trends Daily | |||||||||
|
|  The overall Smart Investing & Trading Score is 64 (0-bearish to 100-bullish) which puts Technology sector in short term neutral to bullish trend. The Smart Investing & Trading Score from previous trading session is 49 and hence an improvement of trend.
| ||||||||
Here are the Smart Investing & Trading Scores of the most requested Technology stocks at 12Stocks.com (click stock name for detailed review):
|


| 12Stocks.com: Investing in Technology sector with Stocks | |
|
The following table helps investors and traders sort through current performance and trends (as measured by Smart Investing & Trading Score) of various
stocks in the Tech sector. Quick View: Move mouse or cursor over stock symbol (ticker) to view short-term technical chart and over stock name to view long term chart. Click on  to add stock symbol to your watchlist and to add stock symbol to your watchlist and  to view watchlist. Click on any ticker or stock name for detailed market intelligence report for that stock. to view watchlist. Click on any ticker or stock name for detailed market intelligence report for that stock. |
12Stocks.com Performance of Stocks in Tech Sector
| Ticker | Stock Name | Watchlist | Category | Recent Price | Smart Investing & Trading Score | Change % | YTD Change% |
| CLBT | Cellebrite DI |   | Software - Infrastructure | 11.19 | 54 | 3.61 | 30.12% |
| MSTR | MicroStrategy | | Software | 1266.98 | 85 | 3.60 | 100.59% |
| SPSC | SPS Commerce | | Software | 188.97 | 77 | 3.60 | -2.51% |
| CYBR | CyberArk Software | | Software | 235.51 | 25 | 3.60 | 7.51% |
| MPWR | Monolithic Power | | Semiconductor | 732.52 | 87 | 3.58 | 16.13% |
| RELY | Remitly Global | | Software - Infrastructure | 15.44 | 71 | 3.55 | -20.49% |
| FSLY | Fastly | | Software | 8.78 | 7 | 3.54 | -50.67% |
| CXM | Sprinklr | | Software - | 12.38 | 74 | 3.47 | 2.44% |
| IONQ | IonQ | | Computer Hardware | 9.29 | 59 | 3.39 | -25.47% |
| EGHT | 8x8 | | Communication | 2.31 | 69 | 3.36 | -39.02% |
| DUOL | Duolingo | | Software - | 248.31 | 95 | 3.35 | 8.97% |
| APPF | AppFolio | | Software | 247.08 | 77 | 3.33 | 42.62% |
| PSTG | Pure Storage | | Data Storage | 53.95 | 85 | 3.27 | 51.29% |
| PYCR | Paycor HCM | | Software - | 17.84 | 67 | 3.27 | -17.61% |
| OLED | Universal Display | | Semiconductor | 176.38 | 82 | 3.25 | -7.78% |
| NSIT | Insight Enterprises | | IT | 199.89 | 95 | 3.17 | 12.81% |
| DT | Dynatrace | | Software | 47.20 | 57 | 3.08 | -13.70% |
| ZUO | Zuora | | Software | 10.39 | 95 | 3.08 | 10.53% |
| G | Genpact | | IT | 32.29 | 74 | 3.03 | -6.97% |
| TTEC | TTEC | | IT | 7.89 | 52 | 3.00 | -63.59% |
| GWRE | Guidewire Software | | Software | 116.72 | 64 | 3.00 | 7.04% |
| AFRM | Affirm | | Software - Infrastructure | 36.00 | 64 | 3.00 | -26.47% |
| QLYS | Qualys | | Software | 170.28 | 57 | 2.97 | -13.25% |
| APPN | Appian | | Software | 32.93 | 7 | 2.97 | -12.56% |
| YEXT | Yext | | Internet | 5.60 | 40 | 2.94 | -4.92% |
| For chart view version of above stock list: Chart View ➞ 0 - 25 , 25 - 50 , 50 - 75 , 75 - 100 , 100 - 125 , 125 - 150 , 150 - 175 , 175 - 200 , 200 - 225 , 225 - 250 | ||
 | Click To Change The Sort Order: By Market Cap or Company Size Performance: Year-to-date, Week and Day |  |
|
Get the most comprehensive stock market coverage daily at 12Stocks.com ➞ Best Stocks Today ➞ Best Stocks Weekly ➞ Best Stocks Year-to-Date ➞ Best Stocks Trends ➞  Best Stocks Today 12Stocks.com Best Nasdaq Stocks ➞ Best S&P 500 Stocks ➞ Best Tech Stocks ➞ Best Biotech Stocks ➞ |
| Detailed Overview of Tech Stocks |
| Tech Technical Overview, Leaders & Laggards, Top Tech ETF Funds & Detailed Tech Stocks List, Charts, Trends & More |
| Tech Sector: Technical Analysis, Trends & YTD Performance | |
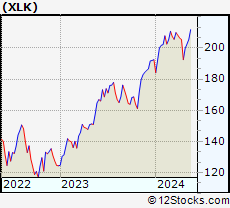
| Technology sector is composed of stocks
from semiconductors, software, web, social media
and services subsectors. Technology sector, as represented by XLK, an exchange-traded fund [ETF] that holds basket of tech stocks (e.g, Intel, Google) is up by 6.47% and is currently underperforming the overall market by -1.55% year-to-date. Below is a quick view of technical charts and trends: |
|
 XLK Weekly Chart |
|
| Long Term Trend: Not Good | |
| Medium Term Trend: Very Good | |
 XLK Daily Chart |
|
| Short Term Trend: Very Good | |
| Overall Trend Score: 64 | |
| YTD Performance: 6.47% | |
| **Trend Scores & Views Are Only For Educational Purposes And Not For Investing | |
| 12Stocks.com: Top Performing Technology Sector Stocks | ||||||||||||||||||||||||||||||||||||||||||||||||
 The top performing Technology sector stocks year to date are
Now, more recently, over last week, the top performing Technology sector stocks on the move are


|
||||||||||||||||||||||||||||||||||||||||||||||||
| 12Stocks.com: Investing in Tech Sector using Exchange Traded Funds | |
|
The following table shows list of key exchange traded funds (ETF) that
help investors track Tech Index. For detailed view, check out our ETF Funds section of our website. Quick View: Move mouse or cursor over ETF symbol (ticker) to view short-term technical chart and over ETF name to view long term chart. Click on ticker or stock name for detailed view. Click on to add stock symbol to your watchlist and to view watchlist. |
12Stocks.com List of ETFs that track Tech Index
| Ticker | ETF Name | Watchlist | Recent Price | Smart Investing & Trading Score | Change % | Week % | Year-to-date % |
| XLK | Technology | | 204.93 | 64 | 1.18 | 1.18 | 6.47% |
| QQQ | QQQ | | 440.30 | 77 | 1.11 | 1.11 | 7.52% |
| IYW | Technology | | 134.23 | 77 | 1.56 | 1.56 | 9.35% |
| VGT | Information Technology | | 516.83 | 29 | 1.45 | 1.45 | 6.78% |
| IXN | Global Tech | | 73.87 | 77 | 1.39 | 1.39 | 8.35% |
| IGV | Tech-Software | | 81.99 | 29 | 1.38 | 1.38 | 1.06% |
| XSD | Semiconductor | | 230.00 | 100 | 1.72 | 1.72 | 2.32% |
| TQQQ | QQQ | | 58.58 | 64 | 3.31 | 3.31 | 15.53% |
| SQQQ | Short QQQ | | 10.71 | 0 | -3.34 | -3.34 | -20.37% |
| SOXL | Semicondct Bull 3X | | 41.30 | 64 | 5.98 | 5.98 | 31.53% |
| SOXS | Semicondct Bear 3X | | 33.01 | 31 | -6.01 | -6.01 | 467.18% |
| SOXX | PHLX Semiconductor | | 220.61 | 42 | 2.05 | 2.05 | 14.88% |
| QTEC | First -100-Tech | | 184.97 | 64 | 1.22 | 1.22 | 5.42% |
| SMH | Semiconductor | | 222.67 | 95 | 2.27 | 2.27 | 27.33% |
| 12Stocks.com: Charts, Trends, Fundamental Data and Performances of Tech Stocks | |
|
We now take in-depth look at all Tech stocks including charts, multi-period performances and overall trends (as measured by Smart Investing & Trading Score). One can sort Tech stocks (click link to choose) by Daily, Weekly and by Year-to-Date performances. Also, one can sort by size of the company or by market capitalization. |
| Select Your Default Chart Type: | |||||
| |||||
| Click on stock symbol or name for detailed view. Click on to add stock symbol to your watchlist and to view watchlist. Quick View: Move mouse or cursor over "Daily" to quickly view daily technical stock chart and over "Weekly" to view weekly technical stock chart. | |||||


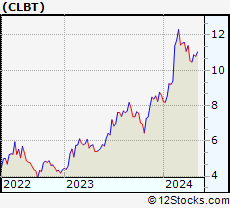 | CLBT Cellebrite DI Ltd. |
| Sector: Technology | |
| SubSector: Software - Infrastructure | |
| MarketCap: 1370 Millions | |
| Recent Price: 11.19 Smart Investing & Trading Score: 54 | |
| Day Percent Change: 3.61% Day Change: 0.39 | |
| Week Change: 3.61% Year-to-date Change: 30.1% | |
| CLBT Links: Profile News Message Board | |
| Charts:- Daily , Weekly | |
| Add CLBT to Watchlist: View: Get Complete CLBT Trend Analysis ➞ | |
 | MSTR MicroStrategy Incorporated |
| Sector: Technology | |
| SubSector: Application Software | |
| MarketCap: 1164.52 Millions | |
| Recent Price: 1266.98 Smart Investing & Trading Score: 85 | |
| Day Percent Change: 3.60% Day Change: 43.97 | |
| Week Change: 3.6% Year-to-date Change: 100.6% | |
| MSTR Links: Profile News Message Board | |
| Charts:- Daily , Weekly | |
| Add MSTR to Watchlist: View: Get Complete MSTR Trend Analysis ➞ | |
 | SPSC SPS Commerce, Inc. |
| Sector: Technology | |
| SubSector: Application Software | |
| MarketCap: 1398.02 Millions | |
| Recent Price: 188.97 Smart Investing & Trading Score: 77 | |
| Day Percent Change: 3.60% Day Change: 6.56 | |
| Week Change: 3.6% Year-to-date Change: -2.5% | |
| SPSC Links: Profile News Message Board | |
| Charts:- Daily , Weekly | |
| Add SPSC to Watchlist: View: Get Complete SPSC Trend Analysis ➞ | |
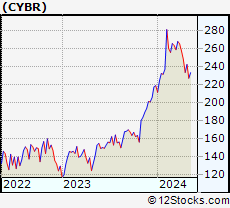 | CYBR CyberArk Software Ltd. |
| Sector: Technology | |
| SubSector: Business Software & Services | |
| MarketCap: 3223.58 Millions | |
| Recent Price: 235.51 Smart Investing & Trading Score: 25 | |
| Day Percent Change: 3.60% Day Change: 8.19 | |
| Week Change: 3.6% Year-to-date Change: 7.5% | |
| CYBR Links: Profile News Message Board | |
| Charts:- Daily , Weekly | |
| Add CYBR to Watchlist: View: Get Complete CYBR Trend Analysis ➞ | |
 | MPWR Monolithic Power Systems, Inc. |
| Sector: Technology | |
| SubSector: Semiconductor - Specialized | |
| MarketCap: 6436.4 Millions | |
| Recent Price: 732.52 Smart Investing & Trading Score: 87 | |
| Day Percent Change: 3.58% Day Change: 25.30 | |
| Week Change: 3.58% Year-to-date Change: 16.1% | |
| MPWR Links: Profile News Message Board | |
| Charts:- Daily , Weekly | |
| Add MPWR to Watchlist: View: Get Complete MPWR Trend Analysis ➞ | |
 | RELY Remitly Global, Inc. |
| Sector: Technology | |
| SubSector: Software - Infrastructure | |
| MarketCap: 3320 Millions | |
| Recent Price: 15.44 Smart Investing & Trading Score: 71 | |
| Day Percent Change: 3.55% Day Change: 0.53 | |
| Week Change: 3.55% Year-to-date Change: -20.5% | |
| RELY Links: Profile News Message Board | |
| Charts:- Daily , Weekly | |
| Add RELY to Watchlist: View: Get Complete RELY Trend Analysis ➞ | |
 | FSLY Fastly, Inc. |
| Sector: Technology | |
| SubSector: Application Software | |
| MarketCap: 1973.72 Millions | |
| Recent Price: 8.78 Smart Investing & Trading Score: 7 | |
| Day Percent Change: 3.54% Day Change: 0.30 | |
| Week Change: 3.54% Year-to-date Change: -50.7% | |
| FSLY Links: Profile News Message Board | |
| Charts:- Daily , Weekly | |
| Add FSLY to Watchlist: View: Get Complete FSLY Trend Analysis ➞ | |
 | CXM Sprinklr, Inc. |
| Sector: Technology | |
| SubSector: Software - Application | |
| MarketCap: 3700 Millions | |
| Recent Price: 12.38 Smart Investing & Trading Score: 74 | |
| Day Percent Change: 3.47% Day Change: 0.42 | |
| Week Change: 3.47% Year-to-date Change: 2.4% | |
| CXM Links: Profile News Message Board | |
| Charts:- Daily , Weekly | |
| Add CXM to Watchlist: View: Get Complete CXM Trend Analysis ➞ | |
 | IONQ IonQ, Inc. |
| Sector: Technology | |
| SubSector: Computer Hardware | |
| MarketCap: 2680 Millions | |
| Recent Price: 9.29 Smart Investing & Trading Score: 59 | |
| Day Percent Change: 3.39% Day Change: 0.30 | |
| Week Change: 3.39% Year-to-date Change: -25.5% | |
| IONQ Links: Profile News Message Board | |
| Charts:- Daily , Weekly | |
| Add IONQ to Watchlist: View: Get Complete IONQ Trend Analysis ➞ | |
 | EGHT 8x8, Inc. |
| Sector: Technology | |
| SubSector: Diversified Communication Services | |
| MarketCap: 1861.64 Millions | |
| Recent Price: 2.31 Smart Investing & Trading Score: 69 | |
| Day Percent Change: 3.36% Day Change: 0.08 | |
| Week Change: 3.36% Year-to-date Change: -39.0% | |
| EGHT Links: Profile News Message Board | |
| Charts:- Daily , Weekly | |
| Add EGHT to Watchlist: View: Get Complete EGHT Trend Analysis ➞ | |
 | DUOL Duolingo, Inc. |
| Sector: Technology | |
| SubSector: Software - Application | |
| MarketCap: 6070 Millions | |
| Recent Price: 248.31 Smart Investing & Trading Score: 95 | |
| Day Percent Change: 3.35% Day Change: 8.06 | |
| Week Change: 3.35% Year-to-date Change: 9.0% | |
| DUOL Links: Profile News Message Board | |
| Charts:- Daily , Weekly | |
| Add DUOL to Watchlist: View: Get Complete DUOL Trend Analysis ➞ | |
 | APPF AppFolio, Inc. |
| Sector: Technology | |
| SubSector: Application Software | |
| MarketCap: 3412.02 Millions | |
| Recent Price: 247.08 Smart Investing & Trading Score: 77 | |
| Day Percent Change: 3.33% Day Change: 7.97 | |
| Week Change: 3.33% Year-to-date Change: 42.6% | |
| APPF Links: Profile News Message Board | |
| Charts:- Daily , Weekly | |
| Add APPF to Watchlist: View: Get Complete APPF Trend Analysis ➞ | |
 | PSTG Pure Storage, Inc. |
| Sector: Technology | |
| SubSector: Data Storage Devices | |
| MarketCap: 2993.99 Millions | |
| Recent Price: 53.95 Smart Investing & Trading Score: 85 | |
| Day Percent Change: 3.27% Day Change: 1.71 | |
| Week Change: 3.27% Year-to-date Change: 51.3% | |
| PSTG Links: Profile News Message Board | |
| Charts:- Daily , Weekly | |
| Add PSTG to Watchlist: View: Get Complete PSTG Trend Analysis ➞ | |
 | PYCR Paycor HCM, Inc. |
| Sector: Technology | |
| SubSector: Software - Application | |
| MarketCap: 4220 Millions | |
| Recent Price: 17.84 Smart Investing & Trading Score: 67 | |
| Day Percent Change: 3.27% Day Change: 0.56 | |
| Week Change: 3.27% Year-to-date Change: -17.6% | |
| PYCR Links: Profile News Message Board | |
| Charts:- Daily , Weekly | |
| Add PYCR to Watchlist: View: Get Complete PYCR Trend Analysis ➞ | |
 | OLED Universal Display Corporation |
| Sector: Technology | |
| SubSector: Semiconductor Equipment & Materials | |
| MarketCap: 5660.08 Millions | |
| Recent Price: 176.38 Smart Investing & Trading Score: 82 | |
| Day Percent Change: 3.25% Day Change: 5.56 | |
| Week Change: 3.25% Year-to-date Change: -7.8% | |
| OLED Links: Profile News Message Board | |
| Charts:- Daily , Weekly | |
| Add OLED to Watchlist: View: Get Complete OLED Trend Analysis ➞ | |
 | NSIT Insight Enterprises, Inc. |
| Sector: Technology | |
| SubSector: Information Technology Services | |
| MarketCap: 1498.48 Millions | |
| Recent Price: 199.89 Smart Investing & Trading Score: 95 | |
| Day Percent Change: 3.17% Day Change: 6.15 | |
| Week Change: 3.17% Year-to-date Change: 12.8% | |
| NSIT Links: Profile News Message Board | |
| Charts:- Daily , Weekly | |
| Add NSIT to Watchlist: View: Get Complete NSIT Trend Analysis ➞ | |
 | DT Dynatrace, Inc. |
| Sector: Technology | |
| SubSector: Application Software | |
| MarketCap: 7007.12 Millions | |
| Recent Price: 47.20 Smart Investing & Trading Score: 57 | |
| Day Percent Change: 3.08% Day Change: 1.41 | |
| Week Change: 3.08% Year-to-date Change: -13.7% | |
| DT Links: Profile News Message Board | |
| Charts:- Daily , Weekly | |
| Add DT to Watchlist: View: Get Complete DT Trend Analysis ➞ | |
 | ZUO Zuora, Inc. |
| Sector: Technology | |
| SubSector: Application Software | |
| MarketCap: 1063.22 Millions | |
| Recent Price: 10.39 Smart Investing & Trading Score: 95 | |
| Day Percent Change: 3.08% Day Change: 0.31 | |
| Week Change: 3.08% Year-to-date Change: 10.5% | |
| ZUO Links: Profile News Message Board | |
| Charts:- Daily , Weekly | |
| Add ZUO to Watchlist: View: Get Complete ZUO Trend Analysis ➞ | |
 | G Genpact Limited |
| Sector: Technology | |
| SubSector: Information Technology Services | |
| MarketCap: 5485.78 Millions | |
| Recent Price: 32.29 Smart Investing & Trading Score: 74 | |
| Day Percent Change: 3.03% Day Change: 0.95 | |
| Week Change: 3.03% Year-to-date Change: -7.0% | |
| G Links: Profile News Message Board | |
| Charts:- Daily , Weekly | |
| Add G to Watchlist: View: Get Complete G Trend Analysis ➞ | |
 | TTEC TTEC Holdings, Inc. |
| Sector: Technology | |
| SubSector: Information Technology Services | |
| MarketCap: 1528.48 Millions | |
| Recent Price: 7.89 Smart Investing & Trading Score: 52 | |
| Day Percent Change: 3.00% Day Change: 0.23 | |
| Week Change: 3% Year-to-date Change: -63.6% | |
| TTEC Links: Profile News Message Board | |
| Charts:- Daily , Weekly | |
| Add TTEC to Watchlist: View: Get Complete TTEC Trend Analysis ➞ | |
 | GWRE Guidewire Software, Inc. |
| Sector: Technology | |
| SubSector: Business Software & Services | |
| MarketCap: 7073.18 Millions | |
| Recent Price: 116.72 Smart Investing & Trading Score: 64 | |
| Day Percent Change: 3.00% Day Change: 3.40 | |
| Week Change: 3% Year-to-date Change: 7.0% | |
| GWRE Links: Profile News Message Board | |
| Charts:- Daily , Weekly | |
| Add GWRE to Watchlist: View: Get Complete GWRE Trend Analysis ➞ | |
 | AFRM Affirm Holdings, Inc. |
| Sector: Technology | |
| SubSector: Software - Infrastructure | |
| MarketCap: 4560 Millions | |
| Recent Price: 36.00 Smart Investing & Trading Score: 64 | |
| Day Percent Change: 3.00% Day Change: 1.05 | |
| Week Change: 3% Year-to-date Change: -26.5% | |
| AFRM Links: Profile News Message Board | |
| Charts:- Daily , Weekly | |
| Add AFRM to Watchlist: View: Get Complete AFRM Trend Analysis ➞ | |
 | QLYS Qualys, Inc. |
| Sector: Technology | |
| SubSector: Application Software | |
| MarketCap: 3475.02 Millions | |
| Recent Price: 170.28 Smart Investing & Trading Score: 57 | |
| Day Percent Change: 2.97% Day Change: 4.91 | |
| Week Change: 2.97% Year-to-date Change: -13.3% | |
| QLYS Links: Profile News Message Board | |
| Charts:- Daily , Weekly | |
| Add QLYS to Watchlist: View: Get Complete QLYS Trend Analysis ➞ | |
 | APPN Appian Corporation |
| Sector: Technology | |
| SubSector: Application Software | |
| MarketCap: 2737.92 Millions | |
| Recent Price: 32.93 Smart Investing & Trading Score: 7 | |
| Day Percent Change: 2.97% Day Change: 0.95 | |
| Week Change: 2.97% Year-to-date Change: -12.6% | |
| APPN Links: Profile News Message Board | |
| Charts:- Daily , Weekly | |
| Add APPN to Watchlist: View: Get Complete APPN Trend Analysis ➞ | |
 | YEXT Yext, Inc. |
| Sector: Technology | |
| SubSector: Internet Software & Services | |
| MarketCap: 1414.91 Millions | |
| Recent Price: 5.60 Smart Investing & Trading Score: 40 | |
| Day Percent Change: 2.94% Day Change: 0.16 | |
| Week Change: 2.94% Year-to-date Change: -4.9% | |
| YEXT Links: Profile News Message Board | |
| Charts:- Daily , Weekly | |
| Add YEXT to Watchlist: View: Get Complete YEXT Trend Analysis ➞ | |
| For tabular summary view of above stock list: Summary View ➞ 0 - 25 , 25 - 50 , 50 - 75 , 75 - 100 , 100 - 125 , 125 - 150 , 150 - 175 , 175 - 200 , 200 - 225 , 225 - 250 | ||
| Click To Change The Sort Order: By Market Cap or Company Size Performance: Year-to-date, Week and Day | |
| Select Chart Type: | ||
|
Best Stocks Today 12Stocks.com |
© 2024 12Stocks.com Terms & Conditions Privacy Contact Us
All Information Provided Only For Education And Not To Be Used For Investing or Trading. See Terms & Conditions


One More Thing ... Get Best Stocks Delivered Daily!
Never Ever Miss A Move With Our Top Ten Stocks Lists
Find Best Stocks In Any Market - Bull or Bear Market
Take A Peek At Our Top Ten Stocks Lists: Daily, Weekly, Year-to-Date & Top Trends
Find Best Stocks In Any Market - Bull or Bear Market
Take A Peek At Our Top Ten Stocks Lists: Daily, Weekly, Year-to-Date & Top Trends
Technology Stocks With Best Up Trends [0-bearish to 100-bullish]: Perficient [100], GigaCloud [100], Universal Electronics[100], Silicon Motion[100], Benchmark Electronics[100], Onto Innovation[100], Arlo [100], Warner Music[100], Red Violet[100], NetApp [100], Jamf Holding[100]
Best Technology Stocks Year-to-Date:
MicroCloud Hologram[498.56%], MediaCo Holding[383.57%], Smith Micro[214.77%], Bakkt [197.53%], CXApp [194.21%], Super Micro[192.28%], Uxin [191.01%], SoundHound AI[142.99%], CuriosityStream [125.88%], GigaCloud [124.6%], MicroStrategy [100.59%] Best Technology Stocks This Week:
Perficient [52.24%], Arteris [32.26%], Upland Software[23.55%], SoundHound AI[19.54%], CXApp [14.07%], GigaCloud [13.95%], Thoughtworks Holding[12%], Universal Electronics[11.94%], SYLA [11.42%], Smith Micro[11.11%], Telephone and[9.33%] Best Technology Stocks Daily:
Perficient [52.24%], Arteris [32.26%], Upland Software[23.55%], SoundHound AI[19.54%], CXApp [14.07%], GigaCloud [13.95%], Thoughtworks Holding[12.00%], Universal Electronics[11.94%], SYLA [11.42%], Smith Micro[11.11%], Telephone and[9.33%]