
 Login Sign Up


| |||||
 |  | ||||

| 12Stocks.com Market Intelligence |
Best Tech Stocks
| In a hurry? Tech Stocks Lists: Performance & Trends, Stock Charts, FANG Stocks
Sort Tech stocks: Daily, Weekly, Year-to-Date, Market Cap & Trends. Filter Tech stocks list by size:All Tech Large Mid-Range Small and MicroCap |
| 12Stocks.com Tech Stocks Performances & Trends Daily | |||||||||
|
|  The overall Smart Investing & Trading Score is 38 (0-bearish to 100-bullish) which puts Technology sector in short term bearish to neutral trend. The Smart Investing & Trading Score from previous trading session is 45 and hence a deterioration of trend.
| ||||||||
Here are the Smart Investing & Trading Scores of the most requested Technology stocks at 12Stocks.com (click stock name for detailed review):
|


| 12Stocks.com: Investing in Technology sector with Stocks | |
|
The following table helps investors and traders sort through current performance and trends (as measured by Smart Investing & Trading Score) of various
stocks in the Tech sector. Quick View: Move mouse or cursor over stock symbol (ticker) to view short-term technical chart and over stock name to view long term chart. Click on  to add stock symbol to your watchlist and to add stock symbol to your watchlist and  to view watchlist. Click on any ticker or stock name for detailed market intelligence report for that stock. to view watchlist. Click on any ticker or stock name for detailed market intelligence report for that stock. |
12Stocks.com Performance of Stocks in Tech Sector
| Ticker | Stock Name | Watchlist | Category | Recent Price | Smart Investing & Trading Score | Change % | YTD Change% |
| API | Agora |   | Software | 2.48 | 42 | -0.80 | -6.06% |
| DQ | Daqo New | | Semiconductor | 23.56 | 68 | -0.80 | -11.43% |
| EGAN | eGain | | Software | 6.18 | 42 | -0.80 | -25.81% |
| ORAN | Orange S.A | | Telecom | 11.23 | 7 | -0.80 | -1.75% |
| VSH | Vishay Inter | | Semiconductor | 22.10 | 100 | -0.81 | -7.80% |
| CLFD | Clearfield | | Communication | 29.36 | 68 | -0.81 | 0.96% |
| GDS | GDS | | Data Storage | 7.20 | 85 | -0.83 | -21.05% |
| SILC | Silicom | | Communication | 15.38 | 69 | -0.84 | -15.03% |
| PATH | UiPath | | Software - Infrastructure | 19.41 | 18 | -0.84 | -21.91% |
| MDB | MongoDB | | Software | 366.17 | 32 | -0.84 | -10.44% |
| ALRM | Alarm.com | | Software | 65.23 | 51 | -0.85 | 0.94% |
| CNXN | PC Connection | | Computers Wholesale | 64.43 | 55 | -0.85 | -4.14% |
| IONQ | IonQ | | Computer Hardware | 8.18 | 42 | -0.85 | -34.38% |
| WOW | WideOpenWest | | CATV | 3.46 | 15 | -0.86 | -14.57% |
| UI | Ubiquiti | | Communication | 107.83 | 35 | -0.86 | -22.74% |
| KC | Kingsoft Cloud | | Software | 2.88 | 73 | -0.86 | -24.04% |
| LOGI | Logitech | | Computer | 78.72 | 18 | -0.87 | -17.19% |
| CCSI | Consensus Cloud | | Software - Infrastructure | 12.47 | 30 | -0.87 | -53.18% |
| EXLS | ExlService | | IT | 29.31 | 35 | -0.88 | -4.99% |
| AUR | Aurora Innovation | | IT | 2.82 | 5 | -0.88 | -35.98% |
| OKTA | Okta | | Software | 92.93 | 41 | -0.89 | 2.65% |
| ONTF | ON24 | | Software - | 6.66 | 40 | -0.89 | -15.54% |
| FARO | FARO | | Instruments | 18.45 | 23 | -0.91 | -18.11% |
| PWSC | PowerSchool | | Software - | 17.38 | 10 | -0.91 | -26.48% |
| UEIC | Universal Electronics | | Electronic | 9.71 | 36 | -0.92 | 3.41% |
| For chart view version of above stock list: Chart View ➞ 0 - 25 , 25 - 50 , 50 - 75 , 75 - 100 , 100 - 125 , 125 - 150 , 150 - 175 , 175 - 200 , 200 - 225 , 225 - 250 , 250 - 275 , 275 - 300 , 300 - 325 , 325 - 350 , 350 - 375 , 375 - 400 , 400 - 425 , 425 - 450 , 450 - 475 , 475 - 500 , 500 - 525 , 525 - 550 , 550 - 575 , 575 - 600 , 600 - 625 , 625 - 650 | ||
 | Click To Change The Sort Order: By Market Cap or Company Size Performance: Year-to-date, Week and Day |  |
|
Get the most comprehensive stock market coverage daily at 12Stocks.com ➞ Best Stocks Today ➞ Best Stocks Weekly ➞ Best Stocks Year-to-Date ➞ Best Stocks Trends ➞  Best Stocks Today 12Stocks.com Best Nasdaq Stocks ➞ Best S&P 500 Stocks ➞ Best Tech Stocks ➞ Best Biotech Stocks ➞ |
| Detailed Overview of Tech Stocks |
| Tech Technical Overview, Leaders & Laggards, Top Tech ETF Funds & Detailed Tech Stocks List, Charts, Trends & More |
| Tech Sector: Technical Analysis, Trends & YTD Performance | |
| Technology sector is composed of stocks
from semiconductors, software, web, social media
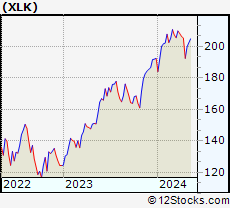
and services subsectors. Technology sector, as represented by XLK, an exchange-traded fund [ETF] that holds basket of tech stocks (e.g, Intel, Google) is up by 2.66% and is currently underperforming the overall market by -2.5% year-to-date. Below is a quick view of technical charts and trends: |
|
 XLK Weekly Chart |
|
| Long Term Trend: Not Good | |
| Medium Term Trend: Not Good | |
 XLK Daily Chart |
|
| Short Term Trend: Very Good | |
| Overall Trend Score: 38 | |
| YTD Performance: 2.66% | |
| **Trend Scores & Views Are Only For Educational Purposes And Not For Investing | |
| 12Stocks.com: Top Performing Technology Sector Stocks | ||||||||||||||||||||||||||||||||||||||||||||||||
 The top performing Technology sector stocks year to date are
Now, more recently, over last week, the top performing Technology sector stocks on the move are


|
||||||||||||||||||||||||||||||||||||||||||||||||
| 12Stocks.com: Investing in Tech Sector using Exchange Traded Funds | |
|
The following table shows list of key exchange traded funds (ETF) that
help investors track Tech Index. For detailed view, check out our ETF Funds section of our website. Quick View: Move mouse or cursor over ETF symbol (ticker) to view short-term technical chart and over ETF name to view long term chart. Click on ticker or stock name for detailed view. Click on to add stock symbol to your watchlist and to view watchlist. |
12Stocks.com List of ETFs that track Tech Index
| Ticker | ETF Name | Watchlist | Recent Price | Smart Investing & Trading Score | Change % | Week % | Year-to-date % |
| XLK | Technology | | 197.60 | 38 | -0.22 | 2.63 | 2.66% |
| QQQ | QQQ | | 424.45 | 51 | -0.48 | 2.36 | 3.65% |
| IYW | Technology | | 128.20 | 51 | -0.50 | 2.77 | 4.44% |
| VGT | Information Technology | | 495.44 | 38 | 0.04 | 3.24 | 2.36% |
| IXN | Global Tech | | 70.75 | 36 | -0.13 | 2.95 | 3.77% |
| IGV | Tech-Software | | 80.19 | 25 | -0.93 | 2.11 | -1.16% |
| XSD | Semiconductor | | 220.63 | 30 | 2.36 | 8.39 | -1.85% |
| TQQQ | QQQ | | 52.85 | 38 | -1.60 | 6.81 | 4.24% |
| SQQQ | Short QQQ | | 12.00 | 44 | 1.61 | -6.54 | -10.78% |
| SOXL | Semicondct Bull 3X | | 37.41 | 58 | 5.41 | 21.5 | 19.14% |
| SOXS | Semicondct Bear 3X | | 37.44 | 51 | -5.48 | -18.84 | 543.3% |
| SOXX | PHLX Semiconductor | | 212.41 | 51 | 1.86 | 7.07 | 10.61% |
| QTEC | First -100-Tech | | 181.18 | 51 | 0.02 | 4.16 | 3.25% |
| SMH | Semiconductor | | 212.20 | 63 | 2.00 | 6.52 | 21.35% |
| 12Stocks.com: Charts, Trends, Fundamental Data and Performances of Tech Stocks | |
|
We now take in-depth look at all Tech stocks including charts, multi-period performances and overall trends (as measured by Smart Investing & Trading Score). One can sort Tech stocks (click link to choose) by Daily, Weekly and by Year-to-Date performances. Also, one can sort by size of the company or by market capitalization. |
| Select Your Default Chart Type: | |||||
| |||||
| Click on stock symbol or name for detailed view. Click on to add stock symbol to your watchlist and to view watchlist. Quick View: Move mouse or cursor over "Daily" to quickly view daily technical stock chart and over "Weekly" to view weekly technical stock chart. | |||||


 | API Agora, Inc. |
| Sector: Technology | |
| SubSector: Software Application | |
| MarketCap: 42787 Millions | |
| Recent Price: 2.48 Smart Investing & Trading Score: 42 | |
| Day Percent Change: -0.80% Day Change: -0.02 | |
| Week Change: 2.9% Year-to-date Change: -6.1% | |
| API Links: Profile News Message Board | |
| Charts:- Daily , Weekly | |
| Add API to Watchlist: View: Get Complete API Trend Analysis ➞ | |
 | DQ Daqo New Energy Corp. |
| Sector: Technology | |
| SubSector: Semiconductor Equipment & Materials | |
| MarketCap: 660.918 Millions | |
| Recent Price: 23.56 Smart Investing & Trading Score: 68 | |
| Day Percent Change: -0.80% Day Change: -0.19 | |
| Week Change: 6.56% Year-to-date Change: -11.4% | |
| DQ Links: Profile News Message Board | |
| Charts:- Daily , Weekly | |
| Add DQ to Watchlist: View: Get Complete DQ Trend Analysis ➞ | |
 | EGAN eGain Corporation |
| Sector: Technology | |
| SubSector: Business Software & Services | |
| MarketCap: 201.458 Millions | |
| Recent Price: 6.18 Smart Investing & Trading Score: 42 | |
| Day Percent Change: -0.80% Day Change: -0.05 | |
| Week Change: 1.15% Year-to-date Change: -25.8% | |
| EGAN Links: Profile News Message Board | |
| Charts:- Daily , Weekly | |
| Add EGAN to Watchlist: View: Get Complete EGAN Trend Analysis ➞ | |
 | ORAN Orange S.A. |
| Sector: Technology | |
| SubSector: Telecom Services - Foreign | |
| MarketCap: 34948.2 Millions | |
| Recent Price: 11.23 Smart Investing & Trading Score: 7 | |
| Day Percent Change: -0.80% Day Change: -0.09 | |
| Week Change: -2.43% Year-to-date Change: -1.8% | |
| ORAN Links: Profile News Message Board | |
| Charts:- Daily , Weekly | |
| Add ORAN to Watchlist: View: Get Complete ORAN Trend Analysis ➞ | |
 | VSH Vishay Intertechnology, Inc. |
| Sector: Technology | |
| SubSector: Semiconductor - Broad Line | |
| MarketCap: 2132.52 Millions | |
| Recent Price: 22.10 Smart Investing & Trading Score: 100 | |
| Day Percent Change: -0.81% Day Change: -0.18 | |
| Week Change: 5.74% Year-to-date Change: -7.8% | |
| VSH Links: Profile News Message Board | |
| Charts:- Daily , Weekly | |
| Add VSH to Watchlist: View: Get Complete VSH Trend Analysis ➞ | |
 | CLFD Clearfield, Inc. |
| Sector: Technology | |
| SubSector: Communication Equipment | |
| MarketCap: 138.439 Millions | |
| Recent Price: 29.36 Smart Investing & Trading Score: 68 | |
| Day Percent Change: -0.81% Day Change: -0.24 | |
| Week Change: 3.82% Year-to-date Change: 1.0% | |
| CLFD Links: Profile News Message Board | |
| Charts:- Daily , Weekly | |
| Add CLFD to Watchlist: View: Get Complete CLFD Trend Analysis ➞ | |
 | GDS GDS Holdings Limited |
| Sector: Technology | |
| SubSector: Data Storage Devices | |
| MarketCap: 8597.99 Millions | |
| Recent Price: 7.20 Smart Investing & Trading Score: 85 | |
| Day Percent Change: -0.83% Day Change: -0.06 | |
| Week Change: 13.92% Year-to-date Change: -21.1% | |
| GDS Links: Profile News Message Board | |
| Charts:- Daily , Weekly | |
| Add GDS to Watchlist: View: Get Complete GDS Trend Analysis ➞ | |
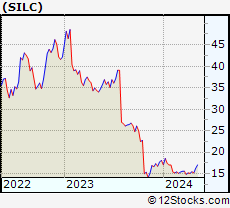 | SILC Silicom Ltd. |
| Sector: Technology | |
| SubSector: Communication Equipment | |
| MarketCap: 178.339 Millions | |
| Recent Price: 15.38 Smart Investing & Trading Score: 69 | |
| Day Percent Change: -0.84% Day Change: -0.13 | |
| Week Change: -0.52% Year-to-date Change: -15.0% | |
| SILC Links: Profile News Message Board | |
| Charts:- Daily , Weekly | |
| Add SILC to Watchlist: View: Get Complete SILC Trend Analysis ➞ | |
 | PATH UiPath Inc. |
| Sector: Technology | |
| SubSector: Software - Infrastructure | |
| MarketCap: 9580 Millions | |
| Recent Price: 19.41 Smart Investing & Trading Score: 18 | |
| Day Percent Change: -0.84% Day Change: -0.16 | |
| Week Change: 3.52% Year-to-date Change: -21.9% | |
| PATH Links: Profile News Message Board | |
| Charts:- Daily , Weekly | |
| Add PATH to Watchlist: View: Get Complete PATH Trend Analysis ➞ | |
 | MDB MongoDB, Inc. |
| Sector: Technology | |
| SubSector: Application Software | |
| MarketCap: 7591.22 Millions | |
| Recent Price: 366.17 Smart Investing & Trading Score: 32 | |
| Day Percent Change: -0.84% Day Change: -3.12 | |
| Week Change: 11.87% Year-to-date Change: -10.4% | |
| MDB Links: Profile News Message Board | |
| Charts:- Daily , Weekly | |
| Add MDB to Watchlist: View: Get Complete MDB Trend Analysis ➞ | |
 | ALRM Alarm.com Holdings, Inc. |
| Sector: Technology | |
| SubSector: Application Software | |
| MarketCap: 2035.62 Millions | |
| Recent Price: 65.23 Smart Investing & Trading Score: 51 | |
| Day Percent Change: -0.85% Day Change: -0.56 | |
| Week Change: 1.75% Year-to-date Change: 0.9% | |
| ALRM Links: Profile News Message Board | |
| Charts:- Daily , Weekly | |
| Add ALRM to Watchlist: View: Get Complete ALRM Trend Analysis ➞ | |
 | CNXN PC Connection, Inc. |
| Sector: Technology | |
| SubSector: Computers Wholesale | |
| MarketCap: 1020.19 Millions | |
| Recent Price: 64.43 Smart Investing & Trading Score: 55 | |
| Day Percent Change: -0.85% Day Change: -0.55 | |
| Week Change: 2.56% Year-to-date Change: -4.1% | |
| CNXN Links: Profile News Message Board | |
| Charts:- Daily , Weekly | |
| Add CNXN to Watchlist: View: Get Complete CNXN Trend Analysis ➞ | |
 | IONQ IonQ, Inc. |
| Sector: Technology | |
| SubSector: Computer Hardware | |
| MarketCap: 2680 Millions | |
| Recent Price: 8.18 Smart Investing & Trading Score: 42 | |
| Day Percent Change: -0.85% Day Change: -0.07 | |
| Week Change: 15.37% Year-to-date Change: -34.4% | |
| IONQ Links: Profile News Message Board | |
| Charts:- Daily , Weekly | |
| Add IONQ to Watchlist: View: Get Complete IONQ Trend Analysis ➞ | |
 | WOW WideOpenWest, Inc. |
| Sector: Technology | |
| SubSector: CATV Systems | |
| MarketCap: 328.932 Millions | |
| Recent Price: 3.46 Smart Investing & Trading Score: 15 | |
| Day Percent Change: -0.86% Day Change: -0.03 | |
| Week Change: -1.7% Year-to-date Change: -14.6% | |
| WOW Links: Profile News Message Board | |
| Charts:- Daily , Weekly | |
| Add WOW to Watchlist: View: Get Complete WOW Trend Analysis ➞ | |
 | UI Ubiquiti Inc. |
| Sector: Technology | |
| SubSector: Communication Equipment | |
| MarketCap: 9526.89 Millions | |
| Recent Price: 107.83 Smart Investing & Trading Score: 35 | |
| Day Percent Change: -0.86% Day Change: -0.94 | |
| Week Change: 1.09% Year-to-date Change: -22.7% | |
| UI Links: Profile News Message Board | |
| Charts:- Daily , Weekly | |
| Add UI to Watchlist: View: Get Complete UI Trend Analysis ➞ | |
 | KC Kingsoft Cloud Holdings Limited |
| Sector: Technology | |
| SubSector: Software Application | |
| MarketCap: 98487 Millions | |
| Recent Price: 2.88 Smart Investing & Trading Score: 73 | |
| Day Percent Change: -0.86% Day Change: -0.02 | |
| Week Change: 7.88% Year-to-date Change: -24.0% | |
| KC Links: Profile News Message Board | |
| Charts:- Daily , Weekly | |
| Add KC to Watchlist: View: Get Complete KC Trend Analysis ➞ | |
 | LOGI Logitech International S.A. |
| Sector: Technology | |
| SubSector: Computer Peripherals | |
| MarketCap: 7998.19 Millions | |
| Recent Price: 78.72 Smart Investing & Trading Score: 18 | |
| Day Percent Change: -0.87% Day Change: -0.69 | |
| Week Change: 1.82% Year-to-date Change: -17.2% | |
| LOGI Links: Profile News Message Board | |
| Charts:- Daily , Weekly | |
| Add LOGI to Watchlist: View: Get Complete LOGI Trend Analysis ➞ | |
 | CCSI Consensus Cloud Solutions, Inc. |
| Sector: Technology | |
| SubSector: Software - Infrastructure | |
| MarketCap: 609 Millions | |
| Recent Price: 12.47 Smart Investing & Trading Score: 30 | |
| Day Percent Change: -0.87% Day Change: -0.11 | |
| Week Change: -3.18% Year-to-date Change: -53.2% | |
| CCSI Links: Profile News Message Board | |
| Charts:- Daily , Weekly | |
| Add CCSI to Watchlist: View: Get Complete CCSI Trend Analysis ➞ | |
 | EXLS ExlService Holdings, Inc. |
| Sector: Technology | |
| SubSector: Information Technology Services | |
| MarketCap: 1781.78 Millions | |
| Recent Price: 29.31 Smart Investing & Trading Score: 35 | |
| Day Percent Change: -0.88% Day Change: -0.26 | |
| Week Change: -0.03% Year-to-date Change: -5.0% | |
| EXLS Links: Profile News Message Board | |
| Charts:- Daily , Weekly | |
| Add EXLS to Watchlist: View: Get Complete EXLS Trend Analysis ➞ | |
 | AUR Aurora Innovation, Inc. |
| Sector: Technology | |
| SubSector: Information Technology Services | |
| MarketCap: 3220 Millions | |
| Recent Price: 2.82 Smart Investing & Trading Score: 5 | |
| Day Percent Change: -0.88% Day Change: -0.03 | |
| Week Change: 0.71% Year-to-date Change: -36.0% | |
| AUR Links: Profile News Message Board | |
| Charts:- Daily , Weekly | |
| Add AUR to Watchlist: View: Get Complete AUR Trend Analysis ➞ | |
 | OKTA Okta, Inc. |
| Sector: Technology | |
| SubSector: Technical & System Software | |
| MarketCap: 15332.9 Millions | |
| Recent Price: 92.93 Smart Investing & Trading Score: 41 | |
| Day Percent Change: -0.89% Day Change: -0.83 | |
| Week Change: 0.95% Year-to-date Change: 2.7% | |
| OKTA Links: Profile News Message Board | |
| Charts:- Daily , Weekly | |
| Add OKTA to Watchlist: View: Get Complete OKTA Trend Analysis ➞ | |
 | ONTF ON24, Inc. |
| Sector: Technology | |
| SubSector: Software - Application | |
| MarketCap: 386 Millions | |
| Recent Price: 6.66 Smart Investing & Trading Score: 40 | |
| Day Percent Change: -0.89% Day Change: -0.06 | |
| Week Change: 0.45% Year-to-date Change: -15.5% | |
| ONTF Links: Profile News Message Board | |
| Charts:- Daily , Weekly | |
| Add ONTF to Watchlist: View: Get Complete ONTF Trend Analysis ➞ | |
 | FARO FARO Technologies, Inc. |
| Sector: Technology | |
| SubSector: Scientific & Technical Instruments | |
| MarketCap: 721.953 Millions | |
| Recent Price: 18.45 Smart Investing & Trading Score: 23 | |
| Day Percent Change: -0.91% Day Change: -0.17 | |
| Week Change: -1.39% Year-to-date Change: -18.1% | |
| FARO Links: Profile News Message Board | |
| Charts:- Daily , Weekly | |
| Add FARO to Watchlist: View: Get Complete FARO Trend Analysis ➞ | |
 | PWSC PowerSchool Holdings, Inc. |
| Sector: Technology | |
| SubSector: Software - Application | |
| MarketCap: 3870 Millions | |
| Recent Price: 17.38 Smart Investing & Trading Score: 10 | |
| Day Percent Change: -0.91% Day Change: -0.16 | |
| Week Change: -0.46% Year-to-date Change: -26.5% | |
| PWSC Links: Profile News Message Board | |
| Charts:- Daily , Weekly | |
| Add PWSC to Watchlist: View: Get Complete PWSC Trend Analysis ➞ | |
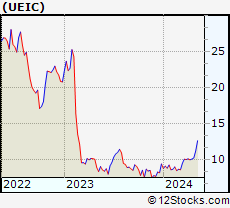 | UEIC Universal Electronics Inc. |
| Sector: Technology | |
| SubSector: Electronic Equipment | |
| MarketCap: 482.7 Millions | |
| Recent Price: 9.71 Smart Investing & Trading Score: 36 | |
| Day Percent Change: -0.92% Day Change: -0.09 | |
| Week Change: -3.67% Year-to-date Change: 3.4% | |
| UEIC Links: Profile News Message Board | |
| Charts:- Daily , Weekly | |
| Add UEIC to Watchlist: View: Get Complete UEIC Trend Analysis ➞ | |
| For tabular summary view of above stock list: Summary View ➞ 0 - 25 , 25 - 50 , 50 - 75 , 75 - 100 , 100 - 125 , 125 - 150 , 150 - 175 , 175 - 200 , 200 - 225 , 225 - 250 , 250 - 275 , 275 - 300 , 300 - 325 , 325 - 350 , 350 - 375 , 375 - 400 , 400 - 425 , 425 - 450 , 450 - 475 , 475 - 500 , 500 - 525 , 525 - 550 , 550 - 575 , 575 - 600 , 600 - 625 , 625 - 650 | ||
| Click To Change The Sort Order: By Market Cap or Company Size Performance: Year-to-date, Week and Day | |
| Select Chart Type: | ||
|
Best Stocks Today 12Stocks.com |
© 2024 12Stocks.com Terms & Conditions Privacy Contact Us
All Information Provided Only For Education And Not To Be Used For Investing or Trading. See Terms & Conditions


One More Thing ... Get Best Stocks Delivered Daily!
Never Ever Miss A Move With Our Top Ten Stocks Lists
Find Best Stocks In Any Market - Bull or Bear Market
Take A Peek At Our Top Ten Stocks Lists: Daily, Weekly, Year-to-Date & Top Trends
Find Best Stocks In Any Market - Bull or Bear Market
Take A Peek At Our Top Ten Stocks Lists: Daily, Weekly, Year-to-Date & Top Trends
Technology Stocks With Best Up Trends [0-bearish to 100-bullish]: HashiCorp [100], Teradyne [100], Karooooo [100], Cricut [100], Grab [100], Microchip [100], Sanmina [100], JD.com [100], EchoStar [100], Analog Devices[100], Allegro MicroSystems[100]
Best Technology Stocks Year-to-Date:
MediaCo Holding[390.61%], Super Micro[177%], Uxin [172.47%], Smith Micro[168.77%], CXApp [166.41%], CuriosityStream [103.67%], GigaCloud [97.54%], MicroStrategy [96.39%], SoundHound AI[94.39%], Cheetah Mobile[88.16%], NextNav [85.73%] Best Technology Stocks This Week:
Matterport [168.97%], Amesite [58.44%], HashiCorp [36.92%], Impinj [33.73%], WiMi Hologram[33.51%], Ribbon [25.58%], Cheetah Mobile[21.19%], on [20.61%], iQIYI [17.99%], SoundHound AI[17.18%], IonQ [15.37%] Best Technology Stocks Daily:
Impinj [28.65%], HashiCorp [10.69%], Tyler [9.32%], SiTime [8.84%], Cheetah Mobile[8.33%], on [8.21%], Teradyne [8.15%], Karooooo [7.84%], Viomi [7.13%], Comtech Tele[6.86%], CACI [5.93%]