
 Login Sign Up


| |||||
 |  | ||||

| 12Stocks.com Market Intelligence |
Best Tech Stocks
| In a hurry? Tech Stocks Lists: Performance & Trends, Stock Charts, FANG Stocks
Sort Tech stocks: Daily, Weekly, Year-to-Date, Market Cap & Trends. Filter Tech stocks list by size:All Tech Large Mid-Range Small and MicroCap |
| 12Stocks.com Tech Stocks Performances & Trends Daily | |||||||||
|
|  The overall Smart Investing & Trading Score is 0 (0-bearish to 100-bullish) which puts Technology sector in short term bearish trend. The Smart Investing & Trading Score from previous trading session is 13 and hence a deterioration of trend.
| ||||||||
Here are the Smart Investing & Trading Scores of the most requested Technology stocks at 12Stocks.com (click stock name for detailed review):
|


| 12Stocks.com: Investing in Technology sector with Stocks | |
|
The following table helps investors and traders sort through current performance and trends (as measured by Smart Investing & Trading Score) of various
stocks in the Tech sector. Quick View: Move mouse or cursor over stock symbol (ticker) to view short-term technical chart and over stock name to view long term chart. Click on  to add stock symbol to your watchlist and to add stock symbol to your watchlist and  to view watchlist. Click on any ticker or stock name for detailed market intelligence report for that stock. to view watchlist. Click on any ticker or stock name for detailed market intelligence report for that stock. |
12Stocks.com Performance of Stocks in Tech Sector
| Ticker | Stock Name | Watchlist | Category | Recent Price | Smart Investing & Trading Score | Change % | YTD Change% |
| LITE | Lumentum |   | Communication | 41.74 | 10 | -1.65 | -20.37% |
| MLNK | MeridianLink | | Software - | 17.21 | 17 | -1.66 | -30.52% |
| SMAR | Smartsheet | | Software | 36.80 | 18 | -1.66 | -23.04% |
| POWI | Power Integrations | | Semiconductor | 62.89 | 0 | -1.67 | -23.41% |
| SNCR | Synchronoss | | Software | 6.31 | 17 | -1.71 | 1.61% |
| ADBE | Adobe | | Software | 465.02 | 10 | -1.72 | -22.05% |
| GFS | GLOBALFOUNDRIES | | Semiconductors | 46.26 | 0 | -1.72 | -23.54% |
| SNPS | Synopsys | | Semiconductor | 510.71 | 0 | -1.73 | -0.82% |
| UMC | United Microelectronics | | Semiconductor | 7.40 | 0 | -1.73 | -12.53% |
| DMRC | Digimarc | | IT | 22.59 | 27 | -1.74 | -37.46% |
| FN | Fabrinet | | Electronic | 162.32 | 10 | -1.74 | -14.72% |
| PXLW | Pixelworks | | Semiconductor | 1.68 | 10 | -1.75 | 28.24% |
| OKTA | Okta | | Software | 92.06 | 36 | -1.76 | 1.69% |
| SMWB | Similarweb | | Software - | 7.75 | 56 | -1.77 | 45.13% |
| MANH | Manhattan Associates | | Software | 226.34 | 10 | -1.78 | 5.12% |
| CXM | Sprinklr | | Software - | 11.34 | 18 | -1.78 | -6.16% |
| FOUR | Shift4 Payments | | Software Infrastructure | 60.78 | 0 | -1.81 | -18.24% |
| ZBRA | Zebra | | Communication | 268.07 | 36 | -1.82 | -1.92% |
| CGNT | Cognyte Software | | Software - Infrastructure | 6.42 | 20 | -1.83 | -0.16% |
| MAXN | Maxeon Solar | | Solar | 1.88 | 20 | -1.83 | -73.89% |
| MX | MagnaChip Semiconductor | | Semiconductor | 4.78 | 0 | -1.85 | -36.27% |
| FRGE | Forge Global | | Software - | 1.86 | 25 | -1.85 | -47.90% |
| DT | Dynatrace | | Software | 45.40 | 25 | -1.86 | -16.99% |
| APPF | AppFolio | | Software | 208.50 | 10 | -1.88 | 20.35% |
| ICHR | Ichor | | Semiconductor | 36.87 | 26 | -1.89 | 9.63% |
| For chart view version of above stock list: Chart View ➞ 0 - 25 , 25 - 50 , 50 - 75 , 75 - 100 , 100 - 125 , 125 - 150 , 150 - 175 , 175 - 200 , 200 - 225 , 225 - 250 , 250 - 275 , 275 - 300 , 300 - 325 , 325 - 350 , 350 - 375 , 375 - 400 , 400 - 425 , 425 - 450 , 450 - 475 , 475 - 500 , 500 - 525 , 525 - 550 , 550 - 575 , 575 - 600 , 600 - 625 , 625 - 650 | ||
 | Click To Change The Sort Order: By Market Cap or Company Size Performance: Year-to-date, Week and Day |  |
|
Get the most comprehensive stock market coverage daily at 12Stocks.com ➞ Best Stocks Today ➞ Best Stocks Weekly ➞ Best Stocks Year-to-Date ➞ Best Stocks Trends ➞  Best Stocks Today 12Stocks.com Best Nasdaq Stocks ➞ Best S&P 500 Stocks ➞ Best Tech Stocks ➞ Best Biotech Stocks ➞ |
| Detailed Overview of Tech Stocks |
| Tech Technical Overview, Leaders & Laggards, Top Tech ETF Funds & Detailed Tech Stocks List, Charts, Trends & More |
| Tech Sector: Technical Analysis, Trends & YTD Performance | |
| Technology sector is composed of stocks
from semiconductors, software, web, social media
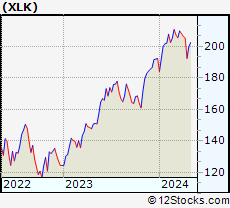
and services subsectors. Technology sector, as represented by XLK, an exchange-traded fund [ETF] that holds basket of tech stocks (e.g, Intel, Google) is up by 0.03% and is currently underperforming the overall market by -3.35% year-to-date. Below is a quick view of technical charts and trends: |
|
 XLK Weekly Chart |
|
| Long Term Trend: Not Good | |
| Medium Term Trend: Not Good | |
 XLK Daily Chart |
|
| Short Term Trend: Not Good | |
| Overall Trend Score: 0 | |
| YTD Performance: 0.03% | |
| **Trend Scores & Views Are Only For Educational Purposes And Not For Investing | |
| 12Stocks.com: Top Performing Technology Sector Stocks | ||||||||||||||||||||||||||||||||||||||||||||||||
 The top performing Technology sector stocks year to date are
Now, more recently, over last week, the top performing Technology sector stocks on the move are


|
||||||||||||||||||||||||||||||||||||||||||||||||
| 12Stocks.com: Investing in Tech Sector using Exchange Traded Funds | |
|
The following table shows list of key exchange traded funds (ETF) that
help investors track Tech Index. For detailed view, check out our ETF Funds section of our website. Quick View: Move mouse or cursor over ETF symbol (ticker) to view short-term technical chart and over ETF name to view long term chart. Click on ticker or stock name for detailed view. Click on to add stock symbol to your watchlist and to view watchlist. |
12Stocks.com List of ETFs that track Tech Index
| Ticker | ETF Name | Watchlist | Recent Price | Smart Investing & Trading Score | Change % | Week % | Year-to-date % |
| XLK | Technology | | 192.53 | 0 | -2.06 | -6.27 | 0.03% |
| QQQ | QQQ | | 414.65 | 13 | -2.07 | -5.39 | 1.25% |
| IYW | Technology | | 124.75 | 0 | -2.85 | -6.87 | 1.63% |
| VGT | Information Technology | | 479.90 | 0 | -2.65 | -6.76 | -0.85% |
| IXN | Global Tech | | 68.72 | 0 | -2.65 | -6.88 | 0.79% |
| IGV | Tech-Software | | 78.53 | 0 | -1.22 | -5.11 | -3.2% |
| XSD | Semiconductor | | 203.56 | 0 | -3.15 | -8.78 | -9.44% |
| TQQQ | QQQ | | 49.48 | 0 | -6.20 | -15.74 | -2.41% |
| SQQQ | Short QQQ | | 12.84 | 82 | 6.38 | 17.91 | -4.54% |
| SOXL | Semicondct Bull 3X | | 30.79 | 0 | -11.80 | -25.83 | -1.94% |
| SOXS | Semicondct Bear 3X | | 46.13 | 90 | 11.78 | 1210.51 | 692.61% |
| SOXX | PHLX Semiconductor | | 198.39 | 26 | -3.99 | -9.02 | 3.31% |
| QTEC | First -100-Tech | | 173.94 | 0 | -2.21 | -6.49 | -0.87% |
| SMH | Semiconductor | | 199.21 | 26 | -4.52 | -9.73 | 13.92% |
| 12Stocks.com: Charts, Trends, Fundamental Data and Performances of Tech Stocks | |
|
We now take in-depth look at all Tech stocks including charts, multi-period performances and overall trends (as measured by Smart Investing & Trading Score). One can sort Tech stocks (click link to choose) by Daily, Weekly and by Year-to-Date performances. Also, one can sort by size of the company or by market capitalization. |
| Select Your Default Chart Type: | |||||
| |||||
| Click on stock symbol or name for detailed view. Click on to add stock symbol to your watchlist and to view watchlist. Quick View: Move mouse or cursor over "Daily" to quickly view daily technical stock chart and over "Weekly" to view weekly technical stock chart. | |||||


 | LITE Lumentum Holdings Inc. |
| Sector: Technology | |
| SubSector: Communication Equipment | |
| MarketCap: 4990.49 Millions | |
| Recent Price: 41.74 Smart Investing & Trading Score: 10 | |
| Day Percent Change: -1.65% Day Change: -0.70 | |
| Week Change: -3.94% Year-to-date Change: -20.4% | |
| LITE Links: Profile News Message Board | |
| Charts:- Daily , Weekly | |
| Add LITE to Watchlist: View: Get Complete LITE Trend Analysis ➞ | |
 | MLNK MeridianLink, Inc. |
| Sector: Technology | |
| SubSector: Software - Application | |
| MarketCap: 1630 Millions | |
| Recent Price: 17.21 Smart Investing & Trading Score: 17 | |
| Day Percent Change: -1.66% Day Change: -0.29 | |
| Week Change: 0.47% Year-to-date Change: -30.5% | |
| MLNK Links: Profile News Message Board | |
| Charts:- Daily , Weekly | |
| Add MLNK to Watchlist: View: Get Complete MLNK Trend Analysis ➞ | |
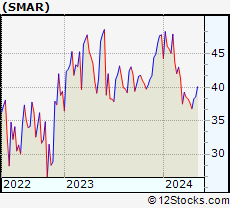 | SMAR Smartsheet Inc. |
| Sector: Technology | |
| SubSector: Business Software & Services | |
| MarketCap: 5159.38 Millions | |
| Recent Price: 36.80 Smart Investing & Trading Score: 18 | |
| Day Percent Change: -1.66% Day Change: -0.62 | |
| Week Change: -2.31% Year-to-date Change: -23.0% | |
| SMAR Links: Profile News Message Board | |
| Charts:- Daily , Weekly | |
| Add SMAR to Watchlist: View: Get Complete SMAR Trend Analysis ➞ | |
 | POWI Power Integrations, Inc. |
| Sector: Technology | |
| SubSector: Semiconductor - Integrated Circuits | |
| MarketCap: 2612.1 Millions | |
| Recent Price: 62.89 Smart Investing & Trading Score: 0 | |
| Day Percent Change: -1.67% Day Change: -1.07 | |
| Week Change: -7.57% Year-to-date Change: -23.4% | |
| POWI Links: Profile News Message Board | |
| Charts:- Daily , Weekly | |
| Add POWI to Watchlist: View: Get Complete POWI Trend Analysis ➞ | |
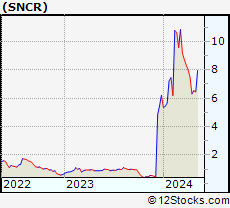 | SNCR Synchronoss Technologies, Inc. |
| Sector: Technology | |
| SubSector: Application Software | |
| MarketCap: 232.262 Millions | |
| Recent Price: 6.31 Smart Investing & Trading Score: 17 | |
| Day Percent Change: -1.71% Day Change: -0.11 | |
| Week Change: -15.87% Year-to-date Change: 1.6% | |
| SNCR Links: Profile News Message Board | |
| Charts:- Daily , Weekly | |
| Add SNCR to Watchlist: View: Get Complete SNCR Trend Analysis ➞ | |
 | ADBE Adobe Inc. |
| Sector: Technology | |
| SubSector: Application Software | |
| MarketCap: 157868 Millions | |
| Recent Price: 465.02 Smart Investing & Trading Score: 10 | |
| Day Percent Change: -1.72% Day Change: -8.16 | |
| Week Change: -1.91% Year-to-date Change: -22.1% | |
| ADBE Links: Profile News Message Board | |
| Charts:- Daily , Weekly | |
| Add ADBE to Watchlist: View: Get Complete ADBE Trend Analysis ➞ | |
 | GFS GLOBALFOUNDRIES Inc. |
| Sector: Technology | |
| SubSector: Semiconductors | |
| MarketCap: 35570 Millions | |
| Recent Price: 46.26 Smart Investing & Trading Score: 0 | |
| Day Percent Change: -1.72% Day Change: -0.81 | |
| Week Change: -9.63% Year-to-date Change: -23.5% | |
| GFS Links: Profile News Message Board | |
| Charts:- Daily , Weekly | |
| Add GFS to Watchlist: View: Get Complete GFS Trend Analysis ➞ | |
 | SNPS Synopsys, Inc. |
| Sector: Technology | |
| SubSector: Semiconductor Equipment & Materials | |
| MarketCap: 18273.8 Millions | |
| Recent Price: 510.71 Smart Investing & Trading Score: 0 | |
| Day Percent Change: -1.73% Day Change: -9.00 | |
| Week Change: -8.34% Year-to-date Change: -0.8% | |
| SNPS Links: Profile News Message Board | |
| Charts:- Daily , Weekly | |
| Add SNPS to Watchlist: View: Get Complete SNPS Trend Analysis ➞ | |
 | UMC United Microelectronics Corporation |
| Sector: Technology | |
| SubSector: Semiconductor Equipment & Materials | |
| MarketCap: 5672.78 Millions | |
| Recent Price: 7.40 Smart Investing & Trading Score: 0 | |
| Day Percent Change: -1.73% Day Change: -0.13 | |
| Week Change: -7.15% Year-to-date Change: -12.5% | |
| UMC Links: Profile News Message Board | |
| Charts:- Daily , Weekly | |
| Add UMC to Watchlist: View: Get Complete UMC Trend Analysis ➞ | |
 | DMRC Digimarc Corporation |
| Sector: Technology | |
| SubSector: Information Technology Services | |
| MarketCap: 222.268 Millions | |
| Recent Price: 22.59 Smart Investing & Trading Score: 27 | |
| Day Percent Change: -1.74% Day Change: -0.40 | |
| Week Change: -3.59% Year-to-date Change: -37.5% | |
| DMRC Links: Profile News Message Board | |
| Charts:- Daily , Weekly | |
| Add DMRC to Watchlist: View: Get Complete DMRC Trend Analysis ➞ | |
 | FN Fabrinet |
| Sector: Technology | |
| SubSector: Electronic Equipment | |
| MarketCap: 1876 Millions | |
| Recent Price: 162.32 Smart Investing & Trading Score: 10 | |
| Day Percent Change: -1.74% Day Change: -2.88 | |
| Week Change: -6.35% Year-to-date Change: -14.7% | |
| FN Links: Profile News Message Board | |
| Charts:- Daily , Weekly | |
| Add FN to Watchlist: View: Get Complete FN Trend Analysis ➞ | |
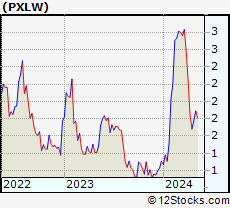 | PXLW Pixelworks, Inc. |
| Sector: Technology | |
| SubSector: Semiconductor - Integrated Circuits | |
| MarketCap: 113.51 Millions | |
| Recent Price: 1.68 Smart Investing & Trading Score: 10 | |
| Day Percent Change: -1.75% Day Change: -0.03 | |
| Week Change: -9.19% Year-to-date Change: 28.2% | |
| PXLW Links: Profile News Message Board | |
| Charts:- Daily , Weekly | |
| Add PXLW to Watchlist: View: Get Complete PXLW Trend Analysis ➞ | |
 | OKTA Okta, Inc. |
| Sector: Technology | |
| SubSector: Technical & System Software | |
| MarketCap: 15332.9 Millions | |
| Recent Price: 92.06 Smart Investing & Trading Score: 36 | |
| Day Percent Change: -1.76% Day Change: -1.65 | |
| Week Change: -6.31% Year-to-date Change: 1.7% | |
| OKTA Links: Profile News Message Board | |
| Charts:- Daily , Weekly | |
| Add OKTA to Watchlist: View: Get Complete OKTA Trend Analysis ➞ | |
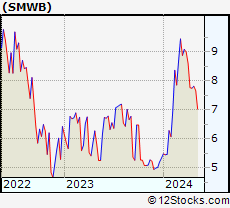 | SMWB Similarweb Ltd. |
| Sector: Technology | |
| SubSector: Software - Application | |
| MarketCap: 510 Millions | |
| Recent Price: 7.75 Smart Investing & Trading Score: 56 | |
| Day Percent Change: -1.77% Day Change: -0.14 | |
| Week Change: -0.26% Year-to-date Change: 45.1% | |
| SMWB Links: Profile News Message Board | |
| Charts:- Daily , Weekly | |
| Add SMWB to Watchlist: View: Get Complete SMWB Trend Analysis ➞ | |
 | MANH Manhattan Associates, Inc. |
| Sector: Technology | |
| SubSector: Application Software | |
| MarketCap: 3487.02 Millions | |
| Recent Price: 226.34 Smart Investing & Trading Score: 10 | |
| Day Percent Change: -1.78% Day Change: -4.10 | |
| Week Change: -4.82% Year-to-date Change: 5.1% | |
| MANH Links: Profile News Message Board | |
| Charts:- Daily , Weekly | |
| Add MANH to Watchlist: View: Get Complete MANH Trend Analysis ➞ | |
 | CXM Sprinklr, Inc. |
| Sector: Technology | |
| SubSector: Software - Application | |
| MarketCap: 3700 Millions | |
| Recent Price: 11.34 Smart Investing & Trading Score: 18 | |
| Day Percent Change: -1.78% Day Change: -0.21 | |
| Week Change: -1.82% Year-to-date Change: -6.2% | |
| CXM Links: Profile News Message Board | |
| Charts:- Daily , Weekly | |
| Add CXM to Watchlist: View: Get Complete CXM Trend Analysis ➞ | |
 | FOUR Shift4 Payments, Inc. |
| Sector: Technology | |
| SubSector: Software Infrastructure | |
| MarketCap: 49287 Millions | |
| Recent Price: 60.78 Smart Investing & Trading Score: 0 | |
| Day Percent Change: -1.81% Day Change: -1.12 | |
| Week Change: -5% Year-to-date Change: -18.2% | |
| FOUR Links: Profile News Message Board | |
| Charts:- Daily , Weekly | |
| Add FOUR to Watchlist: View: Get Complete FOUR Trend Analysis ➞ | |
 | ZBRA Zebra Technologies Corporation |
| Sector: Technology | |
| SubSector: Communication Equipment | |
| MarketCap: 11474.9 Millions | |
| Recent Price: 268.07 Smart Investing & Trading Score: 36 | |
| Day Percent Change: -1.82% Day Change: -4.96 | |
| Week Change: -7.46% Year-to-date Change: -1.9% | |
| ZBRA Links: Profile News Message Board | |
| Charts:- Daily , Weekly | |
| Add ZBRA to Watchlist: View: Get Complete ZBRA Trend Analysis ➞ | |
 | CGNT Cognyte Software Ltd. |
| Sector: Technology | |
| SubSector: Software - Infrastructure | |
| MarketCap: 397 Millions | |
| Recent Price: 6.42 Smart Investing & Trading Score: 20 | |
| Day Percent Change: -1.83% Day Change: -0.12 | |
| Week Change: -4.61% Year-to-date Change: -0.2% | |
| CGNT Links: Profile News Message Board | |
| Charts:- Daily , Weekly | |
| Add CGNT to Watchlist: View: Get Complete CGNT Trend Analysis ➞ | |
 | MAXN Maxeon Solar Technologies, Ltd. |
| Sector: Technology | |
| SubSector: Solar | |
| MarketCap: 88787 Millions | |
| Recent Price: 1.88 Smart Investing & Trading Score: 20 | |
| Day Percent Change: -1.83% Day Change: -0.03 | |
| Week Change: -11.56% Year-to-date Change: -73.9% | |
| MAXN Links: Profile News Message Board | |
| Charts:- Daily , Weekly | |
| Add MAXN to Watchlist: View: Get Complete MAXN Trend Analysis ➞ | |
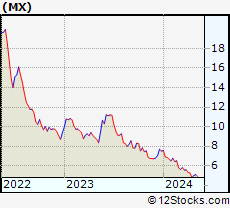 | MX MagnaChip Semiconductor Corporation |
| Sector: Technology | |
| SubSector: Semiconductor - Specialized | |
| MarketCap: 319.16 Millions | |
| Recent Price: 4.78 Smart Investing & Trading Score: 0 | |
| Day Percent Change: -1.85% Day Change: -0.09 | |
| Week Change: -9.13% Year-to-date Change: -36.3% | |
| MX Links: Profile News Message Board | |
| Charts:- Daily , Weekly | |
| Add MX to Watchlist: View: Get Complete MX Trend Analysis ➞ | |
 | FRGE Forge Global Holdings, Inc. |
| Sector: Technology | |
| SubSector: Software - Application | |
| MarketCap: 426 Millions | |
| Recent Price: 1.86 Smart Investing & Trading Score: 25 | |
| Day Percent Change: -1.85% Day Change: -0.03 | |
| Week Change: -7.92% Year-to-date Change: -47.9% | |
| FRGE Links: Profile News Message Board | |
| Charts:- Daily , Weekly | |
| Add FRGE to Watchlist: View: Get Complete FRGE Trend Analysis ➞ | |
 | DT Dynatrace, Inc. |
| Sector: Technology | |
| SubSector: Application Software | |
| MarketCap: 7007.12 Millions | |
| Recent Price: 45.40 Smart Investing & Trading Score: 25 | |
| Day Percent Change: -1.86% Day Change: -0.86 | |
| Week Change: -0.98% Year-to-date Change: -17.0% | |
| DT Links: Profile News Message Board | |
| Charts:- Daily , Weekly | |
| Add DT to Watchlist: View: Get Complete DT Trend Analysis ➞ | |
 | APPF AppFolio, Inc. |
| Sector: Technology | |
| SubSector: Application Software | |
| MarketCap: 3412.02 Millions | |
| Recent Price: 208.50 Smart Investing & Trading Score: 10 | |
| Day Percent Change: -1.88% Day Change: -3.99 | |
| Week Change: -5.84% Year-to-date Change: 20.4% | |
| APPF Links: Profile News Message Board | |
| Charts:- Daily , Weekly | |
| Add APPF to Watchlist: View: Get Complete APPF Trend Analysis ➞ | |
 | ICHR Ichor Holdings, Ltd. |
| Sector: Technology | |
| SubSector: Semiconductor Equipment & Materials | |
| MarketCap: 409.018 Millions | |
| Recent Price: 36.87 Smart Investing & Trading Score: 26 | |
| Day Percent Change: -1.89% Day Change: -0.71 | |
| Week Change: -5.22% Year-to-date Change: 9.6% | |
| ICHR Links: Profile News Message Board | |
| Charts:- Daily , Weekly | |
| Add ICHR to Watchlist: View: Get Complete ICHR Trend Analysis ➞ | |
| For tabular summary view of above stock list: Summary View ➞ 0 - 25 , 25 - 50 , 50 - 75 , 75 - 100 , 100 - 125 , 125 - 150 , 150 - 175 , 175 - 200 , 200 - 225 , 225 - 250 , 250 - 275 , 275 - 300 , 300 - 325 , 325 - 350 , 350 - 375 , 375 - 400 , 400 - 425 , 425 - 450 , 450 - 475 , 475 - 500 , 500 - 525 , 525 - 550 , 550 - 575 , 575 - 600 , 600 - 625 , 625 - 650 | ||
| Click To Change The Sort Order: By Market Cap or Company Size Performance: Year-to-date, Week and Day | |
| Select Chart Type: | ||
|
Best Stocks Today 12Stocks.com |
© 2024 12Stocks.com Terms & Conditions Privacy Contact Us
All Information Provided Only For Education And Not To Be Used For Investing or Trading. See Terms & Conditions


One More Thing ... Get Best Stocks Delivered Daily!
Never Ever Miss A Move With Our Top Ten Stocks Lists
Find Best Stocks In Any Market - Bull or Bear Market
Take A Peek At Our Top Ten Stocks Lists: Daily, Weekly, Year-to-Date & Top Trends
Find Best Stocks In Any Market - Bull or Bear Market
Take A Peek At Our Top Ten Stocks Lists: Daily, Weekly, Year-to-Date & Top Trends
Technology Stocks With Best Up Trends [0-bearish to 100-bullish]: Karooooo [100], NextNav [100], EchoStar [100], Badger Meter[100], Full Truck[93], Turkcell Iletisim[93], Grab [93], Zuora [93], GDS [88], Criteo S.A[83], So-Young [83]
Best Technology Stocks Year-to-Date:
Pagaya [589.78%], MediaCo Holding[544.37%], CXApp [168.73%], Smith Micro[151.82%], Super Micro[151.06%], Uxin [141.08%], CuriosityStream [107.37%], GigaCloud [89.46%], MicroStrategy [85.89%], NextNav [83.37%], D-Wave Quantum[81.22%] Best Technology Stocks This Week:
Snap One[29.73%], Badger Meter[15.61%], Mynaric AG[13.08%], Expensify [11.56%], Iridium [11.07%], NextNav [10.12%], Encore Wire[8.97%], Quhuo [8.87%], Bentley Systems[7.96%], Applied Optoelectronics[7.93%], Zuora [7.56%] Best Technology Stocks Daily:
Markforged Holding[16.32%], CuriosityStream [10.89%], CXApp [9.78%], Iridium [5.14%], Cheetah Mobile[5.04%], Aerohive Networks[4.23%], Materialise NV[3.98%], Applied Optoelectronics[3.95%], QuinStreet [3.70%], ATN [3.58%], MediaCo Holding[3.58%]