
 Login Sign Up


| |||||
 |  | ||||

| 12Stocks.com Market Intelligence |
Best Tech Stocks
| In a hurry? Tech Stocks Lists: Performance & Trends, Stock Charts, FANG Stocks
Sort Tech stocks: Daily, Weekly, Year-to-Date, Market Cap & Trends. Filter Tech stocks list by size:All Tech Large Mid-Range Small and MicroCap |
| 12Stocks.com Tech Stocks Performances & Trends Daily | |||||||||
|
|  The overall Smart Investing & Trading Score is 49 (0-bearish to 100-bullish) which puts Technology sector in short term neutral trend. The Smart Investing & Trading Score from previous trading session is 10 and hence an improvement of trend.
| ||||||||
Here are the Smart Investing & Trading Scores of the most requested Technology stocks at 12Stocks.com (click stock name for detailed review):
|


| 12Stocks.com: Investing in Technology sector with Stocks | |
|
The following table helps investors and traders sort through current performance and trends (as measured by Smart Investing & Trading Score) of various
stocks in the Tech sector. Quick View: Move mouse or cursor over stock symbol (ticker) to view short-term technical chart and over stock name to view long term chart. Click on  to add stock symbol to your watchlist and to add stock symbol to your watchlist and  to view watchlist. Click on any ticker or stock name for detailed market intelligence report for that stock. to view watchlist. Click on any ticker or stock name for detailed market intelligence report for that stock. |
12Stocks.com Performance of Stocks in Tech Sector
| Ticker | Stock Name | Watchlist | Category | Recent Price | Smart Investing & Trading Score | Change % | YTD Change% |
| RXT | Rackspace |   | Software Infrastructure | 1.83 | 69 | 5.17% | -8.73% |
| VIV | Telefonica Brasil | | Wireless | 9.95 | 64 | 3.22% | -9.05% |
| TTWO | Take-Two Interactive | | Software | 145.88 | 62 | 1.96% | -9.36% |
| RNG | RingCentral | | Software | 30.49 | 44 | 0.10% | -10.19% |
| SQ | Square | | Internet | 69.47 | 17 | -1.18% | -10.19% |
| FDS | FactSet Research | | IT | 428.25 | 50 | 1.16% | -10.23% |
| NCNO | nCino | | Software | 30.18 | 65 | -1.73% | -10.26% |
| KC | Kingsoft Cloud | | Software | 3.39 | 90 | -2.87% | -10.44% |
| ADSK | Autodesk | | Software | 215.19 | 32 | 2.50% | -11.62% |
| WB | | Internet | 9.67 | 100 | 4.09% | -11.69% | |
| ANSS | ANSYS | | Software | 319.52 | 17 | 1.59% | -11.95% |
| CTSH | Cognizant | | IT | 66.25 | 42 | -0.03% | -12.29% |
| MTCH | Match | | Internet | 31.93 | 37 | 2.05% | -12.52% |
| ZI | ZoomInfo | | Software | 16.10 | 52 | -2.31% | -12.93% |
| ACN | Accenture | | IT | 303.71 | 42 | 1.12% | -13.45% |
| TDY | Teledyne | | Instruments | 385.34 | 42 | -0.07% | -13.66% |
| ZM | Zoom Video | | Software | 61.82 | 45 | -1.61% | -14.03% |
| BCE | BCE | | Telecom | 33.60 | 74 | 1.85% | -14.68% |
| QRVO | Qorvo | | Semiconductor | 95.95 | 0 | 0.29% | -14.79% |
| CCI | Crown Castle | | Communication | 97.39 | 67 | 0.99% | -15.45% |
| AKAM | Akamai | | Internet | 99.67 | 10 | -0.07% | -15.78% |
| DNB | Dun & Bradstreet | | IT | 9.72 | 50 | 2.42% | -16.92% |
| PAYC | Paycom Software | | Software | 171.29 | 10 | 2.74% | -17.14% |
| ERIC | Telefonaktiebolaget LM | | Communication | 5.21 | 57 | 1.17% | -17.30% |
| ASAN | Asana | | Software | 15.72 | 64 | 0.58% | -17.31% |
| For chart view version of above stock list: Chart View ➞ 0 - 25 , 25 - 50 , 50 - 75 , 75 - 100 , 100 - 125 , 125 - 150 , 150 - 175 , 175 - 200 | ||
 | Click To Change The Sort Order: By Market Cap or Company Size Performance: Year-to-date, Week and Day |  |
|
Get the most comprehensive stock market coverage daily at 12Stocks.com ➞ Best Stocks Today ➞ Best Stocks Weekly ➞ Best Stocks Year-to-Date ➞ Best Stocks Trends ➞  Best Stocks Today 12Stocks.com Best Nasdaq Stocks ➞ Best S&P 500 Stocks ➞ Best Tech Stocks ➞ Best Biotech Stocks ➞ |
| Detailed Overview of Tech Stocks |
| Tech Technical Overview, Leaders & Laggards, Top Tech ETF Funds & Detailed Tech Stocks List, Charts, Trends & More |
| Tech Sector: Technical Analysis, Trends & YTD Performance | |
| Technology sector is composed of stocks
from semiconductors, software, web, social media
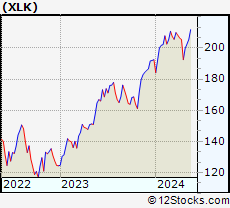
and services subsectors. Technology sector, as represented by XLK, an exchange-traded fund [ETF] that holds basket of tech stocks (e.g, Intel, Google) is up by 5.23% and is currently underperforming the overall market by -1.65% year-to-date. Below is a quick view of technical charts and trends: |
|
 XLK Weekly Chart |
|
| Long Term Trend: Not Good | |
| Medium Term Trend: Deteriorating | |
 XLK Daily Chart |
|
| Short Term Trend: Very Good | |
| Overall Trend Score: 49 | |
| YTD Performance: 5.23% | |
| **Trend Scores & Views Are Only For Educational Purposes And Not For Investing | |
| 12Stocks.com: Top Performing Technology Sector Stocks | ||||||||||||||||||||||||||||||||||||||||||||||||
 The top performing Technology sector stocks year to date are
Now, more recently, over last week, the top performing Technology sector stocks on the move are


|
||||||||||||||||||||||||||||||||||||||||||||||||
| 12Stocks.com: Investing in Tech Sector using Exchange Traded Funds | |
|
The following table shows list of key exchange traded funds (ETF) that
help investors track Tech Index. For detailed view, check out our ETF Funds section of our website. Quick View: Move mouse or cursor over ETF symbol (ticker) to view short-term technical chart and over ETF name to view long term chart. Click on ticker or stock name for detailed view. Click on to add stock symbol to your watchlist and to view watchlist. |
12Stocks.com List of ETFs that track Tech Index
| Ticker | ETF Name | Watchlist | Recent Price | Smart Investing & Trading Score | Change % | Week % | Year-to-date % |
| XLK | Technology | | 202.55 | 49 | 2.79 | 1.36 | 5.23% |
| QQQ | QQQ | | 435.48 | 57 | 2.01 | 1.04 | 6.34% |
| IYW | Technology | | 132.17 | 62 | 2.45 | 0.93 | 7.67% |
| VGT | Information Technology | | 509.46 | 49 | 2.70 | 1.1 | 5.26% |
| IXN | Global Tech | | 72.86 | 62 | 2.82 | 1.48 | 6.86% |
| IGV | Tech-Software | | 80.87 | 42 | 1.20 | -0.27 | -0.32% |
| XSD | Semiconductor | | 226.11 | 88 | 2.25 | 0.63 | 0.59% |
| TQQQ | QQQ | | 56.70 | 49 | 5.92 | 2.57 | 11.83% |
| SQQQ | Short QQQ | | 11.08 | 51 | -5.94 | -3.06 | -17.62% |
| SOXL | Semicondct Bull 3X | | 38.97 | 39 | 6.91 | -1.96 | 24.11% |
| SOXS | Semicondct Bear 3X | | 35.12 | 51 | -6.60 | 0.06 | 503.44% |
| SOXX | PHLX Semiconductor | | 216.17 | 52 | 2.25 | -0.34 | 12.57% |
| QTEC | First -100-Tech | | 182.75 | 42 | 1.45 | -0.67 | 4.15% |
| SMH | Semiconductor | | 217.73 | 65 | 2.69 | 0.04 | 24.51% |
| 12Stocks.com: Charts, Trends, Fundamental Data and Performances of Tech Stocks | |
|
We now take in-depth look at all Tech stocks including charts, multi-period performances and overall trends (as measured by Smart Investing & Trading Score). One can sort Tech stocks (click link to choose) by Daily, Weekly and by Year-to-Date performances. Also, one can sort by size of the company or by market capitalization. |
| Select Your Default Chart Type: | |||||
| |||||
| Click on stock symbol or name for detailed view. Click on to add stock symbol to your watchlist and to view watchlist. Quick View: Move mouse or cursor over "Daily" to quickly view daily technical stock chart and over "Weekly" to view weekly technical stock chart. | |||||


 | RXT Rackspace Technology, Inc. |
| Sector: Technology | |
| SubSector: Software Infrastructure | |
| MarketCap: 40287 Millions | |
| Recent Price: 1.83 Smart Investing & Trading Score: 69 | |
| Day Percent Change: 5.17% Day Change: 0.09 | |
| Week Change: 4.57% Year-to-date Change: -8.7% | |
| RXT Links: Profile News Message Board | |
| Charts:- Daily , Weekly | |
| Add RXT to Watchlist: View: Get Complete RXT Trend Analysis ➞ | |
 | VIV Telefonica Brasil S.A. |
| Sector: Technology | |
| SubSector: Wireless Communications | |
| MarketCap: 19611.1 Millions | |
| Recent Price: 9.95 Smart Investing & Trading Score: 64 | |
| Day Percent Change: 3.22% Day Change: 0.31 | |
| Week Change: 5.74% Year-to-date Change: -9.1% | |
| VIV Links: Profile News Message Board | |
| Charts:- Daily , Weekly | |
| Add VIV to Watchlist: View: Get Complete VIV Trend Analysis ➞ | |
 | TTWO Take-Two Interactive Software, Inc. |
| Sector: Technology | |
| SubSector: Multimedia & Graphics Software | |
| MarketCap: 12479.6 Millions | |
| Recent Price: 145.88 Smart Investing & Trading Score: 62 | |
| Day Percent Change: 1.96% Day Change: 2.81 | |
| Week Change: 0.98% Year-to-date Change: -9.4% | |
| TTWO Links: Profile News Message Board | |
| Charts:- Daily , Weekly | |
| Add TTWO to Watchlist: View: Get Complete TTWO Trend Analysis ➞ | |
 | RNG RingCentral, Inc. |
| Sector: Technology | |
| SubSector: Application Software | |
| MarketCap: 17755.3 Millions | |
| Recent Price: 30.49 Smart Investing & Trading Score: 44 | |
| Day Percent Change: 0.10% Day Change: 0.03 | |
| Week Change: -0.49% Year-to-date Change: -10.2% | |
| RNG Links: Profile News Message Board | |
| Charts:- Daily , Weekly | |
| Add RNG to Watchlist: View: Get Complete RNG Trend Analysis ➞ | |
 | SQ Square, Inc. |
| Sector: Technology | |
| SubSector: Internet Software & Services | |
| MarketCap: 19323.1 Millions | |
| Recent Price: 69.47 Smart Investing & Trading Score: 17 | |
| Day Percent Change: -1.18% Day Change: -0.83 | |
| Week Change: -6.73% Year-to-date Change: -10.2% | |
| SQ Links: Profile News Message Board | |
| Charts:- Daily , Weekly | |
| Add SQ to Watchlist: View: Get Complete SQ Trend Analysis ➞ | |
 | FDS FactSet Research Systems Inc. |
| Sector: Technology | |
| SubSector: Information & Delivery Services | |
| MarketCap: 9024.37 Millions | |
| Recent Price: 428.25 Smart Investing & Trading Score: 50 | |
| Day Percent Change: 1.16% Day Change: 4.89 | |
| Week Change: 1.61% Year-to-date Change: -10.2% | |
| FDS Links: Profile News Message Board | |
| Charts:- Daily , Weekly | |
| Add FDS to Watchlist: View: Get Complete FDS Trend Analysis ➞ | |
 | NCNO nCino, Inc. |
| Sector: Technology | |
| SubSector: Software Application | |
| MarketCap: 74187 Millions | |
| Recent Price: 30.18 Smart Investing & Trading Score: 65 | |
| Day Percent Change: -1.73% Day Change: -0.53 | |
| Week Change: 2.27% Year-to-date Change: -10.3% | |
| NCNO Links: Profile News Message Board | |
| Charts:- Daily , Weekly | |
| Add NCNO to Watchlist: View: Get Complete NCNO Trend Analysis ➞ | |
 | KC Kingsoft Cloud Holdings Limited |
| Sector: Technology | |
| SubSector: Software Application | |
| MarketCap: 98487 Millions | |
| Recent Price: 3.39 Smart Investing & Trading Score: 90 | |
| Day Percent Change: -2.87% Day Change: -0.10 | |
| Week Change: 7.28% Year-to-date Change: -10.4% | |
| KC Links: Profile News Message Board | |
| Charts:- Daily , Weekly | |
| Add KC to Watchlist: View: Get Complete KC Trend Analysis ➞ | |
 | ADSK Autodesk, Inc. |
| Sector: Technology | |
| SubSector: Technical & System Software | |
| MarketCap: 36975.8 Millions | |
| Recent Price: 215.19 Smart Investing & Trading Score: 32 | |
| Day Percent Change: 2.50% Day Change: 5.24 | |
| Week Change: -1.26% Year-to-date Change: -11.6% | |
| ADSK Links: Profile News Message Board | |
| Charts:- Daily , Weekly | |
| Add ADSK to Watchlist: View: Get Complete ADSK Trend Analysis ➞ | |
 | WB Weibo Corporation |
| Sector: Technology | |
| SubSector: Internet Information Providers | |
| MarketCap: 8164.6 Millions | |
| Recent Price: 9.67 Smart Investing & Trading Score: 100 | |
| Day Percent Change: 4.09% Day Change: 0.38 | |
| Week Change: 9.89% Year-to-date Change: -11.7% | |
| WB Links: Profile News Message Board | |
| Charts:- Daily , Weekly | |
| Add WB to Watchlist: View: Get Complete WB Trend Analysis ➞ | |
 | ANSS ANSYS, Inc. |
| Sector: Technology | |
| SubSector: Application Software | |
| MarketCap: 19497.4 Millions | |
| Recent Price: 319.52 Smart Investing & Trading Score: 17 | |
| Day Percent Change: 1.59% Day Change: 4.99 | |
| Week Change: -4.26% Year-to-date Change: -12.0% | |
| ANSS Links: Profile News Message Board | |
| Charts:- Daily , Weekly | |
| Add ANSS to Watchlist: View: Get Complete ANSS Trend Analysis ➞ | |
 | CTSH Cognizant Technology Solutions Corporation |
| Sector: Technology | |
| SubSector: Information Technology Services | |
| MarketCap: 26249.7 Millions | |
| Recent Price: 66.25 Smart Investing & Trading Score: 42 | |
| Day Percent Change: -0.03% Day Change: -0.02 | |
| Week Change: -1.03% Year-to-date Change: -12.3% | |
| CTSH Links: Profile News Message Board | |
| Charts:- Daily , Weekly | |
| Add CTSH to Watchlist: View: Get Complete CTSH Trend Analysis ➞ | |
 | MTCH Match Group, Inc. |
| Sector: Technology | |
| SubSector: Internet Information Providers | |
| MarketCap: 14655.8 Millions | |
| Recent Price: 31.93 Smart Investing & Trading Score: 37 | |
| Day Percent Change: 2.05% Day Change: 0.64 | |
| Week Change: 0.13% Year-to-date Change: -12.5% | |
| MTCH Links: Profile News Message Board | |
| Charts:- Daily , Weekly | |
| Add MTCH to Watchlist: View: Get Complete MTCH Trend Analysis ➞ | |
 | ZI ZoomInfo Technologies Inc. |
| Sector: Technology | |
| SubSector: Software Application | |
| MarketCap: 15937 Millions | |
| Recent Price: 16.10 Smart Investing & Trading Score: 52 | |
| Day Percent Change: -2.31% Day Change: -0.38 | |
| Week Change: -1.65% Year-to-date Change: -12.9% | |
| ZI Links: Profile News Message Board | |
| Charts:- Daily , Weekly | |
| Add ZI to Watchlist: View: Get Complete ZI Trend Analysis ➞ | |
 | ACN Accenture plc |
| Sector: Technology | |
| SubSector: Information Technology Services | |
| MarketCap: 106627 Millions | |
| Recent Price: 303.71 Smart Investing & Trading Score: 42 | |
| Day Percent Change: 1.12% Day Change: 3.37 | |
| Week Change: -1.4% Year-to-date Change: -13.5% | |
| ACN Links: Profile News Message Board | |
| Charts:- Daily , Weekly | |
| Add ACN to Watchlist: View: Get Complete ACN Trend Analysis ➞ | |
 | TDY Teledyne Technologies Incorporated |
| Sector: Technology | |
| SubSector: Scientific & Technical Instruments | |
| MarketCap: 9360.43 Millions | |
| Recent Price: 385.34 Smart Investing & Trading Score: 42 | |
| Day Percent Change: -0.07% Day Change: -0.26 | |
| Week Change: 2.86% Year-to-date Change: -13.7% | |
| TDY Links: Profile News Message Board | |
| Charts:- Daily , Weekly | |
| Add TDY to Watchlist: View: Get Complete TDY Trend Analysis ➞ | |
 | ZM Zoom Video Communications, Inc. |
| Sector: Technology | |
| SubSector: Application Software | |
| MarketCap: 36358.1 Millions | |
| Recent Price: 61.82 Smart Investing & Trading Score: 45 | |
| Day Percent Change: -1.61% Day Change: -1.01 | |
| Week Change: -0.29% Year-to-date Change: -14.0% | |
| ZM Links: Profile News Message Board | |
| Charts:- Daily , Weekly | |
| Add ZM to Watchlist: View: Get Complete ZM Trend Analysis ➞ | |
 | BCE BCE Inc. |
| Sector: Technology | |
| SubSector: Telecom Services - Domestic | |
| MarketCap: 37288.3 Millions | |
| Recent Price: 33.60 Smart Investing & Trading Score: 74 | |
| Day Percent Change: 1.85% Day Change: 0.61 | |
| Week Change: 3% Year-to-date Change: -14.7% | |
| BCE Links: Profile News Message Board | |
| Charts:- Daily , Weekly | |
| Add BCE to Watchlist: View: Get Complete BCE Trend Analysis ➞ | |
 | QRVO Qorvo, Inc. |
| Sector: Technology | |
| SubSector: Semiconductor - Broad Line | |
| MarketCap: 9524.32 Millions | |
| Recent Price: 95.95 Smart Investing & Trading Score: 0 | |
| Day Percent Change: 0.29% Day Change: 0.28 | |
| Week Change: -17.82% Year-to-date Change: -14.8% | |
| QRVO Links: Profile News Message Board | |
| Charts:- Daily , Weekly | |
| Add QRVO to Watchlist: View: Get Complete QRVO Trend Analysis ➞ | |
 | CCI Crown Castle International Corp. (REIT) |
| Sector: Technology | |
| SubSector: Diversified Communication Services | |
| MarketCap: 57615.4 Millions | |
| Recent Price: 97.39 Smart Investing & Trading Score: 67 | |
| Day Percent Change: 0.99% Day Change: 0.95 | |
| Week Change: 4.07% Year-to-date Change: -15.5% | |
| CCI Links: Profile News Message Board | |
| Charts:- Daily , Weekly | |
| Add CCI to Watchlist: View: Get Complete CCI Trend Analysis ➞ | |
 | AKAM Akamai Technologies, Inc. |
| Sector: Technology | |
| SubSector: Internet Information Providers | |
| MarketCap: 14495.5 Millions | |
| Recent Price: 99.67 Smart Investing & Trading Score: 10 | |
| Day Percent Change: -0.07% Day Change: -0.07 | |
| Week Change: -1.98% Year-to-date Change: -15.8% | |
| AKAM Links: Profile News Message Board | |
| Charts:- Daily , Weekly | |
| Add AKAM to Watchlist: View: Get Complete AKAM Trend Analysis ➞ | |
 | DNB Dun & Bradstreet Holdings, Inc. |
| Sector: Technology | |
| SubSector: Information Technology Services | |
| MarketCap: 10887 Millions | |
| Recent Price: 9.72 Smart Investing & Trading Score: 50 | |
| Day Percent Change: 2.42% Day Change: 0.23 | |
| Week Change: 3.96% Year-to-date Change: -16.9% | |
| DNB Links: Profile News Message Board | |
| Charts:- Daily , Weekly | |
| Add DNB to Watchlist: View: Get Complete DNB Trend Analysis ➞ | |
 | PAYC Paycom Software, Inc. |
| Sector: Technology | |
| SubSector: Application Software | |
| MarketCap: 13041.6 Millions | |
| Recent Price: 171.29 Smart Investing & Trading Score: 10 | |
| Day Percent Change: 2.74% Day Change: 4.57 | |
| Week Change: -9.32% Year-to-date Change: -17.1% | |
| PAYC Links: Profile News Message Board | |
| Charts:- Daily , Weekly | |
| Add PAYC to Watchlist: View: Get Complete PAYC Trend Analysis ➞ | |
 | ERIC Telefonaktiebolaget LM Ericsson (publ) |
| Sector: Technology | |
| SubSector: Communication Equipment | |
| MarketCap: 27041.1 Millions | |
| Recent Price: 5.21 Smart Investing & Trading Score: 57 | |
| Day Percent Change: 1.17% Day Change: 0.06 | |
| Week Change: 0.58% Year-to-date Change: -17.3% | |
| ERIC Links: Profile News Message Board | |
| Charts:- Daily , Weekly | |
| Add ERIC to Watchlist: View: Get Complete ERIC Trend Analysis ➞ | |
 | ASAN Asana, Inc. |
| Sector: Technology | |
| SubSector: Software Application | |
| MarketCap: 45087 Millions | |
| Recent Price: 15.72 Smart Investing & Trading Score: 64 | |
| Day Percent Change: 0.58% Day Change: 0.09 | |
| Week Change: 4.24% Year-to-date Change: -17.3% | |
| ASAN Links: Profile News Message Board | |
| Charts:- Daily , Weekly | |
| Add ASAN to Watchlist: View: Get Complete ASAN Trend Analysis ➞ | |
| For tabular summary view of above stock list: Summary View ➞ 0 - 25 , 25 - 50 , 50 - 75 , 75 - 100 , 100 - 125 , 125 - 150 , 150 - 175 , 175 - 200 | ||
| Click To Change The Sort Order: By Market Cap or Company Size Performance: Year-to-date, Week and Day | |
| Select Chart Type: | ||
|
Best Stocks Today 12Stocks.com |
© 2024 12Stocks.com Terms & Conditions Privacy Contact Us
All Information Provided Only For Education And Not To Be Used For Investing or Trading. See Terms & Conditions


One More Thing ... Get Best Stocks Delivered Daily!
Never Ever Miss A Move With Our Top Ten Stocks Lists
Find Best Stocks In Any Market - Bull or Bear Market
Take A Peek At Our Top Ten Stocks Lists: Daily, Weekly, Year-to-Date & Top Trends
Find Best Stocks In Any Market - Bull or Bear Market
Take A Peek At Our Top Ten Stocks Lists: Daily, Weekly, Year-to-Date & Top Trends
Technology Stocks With Best Up Trends [0-bearish to 100-bullish]: WideOpenWest [100], FTC Solar[100], Clearfield [100], OneSpan [100], Itron [100], Cardlytics [100], First Solar[100], Apple [100], Cricut [100], Motorola [100], Conduent [100]
Best Technology Stocks Year-to-Date:
MicroCloud Hologram[553.24%], MediaCo Holding[400%], Bakkt [199.55%], Uxin [188.16%], Smith Micro[183.29%], Super Micro[175.35%], CXApp [157.92%], CuriosityStream [109.22%], SoundHound AI[103.27%], NextNav [100.67%], MediaAlpha [99.64%] Best Technology Stocks This Week:
Bakkt [1571.25%], Luna Innovations[53.77%], SYLA [48.97%], 2U [41.49%], WideOpenWest [40.06%], FTC Solar[32.15%], Mitcham Industries[31.57%], Koninklijke Philips[27.29%], Conduent [26.47%], Cogint [25.08%], AXT [23.23%] Best Technology Stocks Daily:
Luna Innovations[36.00%], WideOpenWest [28.23%], Upland Software[28.22%], 2U [26.63%], FTC Solar[25.09%], Arteris [21.36%], AXT [20.79%], Aurora Innovation[18.09%], Clearfield [13.22%], OneSpan [13.15%], Paylocity Holding[12.05%]