
 Login Sign Up


| |||||
 |  | ||||

| 12Stocks.com Market Intelligence |
Best Tech Stocks
| In a hurry? Tech Stocks Lists: Performance & Trends, Stock Charts, FANG Stocks
Sort Tech stocks: Daily, Weekly, Year-to-Date, Market Cap & Trends. Filter Tech stocks list by size:All Tech Large Mid-Range Small and MicroCap |
| 12Stocks.com Tech Stocks Performances & Trends Daily | |||||||||
|
|  The overall Smart Investing & Trading Score is 100 (0-bearish to 100-bullish) which puts Technology sector in short term bullish trend. The Smart Investing & Trading Score from previous trading session is 90 and an improvement of trend continues.
| ||||||||
Here are the Smart Investing & Trading Scores of the most requested Technology stocks at 12Stocks.com (click stock name for detailed review):
|


| 12Stocks.com: Investing in Technology sector with Stocks | |
|
The following table helps investors and traders sort through current performance and trends (as measured by Smart Investing & Trading Score) of various
stocks in the Tech sector. Quick View: Move mouse or cursor over stock symbol (ticker) to view short-term technical chart and over stock name to view long term chart. Click on  to add stock symbol to your watchlist and to add stock symbol to your watchlist and  to view watchlist. Click on any ticker or stock name for detailed market intelligence report for that stock. to view watchlist. Click on any ticker or stock name for detailed market intelligence report for that stock. |
12Stocks.com Performance of Stocks in Tech Sector
| Ticker | Stock Name | Watchlist | Category | Recent Price | Smart Investing & Trading Score | Change % | YTD Change% |
| SATS | EchoStar Corp |   | Telecom | 79.00 | 90 | -0.63 | 247.25% |
| CRWD | Crowdstrike | | Software - Infrastructure | 496.80 | 80 | -0.63 | 43.03% |
| CSCO | Cisco Systems | | Communication | 68.31 | 70 | -0.64 | 17.85% |
| SSNC | SS&C | | Software - | 87.49 | 20 | -0.67 | 16.64% |
| DIS | Walt Disney | | Entertainment | 112.14 | 0 | -0.72 | 1.62% |
| GLW | Corning | | Electronic Components | 82.52 | 80 | -0.72 | 78.68% |
| DCM | NTT DOCOMO | | Communication | 4.16 | 10 | -0.72 | 0.00% |
| NFLX | Netflix | | Entertainment | 1162.30 | 10 | -0.73 | 31.08% |
| DDOG | Datadog | | Software - | 151.57 | 100 | -0.74 | 5.53% |
| TME | Tencent Music | | Internet Content & Information | 22.95 | 20 | -0.74 | 102.74% |
| MSFT | Microsoft | | Software - Infrastructure | 515.74 | 60 | -0.76 | 23.69% |
| OMC | Omnicom | | Advertising Agencies | 76.85 | 40 | -0.77 | -9.47% |
| STX | Seagate | | Computer Hardware | 254.74 | 100 | -0.82 | 198.87% |
| HPQ | HP | | Computer Hardware | 26.48 | 30 | -0.82 | -16.67% |
| APH | Amphenol Corp | | Electronic Components | 123.58 | 80 | -0.87 | 79.86% |
| IPG | Interpublic | | Advertising Agencies | 26.26 | 40 | -0.94 | -4.19% |
| VOD | Vodafone | | Telecom | 11.42 | 40 | -0.95 | 37.61% |
| LITE | Lumentum | | Communication | 169.77 | 90 | -0.95 | 98.33% |
| VZ | Verizon | | Telecom | 43.40 | 40 | -0.98 | 13.47% |
| LSCC | Lattice Semiconductor | | Semiconductors | 72.88 | 80 | -0.98 | 30.26% |
| BCE | BCE | | Telecom | 23.23 | 30 | -1.02 | 4.25% |
| DVMT | Dell | | Computer | 795.75 | 70 | -1.06 | 0.00% |
| CHT | Chunghwa Telecom | | Telecom | 43.41 | 10 | -1.07 | 20.22% |
| MNDY | Monday.Com | | Software - | 182.26 | 10 | -1.12 | -21.11% |
| TEF | Telefonica S.A | | Telecom | 5.02 | 10 | -1.18 | 27.72% |
| For chart view version of above stock list: Chart View ➞ 0 - 25 , 25 - 50 , 50 - 75 , 75 - 100 , 100 - 125 , 125 - 150 , 150 - 175 , 175 - 200 , 200 - 225 , 225 - 250 , 250 - 275 | ||
 | Click To Change The Sort Order: By Market Cap or Company Size Performance: Year-to-date, Week and Day |  |
|
Get the most comprehensive stock market coverage daily at 12Stocks.com ➞ Best Stocks Today ➞ Best Stocks Weekly ➞ Best Stocks Year-to-Date ➞ Best Stocks Trends ➞  Best Stocks Today 12Stocks.com Best Nasdaq Stocks ➞ Best S&P 500 Stocks ➞ Best Tech Stocks ➞ Best Biotech Stocks ➞ |
| Detailed Overview of Tech Stocks |
| Tech Technical Overview, Leaders & Laggards, Top Tech ETF Funds & Detailed Tech Stocks List, Charts, Trends & More |
| Tech Sector: Technical Analysis, Trends & YTD Performance | |
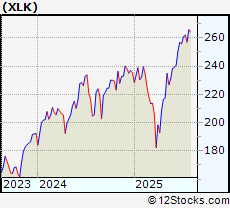
| Technology sector is composed of stocks
from semiconductors, software, web, social media
and services subsectors. Technology sector, as represented by XLK, an exchange-traded fund [ETF] that holds basket of tech stocks (e.g, Intel, Google) is up by 23.7823% and is currently outperforming the overall market by 9.0244% year-to-date. Below is a quick view of technical charts and trends: |
|
 XLK Weekly Chart |
|
| Long Term Trend: Very Good | |
| Medium Term Trend: Good | |
 XLK Daily Chart |
|
| Short Term Trend: Very Good | |
| Overall Trend Score: 100 | |
| YTD Performance: 23.7823% | |
| **Trend Scores & Views Are Only For Educational Purposes And Not For Investing | |
| 12Stocks.com: Top Performing Technology Sector Stocks | ||||||||||||||||||||||||||||||||||||||||||||||||
 The top performing Technology sector stocks year to date are
Now, more recently, over last week, the top performing Technology sector stocks on the move are


|
||||||||||||||||||||||||||||||||||||||||||||||||
| 12Stocks.com: Investing in Tech Sector using Exchange Traded Funds | |
|
The following table shows list of key exchange traded funds (ETF) that
help investors track Tech Index. For detailed view, check out our ETF Funds section of our website. Quick View: Move mouse or cursor over ETF symbol (ticker) to view short-term technical chart and over ETF name to view long term chart. Click on ticker or stock name for detailed view. Click on to add stock symbol to your watchlist and to view watchlist. |
12Stocks.com List of ETFs that track Tech Index
| Ticker | ETF Name | Watchlist | Recent Price | Smart Investing & Trading Score | Change % | Week % | Year-to-date % |
| IGN | Tech-Multimd Ntwk | | 53.86 | 40 | 0.918119 | -20.6435 | 0% |
| 12Stocks.com: Charts, Trends, Fundamental Data and Performances of Tech Stocks | |
|
We now take in-depth look at all Tech stocks including charts, multi-period performances and overall trends (as measured by Smart Investing & Trading Score). One can sort Tech stocks (click link to choose) by Daily, Weekly and by Year-to-Date performances. Also, one can sort by size of the company or by market capitalization. |
| Select Your Default Chart Type: | |||||
| |||||
| Click on stock symbol or name for detailed view. Click on to add stock symbol to your watchlist and to view watchlist. Quick View: Move mouse or cursor over "Daily" to quickly view daily technical stock chart and over "Weekly" to view weekly technical stock chart. | |||||


 | SATS EchoStar Corp |
| Sector: Technology | |
| SubSector: Telecom Services | |
| MarketCap: 19346.1 Millions | |
| Recent Price: 79.00 Smart Investing & Trading Score: 90 | |
| Day Percent Change: -0.628931% Day Change: -0.15 | |
| Week Change: 8.07114% Year-to-date Change: 247.3% | |
| SATS Links: Profile News Message Board | |
| Charts:- Daily , Weekly | |
| Add SATS to Watchlist: View: Get Complete SATS Trend Analysis ➞ | |
 | CRWD Crowdstrike Holdings Inc |
| Sector: Technology | |
| SubSector: Software - Infrastructure | |
| MarketCap: 104806 Millions | |
| Recent Price: 496.80 Smart Investing & Trading Score: 80 | |
| Day Percent Change: -0.632051% Day Change: -3.35 | |
| Week Change: 4.29744% Year-to-date Change: 43.0% | |
| CRWD Links: Profile News Message Board | |
| Charts:- Daily , Weekly | |
| Add CRWD to Watchlist: View: Get Complete CRWD Trend Analysis ➞ | |
 | CSCO Cisco Systems, Inc |
| Sector: Technology | |
| SubSector: Communication Equipment | |
| MarketCap: 264469 Millions | |
| Recent Price: 68.31 Smart Investing & Trading Score: 70 | |
| Day Percent Change: -0.644364% Day Change: -0.08 | |
| Week Change: 1.46613% Year-to-date Change: 17.8% | |
| CSCO Links: Profile News Message Board | |
| Charts:- Daily , Weekly | |
| Add CSCO to Watchlist: View: Get Complete CSCO Trend Analysis ➞ | |
 | SSNC SS&C Technologies Holdings Inc |
| Sector: Technology | |
| SubSector: Software - Application | |
| MarketCap: 21686.8 Millions | |
| Recent Price: 87.49 Smart Investing & Trading Score: 20 | |
| Day Percent Change: -0.669846% Day Change: -0.34 | |
| Week Change: -0.500398% Year-to-date Change: 16.6% | |
| SSNC Links: Profile News Message Board | |
| Charts:- Daily , Weekly | |
| Add SSNC to Watchlist: View: Get Complete SSNC Trend Analysis ➞ | |
 | DIS Walt Disney Co |
| Sector: Technology | |
| SubSector: Entertainment | |
| MarketCap: 211994 Millions | |
| Recent Price: 112.14 Smart Investing & Trading Score: 0 | |
| Day Percent Change: -0.717131% Day Change: -0.38 | |
| Week Change: -1.13727% Year-to-date Change: 1.6% | |
| DIS Links: Profile News Message Board | |
| Charts:- Daily , Weekly | |
| Add DIS to Watchlist: View: Get Complete DIS Trend Analysis ➞ | |
 | GLW Corning, Inc |
| Sector: Technology | |
| SubSector: Electronic Components | |
| MarketCap: 60982.7 Millions | |
| Recent Price: 82.52 Smart Investing & Trading Score: 80 | |
| Day Percent Change: -0.721848% Day Change: -0.08 | |
| Week Change: 3.26617% Year-to-date Change: 78.7% | |
| GLW Links: Profile News Message Board | |
| Charts:- Daily , Weekly | |
| Add GLW to Watchlist: View: Get Complete GLW Trend Analysis ➞ | |
 | DCM NTT DOCOMO, Inc. |
| Sector: Technology | |
| SubSector: Diversified Communication Services | |
| MarketCap: 94439.2 Millions | |
| Recent Price: 4.16 Smart Investing & Trading Score: 10 | |
| Day Percent Change: -0.71599% Day Change: -9999 | |
| Week Change: -99.9887% Year-to-date Change: 0.0% | |
| DCM Links: Profile News Message Board | |
| Charts:- Daily , Weekly | |
| Add DCM to Watchlist: View: Get Complete DCM Trend Analysis ➞ | |
 | NFLX Netflix Inc |
| Sector: Technology | |
| SubSector: Entertainment | |
| MarketCap: 528532 Millions | |
| Recent Price: 1162.30 Smart Investing & Trading Score: 10 | |
| Day Percent Change: -0.734478% Day Change: -11.9 | |
| Week Change: -3.45945% Year-to-date Change: 31.1% | |
| NFLX Links: Profile News Message Board | |
| Charts:- Daily , Weekly | |
| Add NFLX to Watchlist: View: Get Complete NFLX Trend Analysis ➞ | |
 | DDOG Datadog Inc |
| Sector: Technology | |
| SubSector: Software - Application | |
| MarketCap: 47457.2 Millions | |
| Recent Price: 151.57 Smart Investing & Trading Score: 100 | |
| Day Percent Change: -0.740013% Day Change: -0.63 | |
| Week Change: 10.9834% Year-to-date Change: 5.5% | |
| DDOG Links: Profile News Message Board | |
| Charts:- Daily , Weekly | |
| Add DDOG to Watchlist: View: Get Complete DDOG Trend Analysis ➞ | |
 | TME Tencent Music Entertainment Group ADR |
| Sector: Technology | |
| SubSector: Internet Content & Information | |
| MarketCap: 14109.9 Millions | |
| Recent Price: 22.95 Smart Investing & Trading Score: 20 | |
| Day Percent Change: -0.735294% Day Change: -0.29 | |
| Week Change: -3.16456% Year-to-date Change: 102.7% | |
| TME Links: Profile News Message Board | |
| Charts:- Daily , Weekly | |
| Add TME to Watchlist: View: Get Complete TME Trend Analysis ➞ | |
 | MSFT Microsoft Corporation |
| Sector: Technology | |
| SubSector: Software - Infrastructure | |
| MarketCap: 3679420 Millions | |
| Recent Price: 515.74 Smart Investing & Trading Score: 60 | |
| Day Percent Change: -0.763888% Day Change: -2.57 | |
| Week Change: 1.09576% Year-to-date Change: 23.7% | |
| MSFT Links: Profile News Message Board | |
| Charts:- Daily , Weekly | |
| Add MSFT to Watchlist: View: Get Complete MSFT Trend Analysis ➞ | |
 | OMC Omnicom Group, Inc |
| Sector: Technology | |
| SubSector: Advertising Agencies | |
| MarketCap: 15387.4 Millions | |
| Recent Price: 76.85 Smart Investing & Trading Score: 40 | |
| Day Percent Change: -0.774693% Day Change: -0.47 | |
| Week Change: -0.285455% Year-to-date Change: -9.5% | |
| OMC Links: Profile News Message Board | |
| Charts:- Daily , Weekly | |
| Add OMC to Watchlist: View: Get Complete OMC Trend Analysis ➞ | |
 | STX Seagate Technology Holdings Plc |
| Sector: Technology | |
| SubSector: Computer Hardware | |
| MarketCap: 40017.3 Millions | |
| Recent Price: 254.74 Smart Investing & Trading Score: 100 | |
| Day Percent Change: -0.81763% Day Change: -3.35 | |
| Week Change: 13.8757% Year-to-date Change: 198.9% | |
| STX Links: Profile News Message Board | |
| Charts:- Daily , Weekly | |
| Add STX to Watchlist: View: Get Complete STX Trend Analysis ➞ | |
 | HPQ HP Inc |
| Sector: Technology | |
| SubSector: Computer Hardware | |
| MarketCap: 27424.2 Millions | |
| Recent Price: 26.48 Smart Investing & Trading Score: 30 | |
| Day Percent Change: -0.82397% Day Change: -0.18 | |
| Week Change: -3.70909% Year-to-date Change: -16.7% | |
| HPQ Links: Profile News Message Board | |
| Charts:- Daily , Weekly | |
| Add HPQ to Watchlist: View: Get Complete HPQ Trend Analysis ➞ | |
 | APH Amphenol Corp |
| Sector: Technology | |
| SubSector: Electronic Components | |
| MarketCap: 134851 Millions | |
| Recent Price: 123.58 Smart Investing & Trading Score: 80 | |
| Day Percent Change: -0.866356% Day Change: -0.91 | |
| Week Change: 0.365467% Year-to-date Change: 79.9% | |
| APH Links: Profile News Message Board | |
| Charts:- Daily , Weekly | |
| Add APH to Watchlist: View: Get Complete APH Trend Analysis ➞ | |
 | IPG Interpublic Group Of Cos., Inc |
| Sector: Technology | |
| SubSector: Advertising Agencies | |
| MarketCap: 9944.13 Millions | |
| Recent Price: 26.26 Smart Investing & Trading Score: 40 | |
| Day Percent Change: -0.94304% Day Change: -0.18 | |
| Week Change: -0.152091% Year-to-date Change: -4.2% | |
| IPG Links: Profile News Message Board | |
| Charts:- Daily , Weekly | |
| Add IPG to Watchlist: View: Get Complete IPG Trend Analysis ➞ | |
 | VOD Vodafone Group plc ADR |
| Sector: Technology | |
| SubSector: Telecom Services | |
| MarketCap: 28493.3 Millions | |
| Recent Price: 11.42 Smart Investing & Trading Score: 40 | |
| Day Percent Change: -0.954033% Day Change: -0.11 | |
| Week Change: 0.794351% Year-to-date Change: 37.6% | |
| VOD Links: Profile News Message Board | |
| Charts:- Daily , Weekly | |
| Add VOD to Watchlist: View: Get Complete VOD Trend Analysis ➞ | |
 | LITE Lumentum Holdings Inc |
| Sector: Technology | |
| SubSector: Communication Equipment | |
| MarketCap: 10447.2 Millions | |
| Recent Price: 169.77 Smart Investing & Trading Score: 90 | |
| Day Percent Change: -0.950992% Day Change: -0.3 | |
| Week Change: 11.1424% Year-to-date Change: 98.3% | |
| LITE Links: Profile News Message Board | |
| Charts:- Daily , Weekly | |
| Add LITE to Watchlist: View: Get Complete LITE Trend Analysis ➞ | |
 | VZ Verizon Communications Inc |
| Sector: Technology | |
| SubSector: Telecom Services | |
| MarketCap: 187121 Millions | |
| Recent Price: 43.40 Smart Investing & Trading Score: 40 | |
| Day Percent Change: -0.981063% Day Change: -0.34 | |
| Week Change: 0.509495% Year-to-date Change: 13.5% | |
| VZ Links: Profile News Message Board | |
| Charts:- Daily , Weekly | |
| Add VZ to Watchlist: View: Get Complete VZ Trend Analysis ➞ | |
 | LSCC Lattice Semiconductor Corp |
| Sector: Technology | |
| SubSector: Semiconductors | |
| MarketCap: 9050.17 Millions | |
| Recent Price: 72.88 Smart Investing & Trading Score: 80 | |
| Day Percent Change: -0.978261% Day Change: -0.6 | |
| Week Change: 1.01178% Year-to-date Change: 30.3% | |
| LSCC Links: Profile News Message Board | |
| Charts:- Daily , Weekly | |
| Add LSCC to Watchlist: View: Get Complete LSCC Trend Analysis ➞ | |
 | BCE BCE Inc |
| Sector: Technology | |
| SubSector: Telecom Services | |
| MarketCap: 22787.6 Millions | |
| Recent Price: 23.23 Smart Investing & Trading Score: 30 | |
| Day Percent Change: -1.02258% Day Change: -0.39 | |
| Week Change: 0.475779% Year-to-date Change: 4.2% | |
| BCE Links: Profile News Message Board | |
| Charts:- Daily , Weekly | |
| Add BCE to Watchlist: View: Get Complete BCE Trend Analysis ➞ | |
 | DVMT Dell Technologies Inc. |
| Sector: Technology | |
| SubSector: Diversified Computer Systems | |
| MarketCap: 13697.5 Millions | |
| Recent Price: 795.75 Smart Investing & Trading Score: 70 | |
| Day Percent Change: -1.05935% Day Change: -9999 | |
| Week Change: 538.849% Year-to-date Change: 0.0% | |
| DVMT Links: Profile News Message Board | |
| Charts:- Daily , Weekly | |
| Add DVMT to Watchlist: View: Get Complete DVMT Trend Analysis ➞ | |
 | CHT Chunghwa Telecom ADR |
| Sector: Technology | |
| SubSector: Telecom Services | |
| MarketCap: 34272.6 Millions | |
| Recent Price: 43.41 Smart Investing & Trading Score: 10 | |
| Day Percent Change: -1.0711% Day Change: -0.65 | |
| Week Change: -1.1612% Year-to-date Change: 20.2% | |
| CHT Links: Profile News Message Board | |
| Charts:- Daily , Weekly | |
| Add CHT to Watchlist: View: Get Complete CHT Trend Analysis ➞ | |
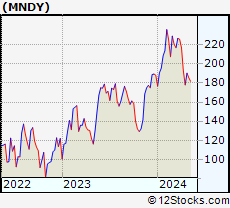 | MNDY Monday.Com Ltd |
| Sector: Technology | |
| SubSector: Software - Application | |
| MarketCap: 9430.13 Millions | |
| Recent Price: 182.26 Smart Investing & Trading Score: 10 | |
| Day Percent Change: -1.11762% Day Change: -2.42 | |
| Week Change: -14.1902% Year-to-date Change: -21.1% | |
| MNDY Links: Profile News Message Board | |
| Charts:- Daily , Weekly | |
| Add MNDY to Watchlist: View: Get Complete MNDY Trend Analysis ➞ | |
 | TEF Telefonica S.A ADR |
| Sector: Technology | |
| SubSector: Telecom Services | |
| MarketCap: 30106.5 Millions | |
| Recent Price: 5.02 Smart Investing & Trading Score: 10 | |
| Day Percent Change: -1.1811% Day Change: -0.07 | |
| Week Change: -1.1811% Year-to-date Change: 27.7% | |
| TEF Links: Profile News Message Board | |
| Charts:- Daily , Weekly | |
| Add TEF to Watchlist: View: Get Complete TEF Trend Analysis ➞ | |
| For tabular summary view of above stock list: Summary View ➞ 0 - 25 , 25 - 50 , 50 - 75 , 75 - 100 , 100 - 125 , 125 - 150 , 150 - 175 , 175 - 200 , 200 - 225 , 225 - 250 , 250 - 275 | ||
| Click To Change The Sort Order: By Market Cap or Company Size Performance: Year-to-date, Week and Day | |
| Select Chart Type: | ||
|
Best Stocks Today 12Stocks.com |
© 2025 12Stocks.com Terms & Conditions Privacy Contact Us
All Information Provided Only For Education And Not To Be Used For Investing or Trading. See Terms & Conditions


One More Thing ... Get Best Stocks Delivered Daily!
Never Ever Miss A Move With Our Top Ten Stocks Lists
Find Best Stocks In Any Market - Bull or Bear Market
Take A Peek At Our Top Ten Stocks Lists: Daily, Weekly, Year-to-Date & Top Trends
Find Best Stocks In Any Market - Bull or Bear Market
Take A Peek At Our Top Ten Stocks Lists: Daily, Weekly, Year-to-Date & Top Trends
Technology Stocks With Best Up Trends [0-bearish to 100-bullish]: Sony [100], Bakkt [100], Rigetti Computing[100], Fair Isaac[100], Arqit Quantum[100], D-Wave Quantum[100], Navitas Semiconductor[100], Shoals [100], Vuzix [100], Arteris [100], Lantronix [100]
Best Technology Stocks Year-to-Date:
Xunlei [370.476%], Sify [315.033%], Wolfspeed [307.01%], Digital Turbine[265.057%], EchoStar Corp[247.253%], CuriosityStream [241.605%], Viasat [224.029%], Pagaya [222.638%], Oneconnect Financial[209.053%], D-Wave Quantum[203.954%], CommScope Holding[203.101%] Best Technology Stocks This Week:
GTT [443626%], Barracuda Networks[71050%], Mobile TeleSystems[10483.5%], Nam Tai[5033.33%], Ebix [4200.85%], Fang [4150%], NantHealth [3114.02%], Hemisphere Media[2981.82%], Yandex N.V[2935.27%], Wolfspeed [1961.98%], Castlight Health[1751.96%] Best Technology Stocks Daily:
Sony [194.565%], Bakkt [28.6091%], Rigetti Computing[18.4925%], Fair Isaac[17.979%], Arqit Quantum[17.9369%], Marti [17%], Latch [16.6667%], Oclaro [14.734%], D-Wave Quantum[13.968%], Arbe Robotics[13.0178%], Navitas Semiconductor[12.3288%]